

Abstract
The SARS‐CoV‐2 coronavirus encodes an essential papain‐like protease domain as part of its non‐structural protein (nsp)‐3, namely SARS2 PLpro, that cleaves the viral polyprotein, but also removes ubiquitin‐like ISG15 protein modifications as well as, with lower activity, Lys48‐linked polyubiquitin. Structures of PLpro bound to ubiquitin and ISG15 reveal that the S1 ubiquitin‐binding site is responsible for high ISG15 activity, while the S2 binding site provides Lys48 chain specificity and cleavage efficiency. To identify PLpro inhibitors in a repurposing approach, screening of 3,727 unique approved drugs and clinical compounds against SARS2 PLpro identified no compounds that inhibited PLpro consistently or that could be validated in counterscreens. More promisingly, non‐covalent small molecule SARS PLpro inhibitors also target SARS2 PLpro, prevent self‐processing of nsp3 in cells and display high potency and excellent antiviral activity in a SARS‐CoV‐2 infection model.
Keywords: COVID‐19, ISG15, papain‐like protease, small molecule inhibitor, ubiquitin
Subject Categories: Microbiology, Virology & Host Pathogen Interaction; Post-translational Modifications, Proteolysis & Proteomics; Structural Biology
Crystal structure and biochemical analysis explains the specificity of SARS‐CoV‐2 PLpro for ISG15 and longer Lys48‐linked ubiquitin chains leading to the identification of inhibitors that show promising antiviral activity in a SARS‐CoV‐2 infection model.
Introduction
The COVID‐19 pandemic unfolding globally in the first half of 2020 (Dong et al, 2020) is caused by the novel coronavirus SARS‐CoV‐2 (Coronaviridae Study Group of the International Committee on Taxonomy of Viruses, 2020) and has highlighted, amongst many things, the general lack of antiviral small molecule drugs to fight a global coronavirus pandemic. Proteolytic enzymes are critical for coronaviruses expressing their protein machinery as a polyprotein that requires cleavage into functional units (Baez‐Santos et al, 2015; Bailey‐Elkin et al, 2017). As a result, coronaviruses with blocked protease activity lose their ability to replicate in cells (Kim et al, 1995). Drugging the proteases in SARS‐CoV‐2 is therefore a current focus of concerted global academic and pharma efforts (Ghosh et al, 2020).
SARS‐CoV‐2 encodes two proteases, the papain‐like protease (PLpro, encoded within nsp3) and 3‐chymotrypsin‐like “main” protease (3CLpro or Mpro, encoded by nsp5). PLpro cleaves nsp1, nsp2 and nsp3 (Fig 1A), and 3CLpro processes the remaining 13 non‐structural proteins. After their generation, the nsps assemble the viral replicase complex on host membranes, initiating replication and transcription of the viral genome (Barretto et al, 2005; Baez‐Santos et al, 2015).
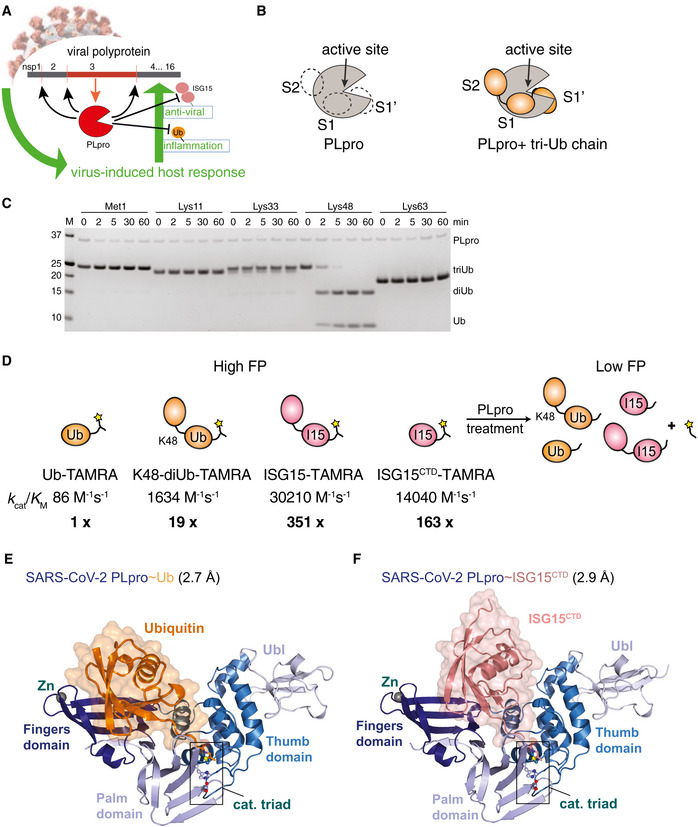
Figure 1. Biophysical and structural characterisation of PLpro activity.
-
ACartoon of coronavirus PLpro activities. PLpro is encoded as one of various domains of the 1,900 amino acid non‐structural protein nsp3 and is thought to have three functions: (i) cleaving the viral polyprotein to generate mature nsp1, nsp2 and nsp3; (ii) hydrolysing ubiquitin chains important for inflammatory responses and (iii) removing interferon‐stimulated gene 15 (ISG15) modifications from proteins, reversing antiviral responses.
-
BSchematic of ubiquitin‐binding sites in SARS PLpro, which binds Lys48‐triubiquitin via S2, S1 and S1′ ubiquitin‐binding sites. Hydrolysis occurs between ubiquitin molecules bound at S1 and S1′.
-
CTime course analysis of triubiquitin (2 μM) hydrolysis using 250 nM SARS2 PLpro, resolved on a Coomassie‐stained SDS–PAGE gel. Linkage‐specific cleavage of Lys48‐linked triubiquitin to di‐ and monoubiquitin resembles SARS PLpro activity (Békés et al, 2015, 2016). See Appendix Fig S1B–D for gel‐based cleavage quantification.
-
DOverview of the catalytic efficiencies of PLpro. A fluorescence polarisation (FP) assay was used to derive the catalytic efficiencies (k cat/K M) of PLpro for the depicted substrates. Catalytic efficiencies were calculated from data shown in Appendix Fig S1A, as described in Materials and Methods. Substrate preference is indicated by x‐fold activity relative to Ub‐TAMRA cleavage.
-
ECrystal structure at 2.7 Å resolution of SARS2 PLpro with subdomains coloured in shades of blue, bound to ubiquitin propargylamine (Ub‐PA, orange). Catalytic triad residues are shown in ball‐and-stick representation, and a Zn ion is indicated as a grey sphere. Also see Appendix Fig S2 and Table 1.
-
FCrystal structure at 2.9 Å resolution of SARS2 PLpro (blue) bound to ISG15 C‐terminal domain propargylamide (ISGCTD‐PA, salmon). Also see Appendix Fig S2 and Table 1.
Source data are available online for this figure.
Viral proteases can have additional functions and can, for example, act to inhibit host innate immune responses that are mounted initially as an inflammatory response, and subsequently as an interferon response. The interferon system generates an antiviral state in host cells through transcriptional upregulation of more than 300 interferon‐stimulated genes (ISGs), to efficiently detect and respond to viral threats (Ivashkiv & Donlin, 2014). Dysregulated inflammatory responses are a hallmark of COVID‐19, and substantial morbidity and mortality is associated with overzealous immune responses (a “cytokine storm”), causing collateral damage (Berlin et al, 2020).
A common mechanism by which viral proteases regulate innate immune pathways is through antagonising ubiquitin and ubiquitin‐like modifications (Fig 1A; Isaacson & Ploegh, 2009; Heaton et al, 2016). Protein ubiquitination is complex due to the occurrence of many ubiquitin chain architectures that encode non‐degradative and degradative functions (Swatek & Komander, 2016; Yau & Rape, 2016). Inflammatory signalling pathways rely on distinct ubiquitin signals that are regulated by intricate mechanisms in human cells (Ebner et al, 2017). ISG15 is a ubiquitin‐like (Ubl) modification induced upon viral infection and comprises two fused Ubl‐folds, structurally resembling diubiquitin (Perng & Lenschow, 2018; Dzimianski et al, 2019). Only few cellular enzymes remove ISG15, enabling this modification to act as a virus‐induced danger signal. In response, viruses often repurpose their proteases to be efficient deISGylases and deubiquitinases (DUBs). Several leader protease scaffolds have been adopted to target ubiquitin and Ubl modifiers, including ovarian tumour (OTU) domains in Bunyaviridae (Frias‐Staheli et al, 2007; Akutsu et al, 2011; James et al, 2011) and papain‐like proteases in some Picornaviridae (Swatek et al, 2018).
Importantly, coronaviral PLpro enzymes efficiently remove ISG15 and ubiquitin modifications, dampening inflammation and antiviral signalling (Fig 1A; Harcourt et al, 2004; Barretto et al, 2005; Lindner et al, 2005, 2007; Clementz et al, 2010; Békés et al, 2015). A large body of work by the Mesecar, Pegan, Kikkert/Mark and other laboratories has illuminated SARS and MERS PLpro mechanisms in great detail, revealing mechanisms of ubiquitin and ISG15 binding, and identifying small molecule inhibitors for SARS PLpro.
Békés et al (2015, 2016) further identified an interesting feature of the deubiquitinating activity in SARS PLpro. Most DUBs recognise one ubiquitin, via an enzymatic S1 ubiquitin‐binding site, and are able to bind and specifically cleave polyubiquitin by binding to diubiquitin across the active site (i.e. to S1 and S1′ ubiquitin‐binding sites; Mevissen & Komander, 2017). In contrast, SARS PLpro recognises Lys48‐linked polyubiquitin via S1 and S2 ubiquitin‐binding sites, and is hence able to directly remove Lys48‐linked diubiquitin from substrates (Békés et al, 2015, 2016; Fig 1B).
We here extend the studies to SARS2 PLpro and provide kinetic and specificity data revealing a preference of SARS2 PLpro for ISG15 over Lys48‐linked polyubiquitin chains in vitro. We associate the modifier specificity with the S1 ubiquitin‐binding site, explained in two crystal structures of PLpro complexes and mutagenesis. The S2 binding site in SARS2 PLpro has little impact on ISG15 hydrolysis, but instead reinstates Lys48‐chain specificity and activity. Finally, we provide insights into PLpro inhibition. A repurposing screen with FDA‐approved clinical compounds reveals no candidate drugs that inhibit PLpro in vitro. In contrast, previously developed SARS PLpro inhibitors show excellent inhibition and antiviral efficacy, inhibiting nsp3 self‐processing as well as Lys48‐polyubiquitin cleavage in cells, and viral proliferation in an SARS‐CoV‐2 infection model.
Results
Biochemical characterisation of SARS2 PLpro activity
SARS2 PLpro is 83% identical to SARS PLpro (Fig EV1) and would be expected to target ubiquitin and ISG15. Starting with ubiquitin, robust SARS2 PLpro activity and high specificity was observed towards Lys48‐linked polyubiquitin (Fig 1C), where triubiquitin was cleaved to stable di‐ and monoubiquitin products as observed previously for SARS PLpro (Békés et al, 2015, 2016). To gain kinetic insights, we measured PLpro catalytic efficiency (k cat/K M) in a fluorescence polarisation‐based quantitative assay, in which a small Lys‐Gly‐TAMRA (KG‐TAMRA) peptide is linked to ubiquitin via its Lys‐side chain through an isopeptide bond, best resembling a natural substrate (Swatek et al, 2018; Fig 1D, Appendix Fig S1A). SARS2 PLpro hydrolysed a ubiquitin‐TAMRA substrate with low efficiency (86 M−1 s−1). The same KG‐TAMRA peptide was hydrolysed 19‐fold faster (1,634 M−1 s−1) when linked to a non‐cleavable Lys48‐diubiquitin (Fig 1D, Appendix Fig S1A), consistent with SARS2 PLpro preferring longer chains (Fig 1C). This indicated a significant contribution of chain length to PLpro activity, as had been observed for SARS PLpro (Békés et al, 2015, 2016). Strikingly, an ISG15‐TAMRA fluorescent substrate was hydrolysed 350‐fold more efficiently as compared to ubiquitin‐TAMRA (Fig 1D, Appendix Fig S1A), and a substrate comprising only the C‐terminal ubiquitin‐like fold of ISG15 (ISG15CTD‐TAMRA) was still cleaved with 160‐fold higher efficiency compared to ubiquitin (Fig 1D, Appendix Fig S1A). ISG15 versus ubiquitin preference is hence mediated by recognition of one Ubl‐fold, which would bind in the S1 ubiquitin/Ubl‐binding site of PLpro. Similar results were obtained using gel‐based analysis of Lys48‐triubiquitin versus cleavage of proISG15 to mature ISG15; in the latter, a 8‐residue peptide is removed from the ISG15 or ISG15CTD C‐terminus (Swatek et al, 2018). This qualitative assessment of activity suggested similar activities of PLpro towards either substrate (Appendix Fig S1B–D).
Figure EV1. Annotated sequence alignment for coronavirus PLpro.
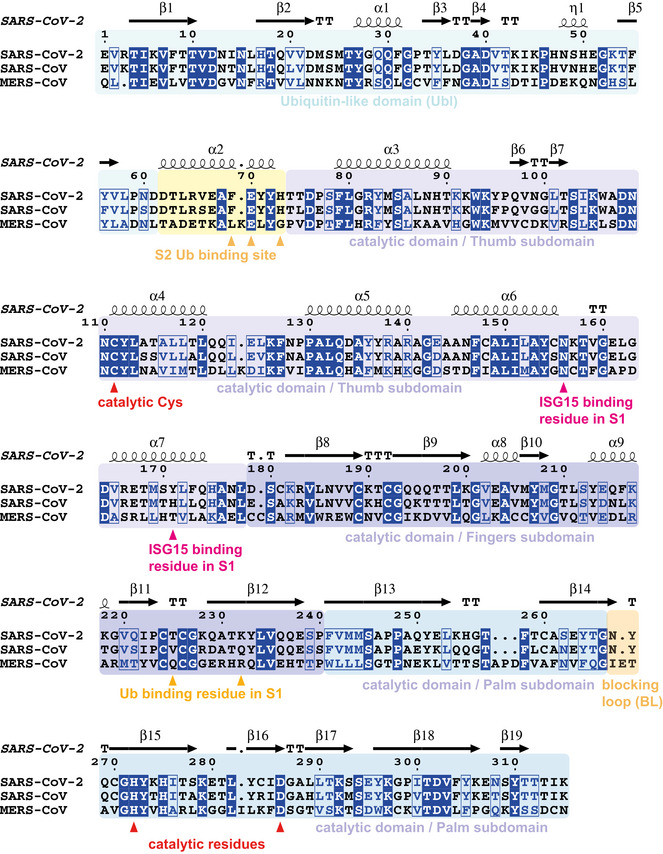
- Sequence alignment generated with T‐coffee/ESPRIPT (Gouet et al, 2003; Magis et al, 2014) aligning PLpro sequences from SARS2, SARS and MERS. Sequence numbering and secondary structure elements are shown according to the high‐resolution apo structure of SARS-CoV‐2 PLpro (pdb 6wrh, unpublished). T, turn. Domains and subdomains are boxed in different colours, and catalytic triad, as well as residues mutated in this study, is indicated.
Hence, while the S1 site of PLpro prefers ISG15 modifications, the S2 site reinstates efficient cleavage of Lys48‐polyubiquitin, exploiting an elegant mechanism of attaining polyubiquitin targeting specificity (Mevissen & Komander, 2017).
Structural analysis of SARS2 PLpro ubiquitin and ISG15 complexes
Differential cleavage of ubiquitin and ISG15CTD substrates (Fig 1D) indicated that the S1 ubiquitin/Ubl‐binding site of PLpro interacts with both modifiers distinctly. SARS2 PLpro crystal structures covalently bound to ubiquitin‐propargylamide (Ub‐PA) at 2.7 Å and to ISG15CTD‐PA at 2.9 Å resolution, enable direct comparison (Fig 1E and F, Appendix Fig S2, Table 1). In concordance with previous structures of SARS and MERS PLpro (Fig EV2), and conceptually resembling human ubiquitin‐specific protease (USP) enzymes (Mevissen & Komander, 2017), PLpro binds ubiquitin in an “open hand” architecture, in which the ubiquitin sits on the “Palm” subdomain and is held in place by the zinc‐binding “Fingers” subdomain, such that the ubiquitin C‐terminus, the site of hydrolysis, reaches into the catalytic centre (Fig 1E, Appendix Fig S2A and B). The structure of SARS2 PLpro, and the position and orientation of the bound ubiquitin molecule, is highly similar to SARS PLpro~Ub (pdb 4m0w, (Chou et al, 2014; Ratia et al, 2014), RMSD of 0.54 Å for PLpro, see Fig EV2).
Table 1.
Data collection and refinement statistics
| SARS2 PLpro~Ub | SARS2 PLpro~ISG15CTD | |
|---|---|---|
| Data collection | ||
| Space group | P 21 21 2 | P 41 21 2 |
| Cell dimensions | ||
| a, b, c (Å) | 64.99, 144.41, 49.60 | 124.17, 124.17, 238.17 |
| α, β, γ (°) | 90.00, 90.00, 90.00 | 90.00, 90.00, 90.00 |
| Resolution (Å) | 48.30–2.70 (2.83–2.70) | 49.28–2.90 (3.01–2.90) |
| R merge (within I+/I−) | 0.152 (1.054) | 0.163 (2.876) |
| < I/σI > | 6.8 (1.8) | 10.5 (1.1) |
| Completeness (%) | 98.1 (98.9) | 100.0 (100.0) |
| Redundancy | 4.6 (4.7) | 13.7 (14.2) |
| Refinement | ||
| Resolution (Å) | 48.30–2.70 | 49.28–2.90 |
| No. reflections | 13,004 | 42,059 |
| R work/R free | 0.210/0.260 | 0.200/0.231 |
| No. atoms | ||
| Protein | 2,986 | 8,876 |
| Ligand/ion | 5 | 63 |
| Water | 32 | 30 |
| B‐factors | ||
| Protein | 58.2 | 102.1 |
| Ligand/ion | 53.1 | 101.7 |
| Water | 45.8 | 77.9 |
| R.m.s. deviations | ||
| Bond lengths (Å) | 0.0024 | 0.0059 |
| Bond angles (°) | 0.66 | 0.94 |
Values in parentheses are for highest resolution shell. All datasets were collected from a single crystal each.
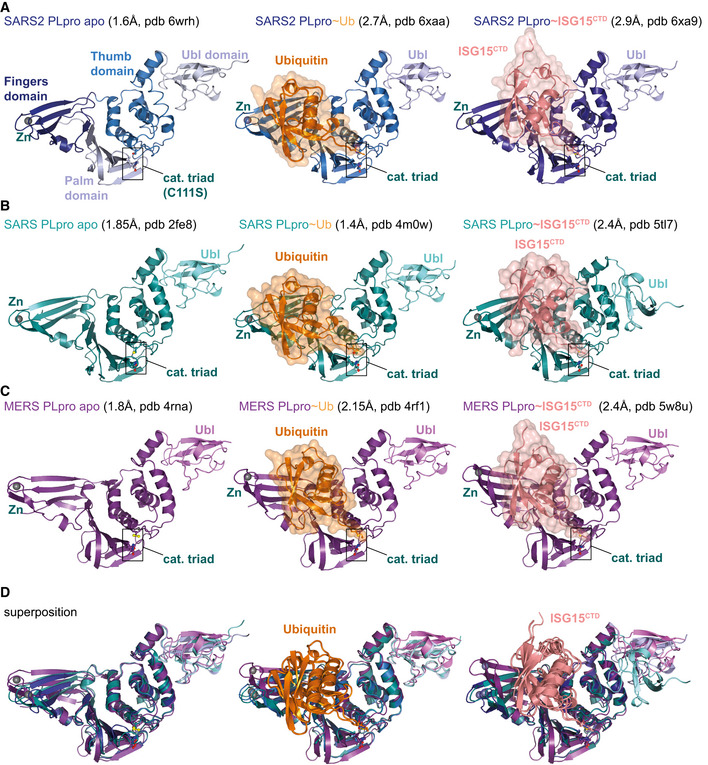
Figure EV2. Selection of available structures of coronavirus PLpro.
-
Aleft, the unpublished structure of apo SARS2 PLpro (pdb 6wrh, 1.6 Å, determined by the Centre for Structural Genomics of Infectious Disease (CSGID)) is coloured in analogy with Figs 1E and EV1, indicating Thumb, Fingers and Palm subdomain. The PLpro fold forms an open right hand that holds the ubiquitin fold, guiding its C‐terminus into the active site. PLpro contains an N‐terminal Ubl domain of unknown function, and this domain can vary in orientation. The high‐resolution structure was generated with a catalytic Cys to Ser mutation; a more common catalytic Cys to Ala mutant destabilises PLpro (Fig EV3D). Middle, structure of SARS2 PLpro bound to ubiquitin (orange, covered by a semi‐transparent surface). Right, structure of SARS2 PLpro bound to the C‐terminal domain of ISG15 (ISG15CTD, salmon, under a semi‐transparent surface). Also see Fig 1. In ubiquitin and ISG15CTD complexes, propargylamide‐based suicide probes (Ekkebus et al, 2013) covalently modify catalytic Cys111.
- B
- C
-
DSuperpositions of PLpro structures with S1 site occupied by different modifiers. Overall, PLpro shows high similarity, extending to the position and orientation of the N‐terminal Ubl domain, with the notable exception of a distinct position of the Ubl in the SARS complex with ISG15CTD (pdb 5tl7 (Daczkowski et al, 2017a)). The second most variable region concerns the Fingers subdomain, which shows varying degrees of “openness.” Superposition shows that the structures of SARS and SARS2 bound to individual modifiers are highly similar, and the modifiers adapt identical orientations and engage in similar interactions with PLpro. MERS PLpro seems to vary on the theme of ubiquitin versus ISG15 recognition, by binding both modifiers similarly. In the MERS ubiquitin complex, the Fingers are more closed, and the ubiquitin is pushed towards the Thumb domain, to adopt a similar orientation and interaction as seen for ISG15 bound to MERS. MERS PLpro ubiquitin complexes have been determined with “open” and more “closed” Fingers (Bailey‐Elkin et al, 2014).
While ISG15CTD sits similarly on the “Palm” subdomain, it interacts with the “Thumb” rather than the “Fingers” subdomain of SARS2 PLpro (Figs 2A and EV3A). The resulting ~ 40° rotation of the Ubl‐fold α‐helix compared to ubiquitin leads to shifts of up to 15 Å for structurally identical residues in the Ubl‐fold (Figs 2A, and EV3A and B). Key interaction sites mediating ISG15CTD‐PLpro contacts are centred around ISG15 Trp123 and Pro130/Glu132, docking ISG15 onto the PLpro α7 helix (Fig EV3C). These interactions dislodge the Ubl‐fold from the Fingers subdomain (Fig 2A). While the complex resembles interaction modes observed in SARS PLpro~ISG15CTD (pdb 5tl7 (Daczkowski et al, 2017a), RMSD of 0.74 Å for PLpro, see Fig EV2), some interacting residues (especially, Tyr171 on helix α7) are not conserved (Figs EV1 and EV3C) and seem to improve the contact in SARS2 PLpro. More variability is seen in MERS PLpro, which binds to ubiquitin and ISG15CTD similarly through its ability to “close” the Fingers subdomain (Bailey‐Elkin et al, 2014) (see Discussion in Fig EV2).
Figure 2. Distinct binding of ubiquitin and ISG15 enables separation of PLpro function.
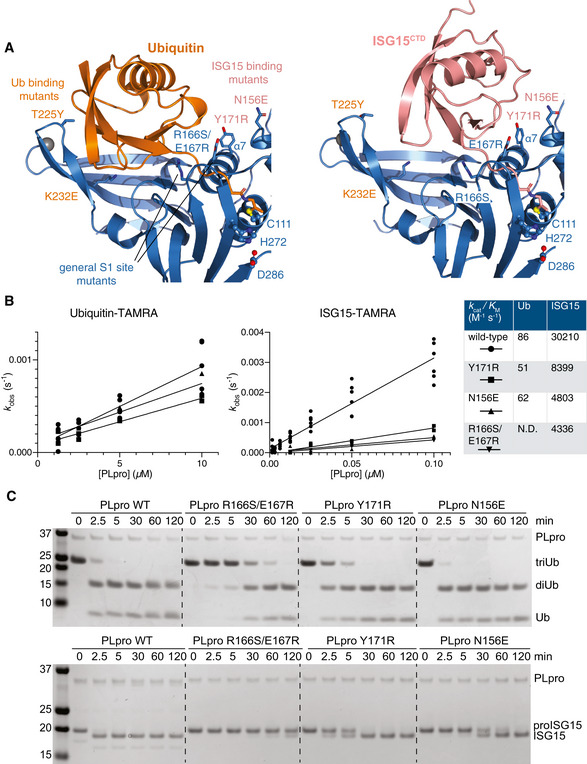
-
ADetail of the S1 ubiquitin‐binding site of SARS2 PLpro, bound to ubiquitin (left) and ISG15 (right), highlighting differential interactions of ubiquitin with the Fingers subdomain, and of ISG15 with the Thumb subdomain of PLpro. Labelled residues were mutated, see Fig EV3.
-
BFluorescence polarisation assays against ubiquitin‐TAMRA and ISG15‐TAMRA using indicated SARS2 PLpro variants performed in technical triplicate and n = 2 for each mutant, and compared to wild‐type PLpro as shown in Appendix Fig S1A. Catalytic efficiencies were calculated as described in Materials and Methods.
-
CGel‐based analysis of PLpro variant activity against Lys48‐triubiquitin and proISG15. Experiments were performed in duplicate. Also see Fig EV3.
Source data are available online for this figure.
Figure EV3. Separation‐of‐function mutations in SARS2 PLpro.
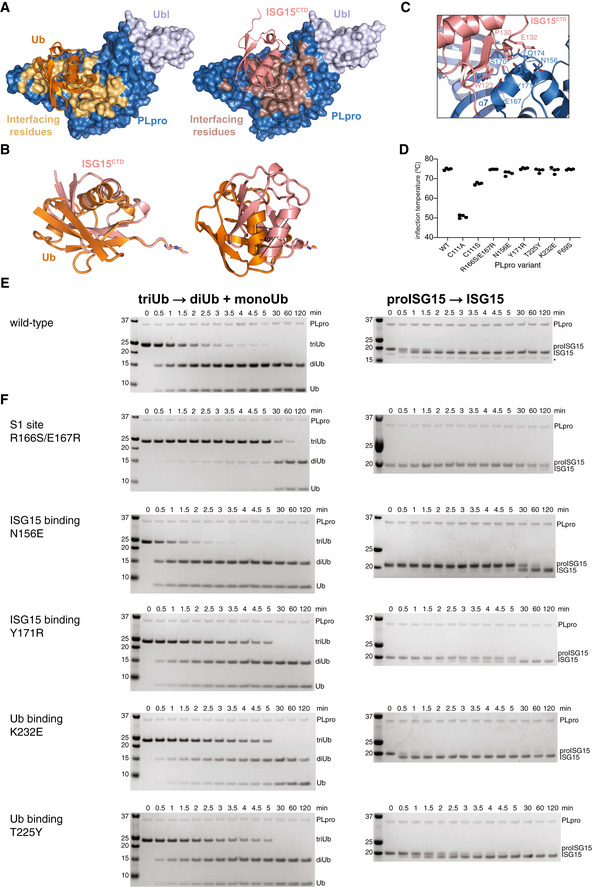
-
AUbiquitin and ISG15 binding site analysis based on PISA analysis, indicating interface residues on SARS2 PLpro.
-
BSuperposition of Ub‐PA (orange) and ISG15CTD‐PA (salmon) as bound to SARS2 PLpro highlights the different binding modes with a ˜ 40° rotation between the two proteins.
-
CDetails of the binding of ISG15CTD and the Thumb domain of SARS2 PLpro. Interacting residues shown as sticks.
-
DMutations in S1 and S2 sites were introduced in PLpro, and the enzyme variants were expressed in bacteria, purified and tested for integrity by assessing the inflection temperature, indicating the transition of folded to unfolded protein. With exception of mutating the catalytic Cys to Ala, which was severely destabilised and precipitated during purification, all other mutants showed similar stability to wild‐type PLpro. Inflection temperature values were determined in technical duplicate from experiments performed twice.
-
E, FTriubiquitin cleavage to mono‐ and diubiquitin (left) and proISG15 cleavage to mature ISG15 (right) were compared side‐by-side over a time course, resolved on SDS–PAGE gels, and visualised by Coomassie staining. Experiments were performed in duplicate with 250 nM enzyme and 2 μM substrate; all gels are shown in Source Data. (E), Activity of wild‐type PLpro, reproduced from Appendix Fig S1B and C, for comparison. (F), S1 site mutants as indicated. See Fig 2.
Source data are available online for this figure.
Binding mode differences in the S1 ubiquitin‐binding site provided an opportunity to generate separation‐of‐function mutations (Figs 2A–C and EV3D–F). A general S1 site mutant, R166S/E167R (Békés et al, 2016), showed severely diminished activity against either modifier (Figs 2B and C, and EV3F). PLpro N156E (and, to a lesser degree, Y171R) resulted in selective decrease of activity in ISG15 cleavage assays, with little impact on ubiquitin cleavage (Figs 2B and C, and EV3F). Mutations selectively impacting ubiquitin but not ISG15 were more challenging to generate but were apparent by gel‐based analysis (see e.g. K232E, Fig EV3F). Similar experiments have recently been described for MERS PLpro (Clasman et al, 2020).
Impact of the S2 ubiquitin‐binding site on polyubiquitin and ISG15 cleavage
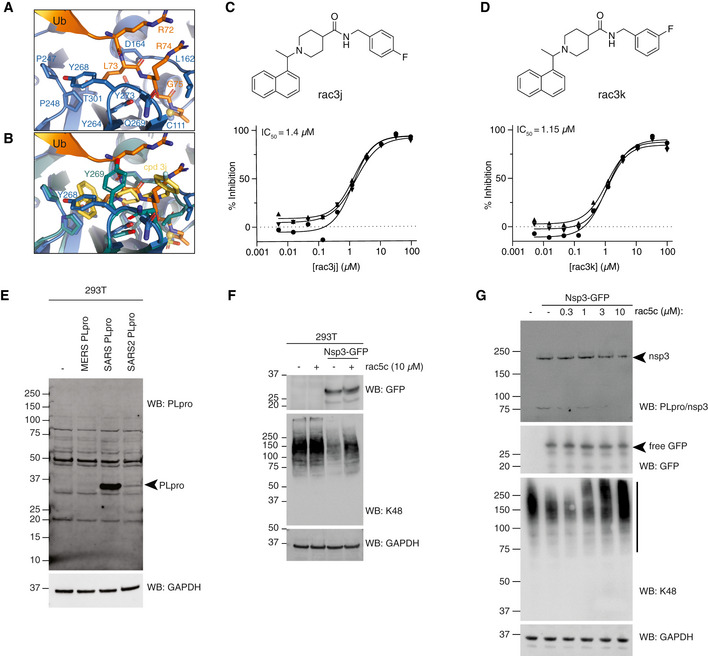
Polyubiquitin cleavage in SARS2 PLpro is significantly enhanced when a longer ubiquitin chain is used (Fig 1C, Appendix Fig S1B), due to an S2 ubiquitin‐binding site provided by the conserved α2 helix of PLpro. Békés et al (2016) showed that a central Phe residue, Phe70, in SARS PLpro (Phe69 in SARS2 PLpro) interacts with the ubiquitin Ile44 patch of the distal ubiquitin in Lys48‐diubiquitin (Figs 3A and B, and EV1).
Figure 3. The S2 site in SARS2 PLpro.
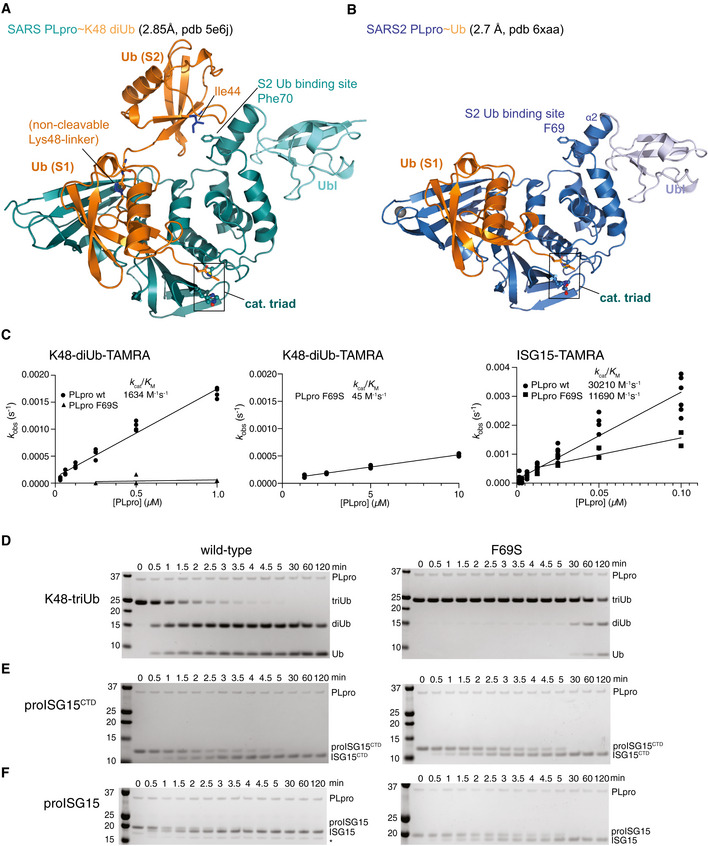
-
AA previous structure of SARS PLpro bound to a non‐hydrolysable, Lys48‐linked diubiquitin probe (pdb 5e6j (Békés et al, 2016)) explained the noted preference of PLpro for longer Lys48‐linked chains. While the proximal ubiquitin unit occupies the S1 site in a highly similar fashion in SARS˜Ub and SARS2˜Ub structures (see (B), Figs 2A and EV2), the second, distal, ubiquitin unit binds to the α2 helix of PLpro, through a common binding mode involving the ubiquitin Ile44 patch. On helix α2, a central Phe70 in SARS PLpro residue is flanked by residues involved in polar contacts.
-
BStructure of the SARS2 PLpro˜Ub complex. The S2 site consisting of α2 helix with Phe69 residue is fully conserved in SARS2 PLpro (Fig EV1).
-
CCalculated enzymatic efficiencies for K48‐diUb-TAMRA cleavage, followed by fluorescence polarisation with PLpro wild‐type (reproduced from Appendix Fig S1A), and PLpro F69S. (Left) Using the same concentration range of SARS2 PLpro, the F69S mutant activity could not be fitted; (middle) a higher concentration recovered an activity slightly lower as compared to PLpro cleaving ubiquitin‐TAMRA (45 versus 86 M−1 s−1, compare Fig 1D, Appendix Fig S1A). (Right) A ˜ 3‐fold lower efficiency for PLpro F69S cleaving ISG15‐TAMRA yields values similar to cleavage of ISG15CTD‐TAMRA (Appendix Fig S1A), suggesting that the S2 site contributes the difference in binding for the N‐terminal Ubl‐fold. Experiments for F69S were performed in technical triplicate and biological duplicate; wild‐type data are reproduced from experiments shown in Fig 1D, Appendix Fig S1A.
-
D–FGel‐based analysis showing hydrolysis time course of triubiquitin (D), proISG15CTD (E) and proISG15 (F) using wild‐type PLpro (left, wild‐type gels reproduced from Appendix Fig S1B–D to enable direct comparison) or PLpro F69S (right). PLpro F69S has a strong effect on triubiquitin hydrolysis (D), no marked effect on hydrolysis of proISG15CTD (E) and reduces proISG15 cleavage to the same levels as proISG15CTD (compare E, F), Experiments were performed in duplicate.
Source data are available online for this figure.
Consistently, PLpro F69S no longer hydrolysed K48‐diUb‐TAMRA (Fig 3C), or rather, reduced efficiency to levels observed with Ub‐TAMRA (compare Figs 3C and 1D). In contrast, PLpro F69S reduced ISG15‐TAMRA hydrolysis ~ 3‐fold, i.e. to levels observed for PLpro wild‐type cleavage of ISG15CTD (Fig 3C, compare Fig 1D). The same conclusions can be drawn from gel‐based analysis (Fig 3D–F). SARS2 PLpro F69S greatly diminished Lys48‐triubiquitin cleavage, without affecting proISG15CTD cleavage, and with just mildly affecting proISG15 cleavage (Fig 3C–F). However, the 2‐ to 3‐fold effects of S2 site mutations on ISG15 (Fig 3C and F) are diminutive compared to the strong effects of S2 site mutations on Lys48‐poly‐ubiquitin cleavage (Fig 3C and D), and of S1 site mutations on ISG15 cleavage (Figs 2 and EV3F). Taken together, our data provide the molecular detail of how SARS2 PLpro targets ubiquitin and ISG15, which resemble conceptually the activities previously described for SARS PLpro.
Repurposing known drugs to inhibit PLpro activity
We next focussed our attention on the urgent matter of inhibiting PLpro, to confirm its druggability and to provide new drug candidates with efficacy in treating COVID‐19. Ideally, an already clinically approved drug shows a pharmacologically relevant effect on PLpro with sub‐μM inhibitory potential, cell penetrance, oral bioavailability and extensive safety profiles for the required dosage. Such a drug could be expedited for clinical trials.
A 1,536‐well low‐volume high‐throughput assay previously used to identify inhibitors of human deubiquitinases (Turnbull et al, 2017) was adapted for SARS2 PLpro (see Fig EV4A–C and Materials and Methods). As a control for complete inhibition, the racemic version of the literature compound 5c (Baez‐Santos et al, 2014) (here referred to as rac5c, see below) was used at 10 μM concentration and fully inhibited PLpro (Fig EV4D, orange). A curated library of 5,576 compounds, comprising 3,727 unique approved drugs and late‐stage clinical drug candidates (Appendix Table S1, all compounds listed in Dataset EV1), was screened in triplicate at 4.2 μM drug concentration (Figs 4A and EV4D–F, Dataset EV1).
Figure EV4. Developing a high‐throughput screen to identify SARS2 PLpro inhibitors.
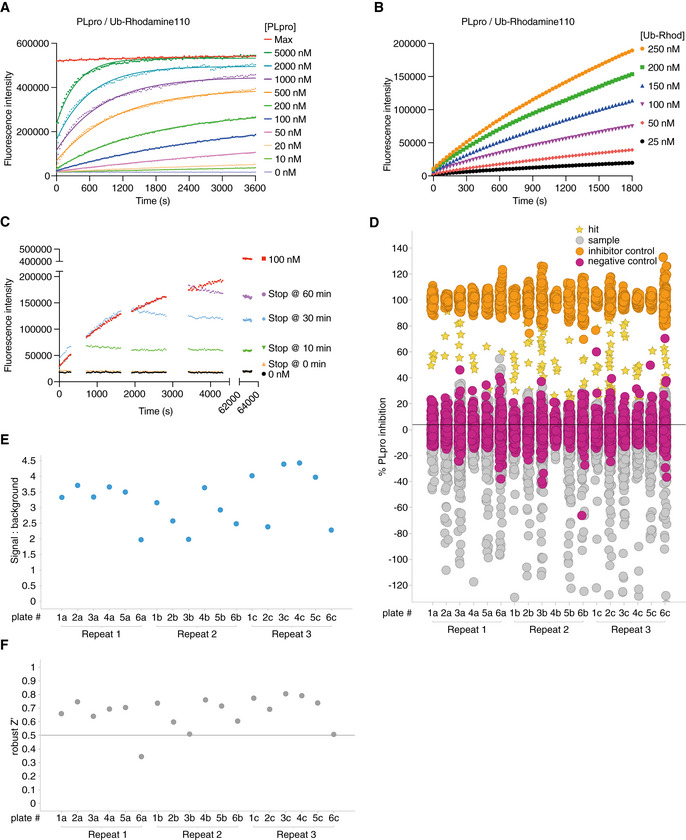
-
ASuitable SARS2 PLpro concentrations were determined by kinetic analysis of increasing Ub‐Rhodamine fluorescence over 1 h (3,600 s). Concentrations ranged from 10 to 5,000 nM with sufficient signal obtained with 50 nM SARS2 PLpro at a constant concentration of 100 nM Ub‐Rhodamine. Maximal signal (Max) indicates pre‐incubated Ub‐Rhodamine with 25 nM PLpro for 1 h, to achieve complete cleavage of Ub‐Rhodamine, before measurement.
-
BTo determine the optimal substrate concentration, 50 nM SARS2 PLpro was incubated with 25–250 nM Ub‐Rhodamine for 30 min (1,800 s). A final concentration of 100 nM Ub‐Rhodamine was selected, which was well below K M for SARS2 PLpro, in the linear range of the reaction, with a signal to background (S:B) above 3 at 12 min (720 s). 12 min was the timepoint selected for end‐point assays.
-
CEnzymatic reactions were stopped with addition of citric acid at a final concentration of 10 mM at indicated timepoints. The assay was benchmarked against compound rac5c (see below, Figs 5 and EV5). Rac5c inhibited SARS2 PLpro activity with an IC50 of 0.81 μM (Fig 5C, see Materials and Methods, Appendix Table S1).
-
DResults from the complete screen, by plate number (also see Dataset EV1).
-
ESignal:background analysis from the whole screen by plate number. 17 out of 18 plates met the quality control criteria (S:B > 2).
-
FRobust Z′ analysis of the whole screen by plate number. Plate 6a, which did not meet quality criteria in S:B and robust Z′ analysis, was excluded from analysis.
Figure 4. High‐throughput screen of SARS2 PLpro against known drugs.
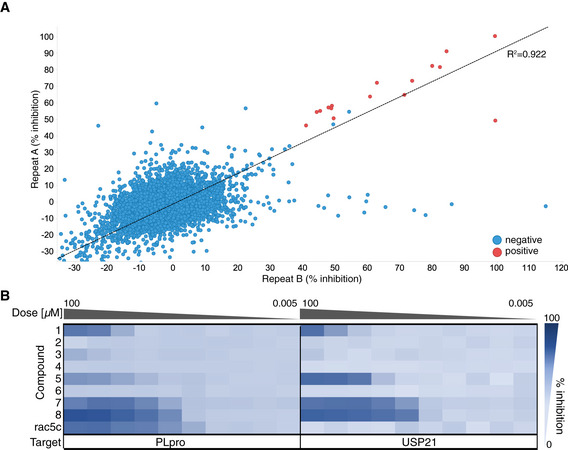
-
AHigh‐throughput screening of SARS2 PLpro was performed against 5,576 approved drugs and late‐stage clinical compounds, in 1,536‐well format using Ub‐Rhodamine (see Materials and Methods). Two replicates out of three are shown; hit compounds were those that inhibited PLpro activity by more than 40% in all three replicates. Correlation (R 2) between all screens exceeded 0.89. See Fig EV4 for assay design and quality control, and Materials and Methods.
-
BHit compounds and compound rac5c (see Fig 5) were further assessed in 10‐point IC50 titrations using the Ub‐Rhodamine assay, using a starting concentration of 100 μM serially diluted in 1:3 steps. Degree of inhibition is shown as a titration heat‐map from dark (full inhibition) to light blue (low/no inhibition). The catalytic domain of human USP21 (Ye et al, 2011) was used as a counterscreen. Each PLpro hit compound showed either no activity in the titration analysis or an identical inhibition profile against PLpro and USP21, suggesting assay interference. Rac5c was specific for SARS2 PLpro and did not inhibit USP21 even at the highest concentration of 100 μM. IC50 assays were performed in technical triplicate in two independent experiments.
A set of 15 compounds showed 40–90% PLpro inhibition in each triplicate run (Fig 4A). Seven of these were excluded as commonly observed false positives (reactive compounds or dyes that interfere with assays). The remaining eight compounds were tested in 10‐point titration experiments for IC50 measurements, as well as counterscreened against the catalytic domain of human USP21 (Ye et al, 2011). We chose this human protein to assess the potential selectivity of inhibition of PLpro over a representative human DUB and as counterscreen. PLpro and USP21 are sufficiently dissimilar to conclude that any compounds inhibiting both with similar IC50 would likely be false positives interfering with the assay. After full titration against PLpro and USP21, we found that the eight hits were either inactive in validation, or equally active towards PLpro and USP21 (Fig 4B), suggesting that none of the identified hits are genuine PLpro inhibitors. This contrasted with rac5c, which inhibited PLpro, but did not inhibit USP21 even at 100 μM concentration (Fig 4B).
Together, our data suggest that a repurposing strategy using 3,727 unique known drugs towards SARS2 PLpro is unlikely to yield drug candidates and highlights the importance of a counterscreen in assessing the validity of hits coming from a screen of known drugs before any conclusions on their therapeutic potential can be drawn. The robust screen and orthogonal assays for PLpro will be instrumental in drug discovery campaigns.
Exploiting known SARS PLpro inhibitors against SARS2 PLpro
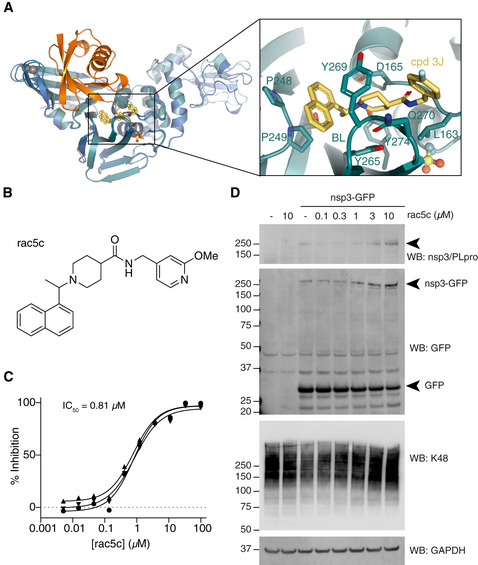
SARS PLpro has been the focus of academic drug discovery efforts in the last two decades (Ghosh et al, 2020). An initial series of non‐covalent small molecules (Ratia et al, 2008) was subsequently refined to achieve sub‐μM inhibitors of SARS PLpro with high specificity and low cytotoxicity (Baez‐Santos et al, 2014, 2015). Drug development was aided by structural analysis of several SARS PLpro‐compound complexes (Figs 5A, and EV5A and B), showing that compounds bind in the channel occupied by the ubiquitin/ISG15 C‐terminal tail, wedged between the SARS PLpro Thumb domain and a so‐called Blocking Loop (BL), containing a critical Tyr residue (Tyr269 in SARS, Tyr268 in SARS2; Baez‐Santos et al, 2014, 2015) (Figs 5A, and EV5A and B). An extended, Tyr‐lacking BL in MERS PLpro (Fig EV1), renders it unsusceptible to some SARS inhibitors (Lee et al, 2015). Importantly, the BL sequence and length, and all residues involved in inhibitor interactions, are identical between SARS and SARS2 PLpro (Figs 5A, and EV1 and EV5A and B), suggesting that SARS PLpro inhibitors may have inhibitory potential against SARS2 PLpro.
Figure 5. SARS PLpro inhibitors target SARS2 PLpro.
- A
-
BChemical structure of rac5c. See Appendix Supplementary Methods for detail on compound synthesis and characterisation.
-
CIn vitro inhibition (IC50) for rac5c inhibiting SARS2 PLpro. Experiments were performed using the HTS assay (Fig 4), in technical triplicate in three independent experiments. A geometric mean was used to determine IC50.
-
DFull‐length nsp3 was expressed from a C‐terminally GFP‐tagged vector in HEK293T cells and treated with increasing concentrations of rac5c for 24 h. GFP is released from the C‐terminus, presumably by nsp3 protease activity. Nsp3 can be detected by a SARS/SARS2 PLpro antibody (see Fig EV5E for antibody validation). Lysates were blotted for Lys48‐linked polyubiquitin with a linkage‐specific antibody (K48). Experiments were performed in duplicate with similar results. Also see Fig EV5F and G, and Source Data for uncropped blots.
Source data are available online for this figure.
Figure EV5. SARS PLpro compounds inhibit SARS2 PLpro.
-
AStructure of SARS2 PLpro bound to the ubiquitin C‐terminal tail in the active site, compare with Fig 5A.
-
BSuperposition of ubiquitin tail in SARS2 PLpro, and compound 3j in SARS PLpro (pdb 4ovz (Baez‐Santos et al, 2014)) shows an identical binding for compounds in SARS2 PLpro and highlights the change in Tyr268/269 in SARS2 PLpro and SARS PLpro, respectively.
- C, D
-
EImmunoblot characterisation of the PLpro antibody on HEK 293T cells overexpressing PLpro from MERS, SARS or SARS2. Cell lysates were immunoblotted 48 h post‐transfection. PLpro antibody is cross‐reactive with SARS and SARS2, but not MERS PLpro.
-
FImmunoblot analysis showing the effect of rac5c (10 μM for 24 h) on Lys48‐polyubiquitin chain disassembly by nsp3, 48 h post‐transfection in HEK 293T cells. In this experiment, nsp3 expression was inferred by release of free GFP. Importantly, rac5c has no effect on global Lys48 chains in untransfected HEK293T cells.
-
GExperiment as in Fig 5D, with a clearer effect of nsp3 on K48‐linked polyubiquitin.
Source data are available online for this figure.
We selected and resynthesised racemic forms of three late‐stage literature compounds, named according to previous publication (Baez‐Santos et al, 2014), rac3j, rac3k and rac5c (see Appendix Supplementary Methods). IC50 measurements performed on our automated screening platform revealed low or sub‐μM inhibitory activity for each compound against SARS2 PLpro (Figs 5B and C, and EV5C and D). This confirmed that SARS PLpro inhibitors inhibit SARS2 PLpro.
SARS2 PLpro inhibitors target nsp3 protease and DUB activity
Nsp3 is a 215 kDa multi‐domain enzyme with several catalytic activities. To test whether the best inhibitor, rac5c (IC50 value of 0.81 μM, Figs 5B and C, and EV5C and D), would be able to inhibit the PLpro domain in context of full‐length nsp3, the protein was transiently expressed from a C‐terminally GFP‐tagged vector in HEK293T cells. Full‐length nsp3 was detected with a SARS/SARS2 PLpro‐specific antibody (validated in Fig EV5E), and its activity was confirmed by proteolytic cleavage of the GFP tag (Figs 5D and EV5F). Nsp3 expression decreased Lys48‐linked polyubiquitin, which was inhibited by rac5c in a dose‐dependent manner (Figs 5D, and EV5F and G). More importantly, rac5c treatment also decreased processing of the expressed nsp3‐GFP construct, strongly indicating that PLpro inhibition would stop polyprotein processing. It had previously been shown that these inhibitors are specific for PLpro over human DUBs (Baez‐Santos et al, 2015) (also see Fig 4B), and treatment with rac5c did not affect Lys48‐linked polyubiquitin in the absence of nsp3 expression (Figs 5D and EV5F), strongly indicative of an on‐target nsp3/PLpro activity of rac5c.
Antiviral efficacy of SARS2 PLpro inhibitors
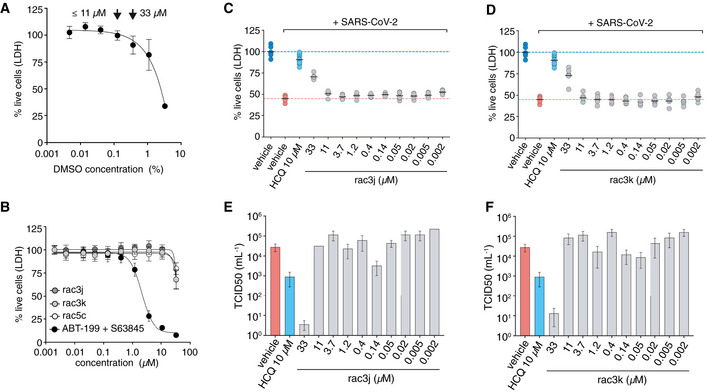
All three compounds were tested for their inhibitory potential in Vero monkey kidney epithelial cells infected with SARS‐CoV‐2. Vero cells undergo extensive cell death upon SARS‐CoV‐2 infection in contrast to many human cell lines where cytopathic effect (CPE) is less evident (Chu et al, 2020). In addition, we found Vero cells were sensitive to DMSO concentrations above 0.3% (v/v), limiting the useful range at which inhibitors could be applied due to their low solubility (Fig EV6A). Synthesised compounds rac3j, rac3k and rac5c showed no toxicity on Vero cells when used in 0.1% DMSO (enabling compound assessment on cells at concentrations up to 11 μM), but toxicity increased with higher compound and DMSO concentrations (33 μM compound, in 0.3% DMSO) (Fig EV6B).
Figure EV6. Antiviral activity of compounds in cells.
-
AVero cells were tested for compatibility with DMSO concentrations, revealing low toxicity at concentrations < 0.1% (v/v) but more substantial cytotoxicity at higher concentrations (0.3% and above). This limited the range of compound concentrations useable for infection studies; at concentrations up to 11 μM, 0.1% (v/v) DMSO was used as vehicle, at 33 μM compound concentration, 0.3% (v/v) DMSO was used. Higher concentrations of compound could not be tested due to this limitation. Data represent mean values ± SD from n = 12 technical replicates pooled from n = 2 independent experiments.
-
BToxicity titration of compounds rac3j, rac3k and rac5c on Vero cells. At 33 μM compound concentration, cellular toxicity is ˜ 25%. ABT‐199 and S63845 are death‐inducing compounds (Souers et al, 2013; Kotschy et al, 2016) used as a control. Data are shown as mean ± SD with n = 12 technical replicates pooled from n = 2 independent experiments for rac3j, rac3k and the controls (ABT‐199 and S63845) and n = 18 technical replicates pooled from n = 3 independent experiments for rac5c.
-
C, DCPE assays to assess cell killing activity of SARS‐CoV-2 in Vero cells left untreated (DMSO control) or treated with compounds rac3j (C) and rac3k (D). One experiment with 6 biological replicates is shown (black line, mean), and compared to HCQ‐treated cells (10 μM) with pooled data from 2 experiments with n = 6, as in Fig 6B. The 33 μM compound concentration was performed at 0.3% (v/v) DMSO and significantly rescued infected cells despite underlying cytotoxicity in Vero cells (see A, B).
-
E, FTCID50 analysis of infectious virus for rac3j, rac3k, from the experiments performed in (C) and (D), respectively. Data are representative of 1 experiment out of 2, with n = 6 per experiment, bars represent the mean TCID50 value with error bars showing SD. HCQ control was performed within the same experiment.
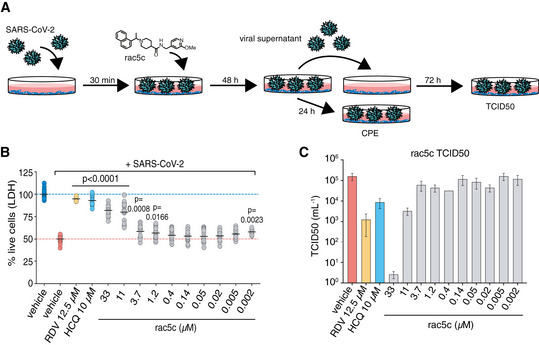
Next, compounds were tested in Vero cells infected with SARS‐CoV‐2 at a multiplicity‐of‐infection (MOI) of 0.1 (Fig 6A), resulting in death of ~ 50% of the cell population. Remdesivir (RDV) (preprint: Pruijssers et al, 2020; Wang et al, 2020), the only available drug approved for treatment of COVID‐19, was used at 12.5 μM concentration (Choy et al, 2020), leading to a ~ 90% reversal of the SARS‐CoV‐2 induced CPE. Hydroxychloroquine (HCQ), at 10 μM (Yao et al, 2020), rescued CPE also by ~ 90% (Figs 6B, and EV6C and D).
Figure 6. Antiviral effects of SARS2 PLpro inhibitors in an infection model.
-
AVero cells were infected with SARS‐CoV-2 and analysed as shown in the cartoon (see Materials and Methods).
-
BReduction in SARS‐CoV-2 induced cytopathic effect with rac5c, Remdesivir (RDV) and hydroxychloroquine (HCQ) treatment. DMSO 0.3% (v/v) was required to keep 33 μM rac5c in solution (see Fig EV6A and B). Mean (black line) is provided for 18 samples in each group, representing 3 independent experiments with 6 biological replicates per experiment across the different concentrations of rac5c. HCQ data are pooled from 2 independent experiments and RDV from 1 experiment using 6 biological repeats. P values were calculated using a one‐way ANOVA, with regular Dunnet's post hoc test for multiple comparisons between treatment arms and infected/vehicle‐treated control using a single pooled variance.
-
CTCID50 data, mean and SD, for one representative experiment from (B) with 6 technical replicates.
High (33 μM) concentrations of rac5c, rac3j or rac3k reduced SARS‐CoV‐2‐induced CPE, and remaining cell death (of around 20%) was likely contributed to the background toxicity associated with high DMSO concentrations described above (Figs 6B, and EV6C and D). Importantly, for rac5c, treatment at 11 μM in non‐cytotoxic DMSO concentrations (0.1% DMSO) continued to show a marked reduction on CPE, indicating clear antiviral activity (Fig 6B). For rac3j and rac3k, CPE reduction diminished at lower concentrations (Fig EV6C and D).
Antiviral activity is best assessed by a compound's effect on TCID50 (mean tissue culture infection dose) in which cell supernatant from infected cells is assessed for infectious viral titre in secondary infections. RDV (12.5 μM) and HCQ (10 μM) reduced viral titre by 100‐ and 10‐fold, respectively. SARS2 PLpro inhibitors, at high concentrations of 33 μM, showed a 3–4 log decrease in infectious viral titre at 33 μM (Figs 6C, and EV6E and F), although this effect can be at least partially attributed to vehicle mediated toxicity to cells. Rac5c at 11 μM, a concentration that protected cells from CPE without causing cell toxicity, decreased viral titre to a similar extend as RDV and HCQ treatment. Together, our data highlight that inhibition of SARS2 PLpro with small molecules can have striking antiviral effects.
Discussion
The biochemical activities and structural properties of the PLpro domain of the essential SARS‐CoV‐2 protein nsp3 hold tremendous promise as a target to generate a new class of antivirals for coronaviruses. The three distinct substrates of PLpro, namely the viral polyprotein, degradative Lys48‐polyubiquitin and antiviral ISG15 signals, make PLpro an excellent candidate for pharmacological intervention.
Together, our biochemical, structural and mutational analyses confirm that firstly, ISG15 preference is provided by the SARS2 PLpro S1 Ub/Ubl‐binding site, which preferentially binds ISG15CTD through a differential binding mode as compared to ubiquitin. Secondly, PLpro utilises an S2 binding site to provide exquisite specificity for Lys48‐linked polyubiquitin. Monoubiquitin is a poor substrate compared to ISG15, but once extended via Lys48‐linkages becomes a decent substrate. In combination, these PLpro features make it an ISG15‐preferential enzyme (by ~ 18‐fold), that can also cleave Lys48‐linked polyubiquitin, but is unlikely to remove monoubiquitin modifications. These findings are consistent with and mechanistically explain recently reported biochemical analyses and structures by the Pegan laboratory (Freitas et al, 2020), the Dikic laboratory (Shin et al, 2020), and the Olsen laboratory (preprint: Rut et al, 2020).
Considering the relative abundance of ubiquitin and ISG15 modifications in cells, the difference in activity may ensure that the much lower abundant ISG15 signals are cleaved against the backdrop of highly abundant Lys48‐ubiquitin chains. Indeed, other viral proteases such as Lbpro of FMDV (Foot‐and‐Mouth Disease virus) display an even more pronounced ISG15 preference (Swatek et al, 2018). Even within coronaviruses, ISG15 and ubiquitin activities and binding modes differ between SARS and MERS [see Discussion in Fig EV2, and also (Freitas et al, 2020)].
Lys48 polyubiquitination most commonly targets proteins for proteasomal degradation and plays important roles in inflammatory pathways. Several studies implicate SARS PLpro in these pathways; however, most express PLpro or nsp3 in isolation. An additional function of PLpro may be to stabilise the viral replicase complex that nsp3 is part of, and it seems plausible that PLpro may serve to keep its replicase Lys48‐polyubiquitin free.
Despite the roles of ISG15 as an antiviral signal, its contribution to inflammatory signalling, or the role of PLpro in cleaving it, is even less well understood. The location of PLpro within nsp3 (and the replicon) would be expected to restrict its action radius compared to isolated PLpro or nsp3, further complicating the interpretation of ectopic expression studies. Reconstitution of the replicase, in combination with the here‐identified separation‐of‐function mutations, could prove useful in future studies dissecting the contributions of PLpro's activity towards ISG15 versus Lys48‐polyubiquitin during viral infection.
Regardless of the low activity of PLpro towards ubiquitin, we show that a robust high‐throughput screen for SARS2 PLpro can be developed using ubiquitin‐rhodamine. This together with our structural insights paves the way towards structure‐guided drug discovery. Indeed, while here‐tested clinically approved drugs may not be suitable to target PLpro (Fig 4), pharmacologically unrefined lead compounds are already available to specifically target SARS2 PLpro (Fig 5). We show that the most recent SARS PLpro literature compounds, in particular rac5c, have antiviral efficacy and seem as potent as drugs that target viral replication (e.g. the viral polymerase inhibitor Remdesivir), in the cell‐based systems tested. Future studies will have to assess drug metabolism and pharmacokinetics, and compound efficacy in vivo.
A potentially important result was the observed rac5c‐mediated inhibition of nsp3‐GFP cleavage in cells. In this setting, the generation of the tagged, full‐length nsp3 protein presents the PLpro domain with a single site for proteolysis, and PLpro would need to cut only once to release the tag (or, three times in a viral setting, to produce nsp1, nsp2 and nsp3 proteins—these are essential events to build the viral replicase). Self‐cleavage is fundamentally different to hydrolysing ubiquitin or ISG15 modifications which are, in comparison, abundant and continuously replenished by the host cell. It was encouraging that rac5c prevented self‐processing of nsp3‐GFP as it suggests that a PLpro inhibitor can target viral replication directly and efficiently. Moreover, these direct antiviral effects of PLpro inhibitors are likely further supplemented by suppressing PLpro's role in subverting the innate immune system through its interference with host cell ISG15 and ubiquitin signalling. PLpro inhibitors may hence also prove useful in restarting (and/or rebalancing) host innate immune processes that are pathologically deregulated in COVID‐19.
Materials and Methods
Molecular biology
Generation of bacterial expression vectors
The sequence of SARS‐CoV‐2 PLpro (amino acids (aa) 1,563–1,878, with aa E1564 designated as residue 1, according to previously published numbering) was based on the polyprotein orf1ab (GenBank: QHD43415) and was purchased as a codon‐optimised gene‐block (IDT) for bacterial expression. PLpro was cloned by ligation‐independent cloning into the pOPIN‐B vector (Berrow et al, 2007) using the In‐Fusion HD cloning Kit (Takara Clontech). All PLpro mutants were introduced by site‐directed mutagenesis using the Q5 Site‐Directed Mutagenesis Kit (NEB). For Ub‐PA and ISG15CTD‐PA preparation, Ub (1–75) and ISG15CTD (79–156) genes were expressed from pTXB1 vectors as described (Gersch et al, 2017; Swatek et al, 2018). ProISG15 (2–165) and proISG15CTD (79–165) were expressed from pOPIN‐B vectors as described in (Swatek et al, 2018).
Generation of mammalian expression vectors
For mammalian expression, SARS2 PLpro variants, SARS PLpro (aa 1,541–1,855 of polyprotein 1ab) and MERS PLpro (aa 1,482–1,803 of polyprotein 1ab), were generated as codon‐optimised gene‐block (IDT) for bacterial expression and were transferred into pOPINF using In‐Fusion HD cloning (Takara Clontech). Full‐length nsp3 (kindly provided by Fritz Roth, University of Toronto) was cloned from a pENTRY vector into the pDEST47 vector using gateway cloning with the LR clonase mix (Invitrogen), according to manufacturer's instructions.
Protein biochemistry and structural biology
PLpro purification
PLpro wild‐type and mutant expression vectors were transformed into Escherichia coli Rosetta 2(DE3) pLacI competent cells (Novagen), and bacterial cells were grown in 2xYT medium at 37°C. At OD600 = 0.8, the temperature was reduced to 18°C and expression was induced with 0.3 mM IPTG. Cells were harvested 16 h post‐induction and stored at −20°C.
For purification, cells were resuspended in lysis buffer (50 mM Tris pH 7.5, 300 mM NaCl) supplemented with lysozyme, DNaseI and cOmplete EDTA‐free protease inhibitor cocktail tablets (Roche) and lysed by sonication. Lysates were cleared by centrifugation at 40,000 g for 30 min at 4°C, and His‐tagged proteins were purified either by using a HisTrap FF column (5 ml, Cytvia) with gradient elution over 5 column volume (CV) from buffer A (20 mM Tris pH 7.5, 300 mM NaCl and 10 mM imidazole) to buffer B (20 mM Tris pH 7.5, 300 mM NaCl and 400 mM imidazole), or with Ni‐NTA HisBind resin (EMD Millipore) eluting with buffer B (2 × 10 ml). Pooled fractions were supplemented with His‐3C protease for His‐tag cleavage and dialysed overnight at 4°C (for wt: 50 mM Tris pH 7.5, 300 mM NaCl, 5 mM β‐mercaptoethanol (bME), for mutants: 20 mM HEPES pH 7.5, 300 mM NaCl and 10 mM bME). His‐3C protease and His tags were removed by Ni‐NTA HisBind resin (EMD Millipore), and proteins were further purified by size exclusion chromatography using a HiLoad 16/600 Superdex 75 pg column (GE Healthcare) equilibrated with storage buffer (20 mM HEPES pH 7.5, 150 mM NaCl, 1 mM TCEP). Protein samples were concentrated, flash‐frozen in liquid nitrogen and stored at −80°C.
Thermal shift assay
Thermal shift assays were performed for quality control after PLpro wt and mutant purification, using the Tycho NT.6 (NanoTemper Technologies). PLpro wt and mutants were measured at 1 μM in storage buffer. The inflection temperatures of each protein were calculated by the Tycho NT.6 software (1.2.0.750). Technical duplicates were measured in two independent experiments. Data were analysed using GraphPad Prism.
His6‐proISG15 and His6‐proISG15CTD purification
proISG15 and proISG15CTD were expressed as described above but induced with 0.2 mM IPTG and resuspended in buffer C (50 mM Tris pH 7.5, 150 mM NaCl, 2 mM bME) prior storage at −20°C. Affinity purification was performed as for PLpro but with the following modifications. HisTrap FF resin was washed with buffer C supplemented with 15 mM imidazole and eluted with a linear gradient of 10 CV from buffer C to buffer D (buffer C supplemented with 300 mM imidazole). Eluted proteins were diluted 10‐fold to a low salt buffer (50 mM Tris pH 8.0, 30 mM NaCl, 2 mM bME) and passed over a ResourceQ column (Cytvia). The eluted proteins were concentrated and further purified by size exclusion chromatography (HiLoad 16/600 Superdex 75 pg, Cytvia) into Buffer C. Protein containing fractions were concentrated, flash‐frozen and stored at −80°C until further use.
Generation of ubiquitin and ISG15CTD suicide probes
Ub‐intein and ISG15CTD‐intein proteins were expressed as for PLpro. Cell pellets were resuspended in Buffer E (20 mM HEPES, 50 mM NaOAc pH 6.5, 75 mM NaCl) and Buffer F (50 mM HEPES, 100 mM NaOAc pH 6.5), respectively.
Ub‐MesNa (2‐mercaptoethanesulfonate as a sodium salt) and subsequently Ub‐PA were prepared as described previously (Wilkinson et al, 2005; Ekkebus et al, 2013; Gersch et al, 2017). Human ISG15CTD (79–156)‐MesNa (ISG15CTD‐MesNa) and the ISG15CTD‐PA suicide probe were prepared as described previously(Geurink et al, 2019).
The completed reactions underwent final size exclusion chromatography (HiLoad 16/600 Superdex 75 pg, Cytvia) into Buffer E (Ub‐PA) or Buffer F (matISG15CTD‐PA). The resultant fractions were concentrated, flash‐frozen and stored at −80°C until further use.
Preparation of the PLpro~Ub and PLpro‐ISG15CTD complex for crystallisation
Purified PLpro was incubated with 3× molar excess of either Ub‐PA or ISG15CTD‐PA at RT for 2 h. Unreacted probe was separated from the complex by size exclusion chromatography (Superdex 75 Increase 10/300 GL) into 20 mM Tris pH 7.5, 150 mM NaCl, 1 mM TCEP (PLpro~Ub) or 20 mM HEPES pH 7.5, 150 mM NaCl, 1 mM TCEP (PLpro~ISG15CTD), and the eluted complexes were concentrated to 4 mg ml−1 for PLpro~Ub and 5 mg ml−1 or 8 mg ml−1 for PLpro~ISGCTD for crystallisation.
Crystallisation
Crystallisation screening was performed at the CSIRO's Collaborative Crystallisation Centre (C3) in Melbourne, Australia. For PLpro~Ub at 4 mg ml−1, one crystal grew in 30% (w/v) PEG 4000, 0.2 M sodium acetate, 0.1 M Tris chloride pH 8.5, in a 96‐well, sitting drop vapour diffusion plate (150 nl protein to 150 nl reservoir solution) at 20°C. The crystal was cryoprotected with 20% (w/v) PEG 4000, 0.2 M sodium acetate, 0.1 M Tris chloride pH 8.5 and 25% (v/v) glycerol before vitrification in liquid nitrogen. For PLpro~ISG15CTD, initial crystals grew at concentrations of both 5 and 8 mg ml−1 complex, in several conditions containing 0.2 M lithium or ammonium sulphate, 25% (w/v) PEG 3350 and bis‐tris chloride pH 5.5–6.5, at 20°C. The structure was solved from a crystal reproduced in a hanging drop 24‐well plate using 5 mg ml−1 protein complex grown in 0.2 M lithium sulphate, 25% (w/v) PEG 3350 and 0.1 M bis‐tris chloride pH 6.5 and a protein to reservoir ratio of 1–0.5 μl. The crystal was stepwise cryoprotected by using the mother liquor supplemented with 15% (v/v) glycerol as a first and 28% (v/v) glycerol as a second step, before vitrification in liquid nitrogen.
Data collection, phasing and refinement
Diffraction data were collected at the Australian Synchrotron (Australian Nuclear Science and Technology Organisation, ANSTO) beamline MX2 (Aragão et al, 2018) (wavelength: 0.953725 Å, temperature: 100K). Collected datasets were processed and scaled with XDS (Kabsch, 2010) and Aimless (Evans & Murshudov, 2013) (within CCP4suite (Winn et al, 2011)). The structures of SARS2 PLpro~Ub and SARS2 PLpro~ISG15CTD were solved by molecular replacement to a resolution of 2.7 and 2.9 Å, respectively, using Phaser (McCoy et al, 2007) and the apo structure of SARS2 PLpro (pdb: 6wrh, unpublished) and either ubiquitin (from pdb 5ohk (Gersch et al, 2017)) or ISG15CTD (from pdb 6ffa (Swatek et al, 2018)) as search models.
Refinement and model building was performed in PHENIX (Adams et al, 2011) and Coot (Emsley et al, 2010). Both structures were initially refined by cartesian‐stimulated annealing following rigid body refinement. For both complexes, secondary structure restrains were set and the apo structure of SARS2 PLpro (pdb 6wrh, unpublished) was used as reference model. TLS parameters were set to one TLS group per chain. For SARS2 PLpro~ISGCTD, additional NCS refinement was utilised in each refinement cycle. For the covalent linkage of the propargylamide to the catalytic Cys111 of SARS2 PLpro in each structure, geometric restrains for propargylamide (AYE) derived from PHENIX elbow and a parameter file defining the linkages was used. Models were validated using MolProbity (Williams et al, 2018) and Coot indicating for PLpro~Ub following Ramachandran plot statistics: 0.0% outliers, 2.63% allowed and 97.37% favoured and for PLpro~ISGCTD: 0.0% outliers, 2.60% allowed, 97.40% favoured. Structural figures were generated using PyMol. Further data collection and refinement statistics can be found in Table 1.
PLpro activity assays
Gel‐based PLpro DUB activity and chain specificity assays
Gel‐based cleavage assays were performed as previously described (Mevissen et al, 2013) with the following modifications. Reactions were initiated at room temperature (23°C) in a final volume of 150 μl (for the specificity assay) or 350 μl (for longer time course assays) and 20 mM Tris pH 7.5, 100 mM NaCl, 10 mM DTT was used as the reaction buffer. Triubiquitin substrates were enzymatically assembled as previously described (Michel et al, 2018). Final enzyme and substrate concentrations were 0.25 and 2 μM, respectively. Reactions were stopped at indicated time points by mixing 20 μl of reaction with 20 μl 2× NuPAGE LDS sample buffer (Invitrogen) and analysed by SDS–PAGE (Invitrogen NuPAGE™ 4–12% Bis‐Tris) and Coomassie staining (Instant Blue, Expedeon).
For gel‐based quantitative analysis, Coomassie‐stained gel images were converted to greyscale and band intensities were quantified using ImageLab™ (Bio‐Rad). Background intensities were automatically subtracted using a base line relative to the lowest contrasting band for each gel. Values were then normalised to the PLpro band in each lane. Remaining substrate concentrations were calculated with respect to the substrate concentration at time point zero (100%). The resulting values were plotted over time, and the initial values within the linear range were used to calculate the relative activity measures.
Generation of K48‐diUb‐TAMRA
K48‐diUb‐TAMRA fluorescence polarisation (FP) reagent, featuring a non‐hydrolysable triazole linkage between the two Ub‐domains, was generated by first constructing non‐hydrolysable K48‐diUb according to the protocols reported by Flierman et al (2016) and Zhang et al (2017). The C‐terminus of the proximal diUb was then activated and ligated to TAMRA‐KG peptide following the protocol reported by (Geurink et al, 2012) to yield the native isopeptide bond between the ε‐amine of the lysine of the peptide and the glycine carboxylate of the non‐hydrolysable diUb.
Fluorescence polarisation‐based PLpro activity assays
FP assays were performed with Ub‐KG‐TAMRA (UbiQ bio), K48‐diUb‐TAMRA (see above), mouse ISG15‐KG‐TAMRA (UbiQ bio) and ISG15CTD‐TAMRA (Swatek et al, 2018) to determine the catalytic efficiencies for PLpro wt and mutants. For the assay small volume, non‐binding, black bottom, 384‐well plates were used, and reactions were measured on a CLARIOstar plus plate reader (BMG Labtech) using optical settings for the TAMRA fluorophore (excitation: 540 nm, emission: 590 nm). Before each measurement, the instrument settings were referenced to 50 mP KG‐TAMRA control at a concentration of 50 nM.
All substrates were used at a final concentration of 150 nM, while the dilution series of the enzyme concentrations varied according to the substrate (10–0.156 μM of PLpro for Ub‐TAMRA; 1,000–15.63 nM for K48‐diUb‐TAMRA; 100–1.56 nM for ISG15‐ and ISG15CTD‐cleavage; 250–3.90 nM for ISG15CTD‐cleavage to determine the catalytic efficiency). Enzyme (SARS2 PLpro wild‐type and mutants) and substrates were diluted in assay buffer (20 mM HEPES pH 7.5, 150 mM NaCl, 1 mM TCEP, 50 μg ml−1 BSA) to 2× concentrations, and reactions were started upon addition of 2× enzyme to 2× substrate in a final volume of 15 μl. Kinetics were measured in technical triplicates over 60 min with one read per minute in at least two independent experiments with the exact number indicated in the figure legends. For the determination of the catalytic efficiency of SARS2 PLpro wild‐type on ISG15CTD, two of the four independent measurements were performed in technical duplicates, due to substrate limitations.
Data were analysed using the CLARIOstar software MARS, Microsoft Excel and GraphPad Prism (version 8.3.1). Measured fluorescence polarisation values were blank corrected (with a buffer only control) and converted into anisotropy (mA) using the CLARIOstar MARS software. Technical replicates were averaged and fitted by non‐linear curve fitting using one‐phase decay in GraphPad Prism. The determined rate constants (k obs) were then plotted over the enzyme concentrations and fitted using linear regression, to determine the catalytic efficiency k cat/K M as the slope.
High‐throughput screening
Ub‐Rhodamine PLpro activity assays for HTS
For HTS screening, PLpro activity was monitored in a homogenous fluorescence intensity assay using the substrate Ub‐Rhodamine110Gly (UbiQ bio, here referred to as Ub‐Rhodamine). Experiments were performed in either 384‐well or 1,536‐well black non‐binding plates (Greiner 784,900 and 782,900, respectively) with a final reaction volume of 6 μl. The assay buffer contained 20 mM Tris (pH 8), 1 mM TCEP, 0.03% (w/v) BSA and 0.01% (v/v) Triton‐X.
PLpro at a final concentration of 50 nM was added to the plates (preparation of screening plates described below) and incubated at room temperature for 10 min. Ub‐Rhodamine (final concentration 100 nM) was added to start the reaction and incubated for 12 min at room temperature. For end‐point assays, the reaction was stopped by the addition of aqueous citric acid (1 μl) at a final concentration of 10 mM. All reagents were dispensed using the CERTUS FLEX (v2.0.1, Gyger), and Microplates were centrifuged using a Microplate Centrifuge (Agilent). The reaction was monitored by an increase in fluorescence (excitation 485 nm and emission 520 nm) on a PHERAstar® (v5.41, BMG Labtech) using the FI 485 520 optic module.
The HTS screen was performed with one measurement for each compound in three independent experiments.
In the counterscreen, the deubiquitinating enzyme USP21 (final concentration 5 nM) was used within the same setting, but using an incubation time of 2 min after addition of UbRhodamine110 before the reaction was stopped. Counter and confirmation screen were performed with 3–6 technical replicates in two independent experiments.
Screen preparation and data analysis
We assessed the activity of 5,577 compounds contained in commercially available libraries of known drugs (Sigma‐Aldrich LOPAC, Tocris and Prestwick) as well as in‐house curated collections of FDA‐approved drugs and advanced pre‐clinical compounds (for a complete compound list, see Dataset EV1). Analysis of these libraries identified 3,727 unique compounds. Compounds were obtained from Compounds Australia, where they are stored under robust environmental conditions.
Assay‐ready plates were prepared by dry‐spotting compounds in DMSO using an Echo® Acoustic Dispenser (LabCyte). Compounds were tested at 4.2 μM in final 2% (v/v) DMSO. The screen was run using instruments integrated with Momentum Laboratory Automation software (v5.3.1, Thermo Fisher Scientific).
Data were normalised to 2% (v/v) DMSO (negative control, 0% inhibition) and 100 μM rac5c (positive control, 100% inhibition). Screen assay quality was monitored by calculation of robust Z′ by the following formula where (+) denotes the positive controls (low signal), (−) denotes the negative controls (high signal) and MAD is the median absolute deviation:
where MAD = 1.4826 × median(abs(x − median(x))).
Plates were excluded from analysis if robust Z′ < 0.5. Hits were selected as > 4 × MAD over the median of the negative control.
To determine the potency of the inhibitors, a series of 10‐point, 1:3 serial dilutions was performed from a highest starting concentration of 100 μM. The 10‐point titration curves were fitted with a 4‐parameter logistic non‐linear regression model, and the IC50 reported is the inflection point of the curve. Data were analysed in TIBCO Spotfire® 7.11.2.
Cell‐based studies and infection assays
Cell lines used
HEK293T and Vero (CCL‐81) cells displayed expected cell morphologies and were sent for validation to Garvan Molecular Genetics facility (on 15 June 2020).
Cell lines were screened on a monthly basis for mycoplasma contamination using the PlasmoTest kit (InvivoGen) as per manufacturer's instructions. All used cells were mycoplasma‐free.
Cell culture
For infection studies, Vero (CCL‐81) cells were cultured in Dulbecco's Modified Eagle Medium (DMEM + 1 g l−1 D‐glucose, l‐glutamine and 110 mg l−1 sodium pyruvate; Gibco) supplemented with 10% (v/v) heat‐inactivated foetal bovine serum (FBS; Sigma‐Aldrich), 100 U ml−1 penicillin and 100 mg ml−1 streptomycin at 37°C and 5% CO2. Vero cells were seeded in a volume of 100 μl DMEM into tissue culture‐treated flat‐bottom 96‐well plates (Falcon) at a density of 1 × 10⁴ cells/well and incubated over night before infection and/or treatment at confluency.
HEK293T cells were cultured DMEM with 10% (v/v) FBS (Gibco), penicillin (100 U ml−1) and streptomycin (100 μg ml−1) at 37°C with 10% CO2. Cells were seeded in 6‐well or 24‐well plates and transfected with pOPINF vectors encoding MERS PLpro, SARS PLpro, SARS‐CoV‐2 PLpro or a pDEST47 vector encoding nsp3‐GFP when cells were at 70–80% confluency with Lipofectamine 3000 (Invitrogen) as per manufacturer's instructions. 48 h post‐transfection, cells were harvested for immunoblotting.
Cytotoxicity and antiviral efficacy by LDH release cell death assay
Viability of uninfected and vehicle (DMSO) or Bcl2‐inhibitor ABT‐199 and Mcl‐1 inhibitor S63845 treated, or uninfected and SARS‐CoV‐2‐infected and/or PLpro inhibitor‐treated Vero cells was determined using the CytoTox 96® Non‐Radioactive Cytotoxicity Assay (Promega) 72 h post‐infection/treatment. The percentage of living cells was calculated comparing LDH release of surviving cells in infected and/or treated cells to LDH release of non‐infected or non‐treated control cells. Prism 8 software (GraphPad) was used to perform statistical tests in Figs 6 and EV6. Groups were compared as stated in figure legends.
SARS‐CoV‐2 infection and inhibitor treatment
SARS‐CoV‐2 was obtained from The Peter Doherty Institute for Infection and Immunity (Melbourne, Australia), where the virus was isolated from a traveller from Wuhan arriving in Melbourne and admitted to hospital in early 2020. Viral material was used to inoculate Vero/hSLAM cells for culture, characterisation and rapid sharing of the isolate (Caly et al, 2020). Vero cells were seeded and rested overnight to confluency in flat‐bottom 96‐well plates and washed twice with serum‐free DMEM and infected with SARS‐CoV‐2 and MOI of 0.1 in 25 μl of serum‐free medium. Cells were cultured at 37°C and 5% CO2 for 30 min. Cells were topped up with 150 μl of serum‐free medium containing PLpro inhibitor compounds at various concentrations in six replicates per concentration. Cells were monitored daily by light microscopy for morphological changes resulting from virus cytopathic effect. Viability of cells was assessed at day 3 post‐infection/treatment by LDH release cell death assay as described above.
Median tissue culture infectious dose (TCID50) assay
Vero cell culture supernatant of SARS‐CoV‐2 infection/treatment assays was harvested 2 days after infection/treatment and diluted in 5 × 1:7 serial dilutions in a round‐bottom 96‐well plate (Falcon) and six replicates per dilution. Vero cells were seeded and rested overnight to confluency in flat‐bottom 96‐well plates and washed twice with serum‐free DMEM. 25 μl of serially diluted virus was added onto washed cells and cultured at 37°C and 5% CO2 for 30 min before cells were topped up with 150 μl of serum‐free medium. Cells were monitored at day 2 post‐infection/treatment by light microscopy for morphological changes resulting from virus cytopathic effect. Virus concentration where 50% of cells show CPE in comparison to untreated cells was defined as TCID50 factor.
The TCID50 calculation is performed using the Spearman and Kärber method, which provides the mean and standard deviation after scoring 300 wells per drug (CPE or not) across the range of dilutions.
Immunoblotting
Lysates were generated by lysis in 50 mM Tris‐Cl, 150 mM NaCl, 1% (v/v) NP‐40 with complete protease inhibitors (Roche) and quantified by BCA assay as described. SDS–PAGE was performed with between 20 and 70 μg of protein lysate run per well. Following SDS–PAGE, gels were transferred to 0.2 μm PVDF membranes using the Trans‐Blot Turbo system (Bio‐Rad). Membranes were blocked in 5% (w/v) milk powder in Tris‐buffered saline with 0.05% (v/v) Tween‐20 (Sigma, TBS‐T) for 1 h and then incubated overnight in primary antibody diluted in 5% (v/v) BSA in TBS‐T (PLpro antibody, chicken polyclonal, 1:250 (Lifesensors, #AB‐0602‐0250); anti‐Ubiquitin antibody Lys48‐specific (Apu2), rabbit monoclonal, 1:1,000 (Sigma‐Aldrich, #05‐1307); GAPDH mouse monoclonal antibody (6C5), 1:3,000 (Invitrogen, #AM4300); anti‐GFP antibody chicken polyclonal, 1:1,000 (Abcam, #ab13970)). Following 3 TBS‐T washes, membranes were incubated with conjugated secondary antibodies in TBS‐T for 1 h at room temperature (IRDye 800CW goat anti‐mouse IgG secondary, 1:10,000 (Li‐Cor, #925‐32210); goat anti‐chicken IgY‐HRP, 1:10,000 (SantaCruz, #sc‐2428); rabbit IgG HRP, 1:10,000 (GE Healthcare, #NA934VS)). Following an additional three washes in TBS‐T, membranes were developed with fluorescence detection or with Clarity Western ECL chemiluminescence substrate (Bio‐Rad) as per manufacturer's instructions using the Chemidoc (Bio‐Rad).
Author contributions
DK, GL, MP and PEC conceived the project and obtained funding. TK produced pure PLpro, performed FP assays, crystallised PLpro bound to ubiquitin and determined structures. DJC and LWR performed protein production, gel‐based activity assays and probe generation. YS and ZYG generated and purified mutant PLpro. GJvdHvN, PPG and HO contributed K48‐diUb‐TAMRA and ISG15CTD‐TAMRA reagents. DJC crystallised the PLpro~ISG15CTD complex with help from LWR. JN set up protein crystallisation and guided crystal optimisation. TK, BCL and DK collected synchrotron data with support from AR‐T and PEC, and TK and BCL refined structures. NWK, JPM, CG and GL designed and performed compound synthesis. BGCL and KNL designed and established high‐throughput assays, and BGCL, AEA, TRB, JPM and KNL performed high‐throughput screens and analysed data. JPB, GD and RF designed and performed nsp3 and PLpro expression studies in cells. GE, CCA, JPC, MD and MP designed and established SARS‐CoV‐2 infection models and analysed data. DK wrote the manuscript with help from all authors.
Conflict of interest
The authors declare that they have no conflict of interest.
Supporting information
Appendix
Expanded View Figures PDF
Dataset EV1
Source Data for Expanded View
Review Process File
Source Data for Figure 1
Source Data for Figure 2
Source Data for Figure 3
Source Data for Figure 5
Acknowledgements
We would like to thank Kanta Subbarao (Peter Doherty Institute, Melbourne) for live SARS‐CoV‐2 virus, Frederick P. (Fritz) Roth (University of Toronto) for providing the SARS2 nsp3 pENTRY plasmid, Thibault Major (University of British Columbia, Vancouver) for vectors and for supporting J. Bernardini, Sandra Nicholson, Peter Colman, Ian Wicks and Thomas Cotton (WEHI) for sharing expertise and reagents, and Jonathan O'Connell (FORMA Therapeutics) for advice on high‐throughput assays. This work was funded by The Walter and Eliza Hall Institute of Medical Research, an NHMRC/MRFF “VirDUB” grant MRF2002119 (to DK, GL, MP, PEC), NWO (VIDI‐grant and Off‐road grant) to GJvdHvN, NHMRC Investigator Grants and Fellowships (GNT1178122 to DK, GNT0637350 to MP, and GNT1117089 to GL), NHMRC Independent Research Institutes Infrastructure Support Scheme grant (361646) and Victorian State Government Operational Infrastructure Support grant, and a generous donation by Hengyi Pacific Pty Ltd to support COVID‐19 research.
The EMBO Journal (2020) 39: e106275
Contributor Information
Marc Pellegrini, Email: pellegrini@wehi.edu.au.
Guillaume Lessene, Email: glessene@wehi.edu.au.
David Komander, Email: dk@wehi.edu.au.
Data availability
All reagents and materials are available upon reasonable request from the corresponding author (dk@wehi.edu.au). Coordinates and structure factors have been deposited with the protein data bank (https://www.rcsb.org/) under accession codes 6xaa (https://www.rcsb.org/structure/6XAA), 6xa9 (https://www.rcsb.org/structure/6XA9).
References
- Adams PD, Afonine PV, Bunkóczi G, Chen VB, Echols N, Headd JJ, Hung L‐W, Jain S, Kapral GJ, Grosse Kunstleve RW et al (2011) The Phenix software for automated determination of macromolecular structures. Methods 55: 94–106 [DOI] [PMC free article] [PubMed] [Google Scholar]
- Akutsu M, Ye Y, Virdee S, Chin JW, Komander D (2011) Molecular basis for ubiquitin and ISG15 cross‐reactivity in viral ovarian tumor domains. Proc Natl Acad Sci USA 108: 2228–2233 [DOI] [PMC free article] [PubMed] [Google Scholar]
- Aragão D, Aishima J, Cherukuvada H, Clarken R, Clift M, Cowieson NP, Ericsson DJ, Gee CL, Macedo S, Mudie N et al (2018) MX2: a high‐flux undulator microfocus beamline serving both the chemical and macromolecular crystallography communities at the Australian Synchrotron. J Synchrotron Radiat 25: 885–891 [DOI] [PMC free article] [PubMed] [Google Scholar]
- Baez‐Santos YM, Barraza SJ, Wilson MW, Agius MP, Mielech AM, Davis NM, Baker SC, Larsen SD, Mesecar AD (2014) X‐ray structural and biological evaluation of a series of potent and highly selective inhibitors of human coronavirus papain‐like proteases. J Med Chem 57: 2393–2412 [DOI] [PMC free article] [PubMed] [Google Scholar]
- Baez‐Santos YM, St John SE, Mesecar AD (2015) The SARS‐coronavirus papain‐like protease: structure, function and inhibition by designed antiviral compounds. Antiviral Res 115: 21–38 [DOI] [PMC free article] [PubMed] [Google Scholar]
- Bailey‐Elkin BA, Knaap RCM, Johnson GG, Dalebout TJ, Ninaber DK, van Kasteren PB, Bredenbeek PJ, Snijder EJ, Kikkert M, Mark BL (2014) Crystal structure of the Middle East respiratory syndrome coronavirus (MERS‐CoV) papain‐like protease bound to ubiquitin facilitates targeted disruption of deubiquitinating activity to demonstrate its role in innate immune suppression. J Biol Chem 289: 34667–34682 [DOI] [PMC free article] [PubMed] [Google Scholar]
- Bailey‐Elkin BA, Knaap RCM, Kikkert M, Mark BL (2017) Structure and function of viral deubiquitinating enzymes. J Mol Biol 429: 3441–3470 [DOI] [PMC free article] [PubMed] [Google Scholar]
- Barretto N, Jukneliene D, Ratia K, Chen Z, Mesecar AD, Baker SC (2005) The papain‐like protease of severe acute respiratory syndrome coronavirus has deubiquitinating activity. J Virol 79: 15189–15198 [DOI] [PMC free article] [PubMed] [Google Scholar]
- Békés M, Rut W, Kasperkiewicz P, Mulder MPC, Ovaa H, Drag M, Lima CD, Huang TT (2015) SARS hCoV papain‐like protease is a unique Lys48 linkage‐specific di‐distributive deubiquitinating enzyme. Biochem J 468: 215–226 [DOI] [PMC free article] [PubMed] [Google Scholar]
- Békés M, van der Heden van Noort GJ, Ekkebus R, Ovaa H, Huang TT, Lima CD (2016) Recognition of Lys48‐linked Di‐ubiquitin and deubiquitinating activities of the SARS coronavirus papain‐like protease. Mol Cell 62: 572–585 [DOI] [PMC free article] [PubMed] [Google Scholar]
- Berlin DA, Gulick RM, Martinez FJ (2020) Severe Covid‐19. N Engl J Med 10.1056/NEJMcp2009575 [DOI] [PubMed] [Google Scholar]
- Berrow NS, Alderton D, Sainsbury S, Nettleship J, Assenberg R, Rahman N, Stuart DI, Owens RJ (2007) A versatile ligation‐independent cloning method suitable for high‐throughput expression screening applications. Nucleic Acids Res 35: e45 [DOI] [PMC free article] [PubMed] [Google Scholar]
- Caly L, Druce J, Roberts J, Bond K, Tran T, Kostecki R, Yoga Y, Naughton W, Taiaroa G, Seemann T et al (2020) Isolation and rapid sharing of the 2019 novel coronavirus (SARS‐CoV‐2) from the first patient diagnosed with COVID‐19 in Australia. Med J Aust 212: 459–462 [DOI] [PMC free article] [PubMed] [Google Scholar]
- Chou C‐Y, Lai H‐Y, Chen H‐Y, Cheng S‐C, Cheng K‐W, Chou Y‐W (2014) Structural basis for catalysis and ubiquitin recognition by the severe acute respiratory syndrome coronavirus papain‐like protease. Acta Crystallogr D Biol Crystallogr 70: 572–581 [DOI] [PMC free article] [PubMed] [Google Scholar]
- Choy K‐T, Wong AY‐L, Kaewpreedee P, Sia SF, Chen D, Hui KPY, Chu DKW, Chan MCW, Cheung PP‐H, Huang X et al (2020) Remdesivir, lopinavir, emetine, and homoharringtonine inhibit SARS‐CoV‐2 replication in vitro . Antiviral Res 178: 104786 [DOI] [PMC free article] [PubMed] [Google Scholar]
- Chu H, Chan JF‐W, Yuen TT‐T, Shuai H, Yuan S, Wang Y, Hu B, Yip CC‐Y, Tsang JO‐L, Huang X et al (2020) Comparative tropism, replication kinetics, and cell damage profiling of SARS‐CoV‐2 and SARS‐CoV with implications for clinical manifestations, transmissibility, and laboratory studies of COVID‐19: an observational study. Lancet Microbe 1: e14–e23 [DOI] [PMC free article] [PubMed] [Google Scholar]
- Clasman JR, Everett RK, Srinivasan K, Mesecar AD (2020) Decoupling deISGylating and deubiquitinating activities of the MERS virus papain‐like protease. Antiviral Res 174: 104661 [DOI] [PMC free article] [PubMed] [Google Scholar]
- Clementz MA, Chen Z, Banach BS, Wang Y, Sun L, Ratia K, Baez‐Santos YM, Wang J, Takayama J, Ghosh AK et al (2010) Deubiquitinating and interferon antagonism activities of coronavirus papain‐like proteases. J Virol 84: 4619–4629 [DOI] [PMC free article] [PubMed] [Google Scholar]
- Coronaviridae Study Group of the International Committee on Taxonomy of Viruses (2020) The species severe acute respiratory syndrome‐related coronavirus: classifying 2019‐nCoV and naming it SARS‐CoV‐2. Nat Microbiol 5: 536–544 [DOI] [PMC free article] [PubMed] [Google Scholar]
- Daczkowski CM, Dzimianski JV, Clasman JR, Goodwin O, Mesecar AD, Pegan SD (2017a) Structural insights into the interaction of coronavirus papain‐like proteases and interferon‐stimulated gene product 15 from different species. J Mol Biol 429: 1661–1683 [DOI] [PMC free article] [PubMed] [Google Scholar]
- Daczkowski CM, Goodwin OY, Dzimianski JV, Farhat JJ, Pegan SD (2017b) Structurally guided removal of DeISGylase biochemical activity from papain‐like protease originating from middle east respiratory syndrome coronavirus. J Virol 91: 1814 [DOI] [PMC free article] [PubMed] [Google Scholar]
- Dong E, Du H, Gardner L (2020) An interactive web‐based dashboard to track COVID‐19 in real time. Lancet Infect Dis 20: 533–534 [DOI] [PMC free article] [PubMed] [Google Scholar]
- Dzimianski JV, Scholte FEM, Bergeron É, Pegan SD (2019) ISG15: it's complicated. J Mol Biol 431: 4203–4216 [DOI] [PMC free article] [PubMed] [Google Scholar]
- Ebner P, Versteeg GA, Ikeda F (2017) Ubiquitin enzymes in the regulation of immune responses. Crit Rev Biochem Mol Biol 52: 425–460 [DOI] [PMC free article] [PubMed] [Google Scholar]
- Ekkebus R, van Kasteren SI, Kulathu Y, Scholten A, Berlin I, Geurink PP, de Jong A, Goerdayal S, Neefjes J, Heck AJR et al (2013) On terminal alkynes that can react with active‐site cysteine nucleophiles in proteases. J Am Chem Soc 135: 2867–2870 [DOI] [PMC free article] [PubMed] [Google Scholar]
- Emsley P, Lohkamp B, Scott WG, Cowtan K (2010) Features and development of Coot. Acta Crystallogr D Biol Crystallogr 66: 486–501 [DOI] [PMC free article] [PubMed] [Google Scholar]
- Evans PR, Murshudov GN (2013) How good are my data and what is the resolution? Acta Crystallogr D Biol Crystallogr 69: 1204–1214 [DOI] [PMC free article] [PubMed] [Google Scholar]
- Flierman D, van der Heden van Noort GJ, Ekkebus R, Geurink PP, Mevissen TET, Hospenthal MK, Komander D, Ovaa H (2016) Non‐hydrolyzable diubiquitin probes reveal linkage‐specific reactivity of deubiquitylating enzymes mediated by S2 pockets. Cell Chem Biol 23: 472–482 [DOI] [PMC free article] [PubMed] [Google Scholar]
- Freitas BT, Durie IA, Murray J, Longo JE, Miller HC, Crich D, Hogan RJ, Tripp RA, Pegan SD (2020) Characterization and noncovalent inhibition of the deubiquitinase and deISGylase activity of SARS‐CoV‐2 papain‐like protease. ACS Infect Dis 6: 2099–2109 [DOI] [PubMed] [Google Scholar]
- Frias‐Staheli N, Giannakopoulos NV, Kikkert M, Taylor SL, Bridgen A, Paragas J, Richt JA, Rowland RR, Schmaljohn CS, Lenschow DJ et al (2007) Ovarian tumor domain‐containing viral proteases evade ubiquitin‐ and ISG15‐dependent innate immune responses. Cell Host Microbe 2: 404–416 [DOI] [PMC free article] [PubMed] [Google Scholar]
- Gersch M, Gladkova C, Schubert AF, Michel MA, Maslen S, Komander D (2017) Mechanism and regulation of the Lys6‐selective deubiquitinase USP30. Nat Struct Mol Biol 510: 370–930 [DOI] [PMC free article] [PubMed] [Google Scholar]
- Geurink PP, El Oualid F, Jonker A, Hameed DS, Ovaa H (2012) A general chemical ligation approach towards isopeptide‐linked ubiquitin and ubiquitin‐like assay reagents. ChemBioChem 13: 293–297 [DOI] [PMC free article] [PubMed] [Google Scholar]
- Geurink PP, van der Heden van Noort GJ, Mulder MPC, Knaap RCM, Kikkert M, Ovaa H (2019) Profiling DUBs and Ubl‐specific proteases with activity‐based probes. Meth Enzymol 618: 357–387 [DOI] [PMC free article] [PubMed] [Google Scholar]
- Ghosh AK, Brindisi M, Shahabi D, Chapman ME, Mesecar AD (2020) Drug development and medicinal chemistry efforts toward SARS‐coronavirus and Covid‐19 therapeutics. ChemMedChem 15: 907–932 [DOI] [PMC free article] [PubMed] [Google Scholar]
- Gouet P, Robert X, Courcelle E (2003) ESPript/ENDscript: extracting and rendering sequence and 3D information from atomic structures of proteins. Nucleic Acids Res 31: 3320–3323 [DOI] [PMC free article] [PubMed] [Google Scholar]
- Harcourt BH, Jukneliene D, Kanjanahaluethai A, Bechill J, Severson KM, Smith CM, Rota PA, Baker SC (2004) Identification of severe acute respiratory syndrome coronavirus replicase products and characterization of papain‐like protease activity. J Virol 78: 13600–13612 [DOI] [PMC free article] [PubMed] [Google Scholar]
- Heaton SM, Borg NA, Dixit VM (2016) Ubiquitin in the activation and attenuation of innate antiviral immunity. J Exp Med 213: 1–13 [DOI] [PMC free article] [PubMed] [Google Scholar]
- Isaacson MK, Ploegh HL (2009) Ubiquitination, ubiquitin‐like modifiers, and deubiquitination in viral infection. Cell Host Microbe 5: 559–570 [DOI] [PMC free article] [PubMed] [Google Scholar]
- Ivashkiv LB, Donlin LT (2014) Regulation of type I interferon responses. Nat Rev Immunol 14: 36–49 [DOI] [PMC free article] [PubMed] [Google Scholar]
- James TW, Frias‐Staheli N, Bacik J‐P, Levingston Macleod JM, Khajehpour M, García‐Sastre A, Mark BL (2011) Structural basis for the removal of ubiquitin and interferon‐stimulated gene 15 by a viral ovarian tumor domain‐containing protease. Proc Natl Acad Sci USA 108: 2222–2227 [DOI] [PMC free article] [PubMed] [Google Scholar]
- Kabsch W (2010) XDS. Acta Crystallogr D Biol Crystallogr 66: 125–132 [DOI] [PMC free article] [PubMed] [Google Scholar]
- Kim JC, Spence RA, Currier PF, Lu X, Denison MR (1995) Coronavirus protein processing and RNA synthesis is inhibited by the cysteine proteinase inhibitor E64d. Virology 208: 1–8 [DOI] [PMC free article] [PubMed] [Google Scholar]
- Kotschy A, Szlavik Z, Murray J, Davidson J, Maragno AL, Le Toumelin‐Braizat G, Chanrion M, Kelly GL, Gong J‐N, Moujalled DM et al (2016) The MCL1 inhibitor S63845 is tolerable and effective in diverse cancer models. Nature 538: 477–482 [DOI] [PubMed] [Google Scholar]
- Lee H, Lei H, Santarsiero BD, Gatuz JL, Cao S, Rice AJ, Patel K, Szypulinski MZ, Ojeda I, Ghosh AK et al (2015) Inhibitor recognition specificity of MERS‐CoV papain‐like protease may differ from that of SARS‐CoV. ACS Chem Biol 10: 1456–1465 [DOI] [PMC free article] [PubMed] [Google Scholar]
- Lindner HA, Fotouhi‐Ardakani N, Lytvyn V, Lachance P, Sulea T, Ménard R (2005) The papain‐like protease from the severe acute respiratory syndrome coronavirus is a deubiquitinating enzyme. J Virol 79: 15199–15208 [DOI] [PMC free article] [PubMed] [Google Scholar]
- Lindner HA, Lytvyn V, Qi H, Lachance P, Ziomek E, Ménard R (2007) Selectivity in ISG15 and ubiquitin recognition by the SARS coronavirus papain‐like protease. Arch Biochem Biophys 466: 8–14 [DOI] [PMC free article] [PubMed] [Google Scholar]
- Magis C, Taly J‐F, Bussotti G, Chang J‐M, Di Tommaso P, Erb I, Espinosa‐Carrasco J, Notredame C (2014) T‐Coffee: tree‐based consistency objective function for alignment evaluation. Methods Mol Biol 1079: 117–129 [DOI] [PubMed] [Google Scholar]
- McCoy AJ, Grosse Kunstleve RW, Adams PD, Winn MD, Storoni LC, Read RJ (2007) Phaser crystallographic software. J Appl Crystallogr 40: 658–674 [DOI] [PMC free article] [PubMed] [Google Scholar]
- Mevissen TET, Hospenthal MK, Geurink PP, Elliott PR, Akutsu M, Arnaudo N, Ekkebus R, Kulathu Y, Wauer T, El Oualid F et al (2013) OTU deubiquitinases reveal mechanisms of linkage specificity and enable ubiquitin chain restriction analysis. Cell 154: 169–184 [DOI] [PMC free article] [PubMed] [Google Scholar]
- Mevissen TET, Komander D (2017) Mechanisms of deubiquitinase specificity and regulation. Annu Rev Biochem 86: 159–192 [DOI] [PubMed] [Google Scholar]
- Michel MA, Komander D, Elliott PR (2018) Enzymatic assembly of ubiquitin chains. Methods Mol Biol 1844: 73–84 [DOI] [PubMed] [Google Scholar]
- Perng Y‐C, Lenschow DJ (2018) ISG15 in antiviral immunity and beyond. Nat Rev Microbiol 16: 423–439 [DOI] [PMC free article] [PubMed] [Google Scholar]
- Pruijssers AJ, George AS, Schäfer A, Leist SR, Gralinksi LE, Dinnon KH, Yount BL, Agostini ML, Stevens LJ, Chappell JD et al (2020) Remdesivir inhibits SARS‐CoV‐2 in human lung cells and chimeric SARS‐CoV expressing the SARS‐CoV‐2 RNA polymerase in mice. Cell Rep 32: 107940 [DOI] [PMC free article] [PubMed] [Google Scholar]
- Ratia K, Saikatendu KS, Santarsiero BD, Barretto N, Baker SC, Stevens RC, Mesecar AD (2006) Severe acute respiratory syndrome coronavirus papain‐like protease: structure of a viral deubiquitinating enzyme. Proc Natl Acad Sci USA 103: 5717–5722 [DOI] [PMC free article] [PubMed] [Google Scholar]
- Ratia K, Pegan S, Takayama J, Sleeman K, Coughlin M, Baliji S, Chaudhuri R, Fu W, Prabhakar BS, Johnson ME et al (2008) A noncovalent class of papain‐like protease/deubiquitinase inhibitors blocks SARS virus replication. Proc Natl Acad Sci USA 105: 16119–16124 [DOI] [PMC free article] [PubMed] [Google Scholar]
- Ratia K, Kilianski A, Baez‐Santos YM, Baker SC, Mesecar A (2014) Structural basis for the ubiquitin‐linkage specificity and deISGylating activity of SARS‐CoV papain‐like protease. PLoS Pathog 10: e1004113 [DOI] [PMC free article] [PubMed] [Google Scholar]
- Rut W, Lv Z, Zmudzinski M, Patchett S, Nayak D, Snipas SJ, El Oualid F, Huang TT, Békés M, Drag M et al (2020) Activity profiling and structures of inhibitor‐bound SARS‐CoV‐2‐PLpro protease provides a framework for anti‐COVID‐19 drug design. bioRxiv 10.1101/2020.04.29.068890 [PREPRINT] [DOI] [PMC free article] [PubMed] [Google Scholar]
- Shin D, Mukherjee R, Grewe D, Bojkova D, Baek K, Bhattacharya A, Schulz L, Widera M, Mehdipour AR, Tascher G et al (2020) Papain‐like protease regulates SARS‐CoV‐2 viral spread and innate immunity. Nature 10.1038/s41586-020-2601-5 [DOI] [PMC free article] [PubMed] [Google Scholar]
- Souers AJ, Leverson JD, Boghaert ER, Ackler SL, Catron ND, Chen J, Dayton BD, Ding H, Enschede SH, Fairbrother WJ et al (2013) ABT‐199, a potent and selective BCL‐2 inhibitor, achieves antitumor activity while sparing platelets. Nat Med 19: 202–208 [DOI] [PubMed] [Google Scholar]
- Swatek KN, Komander D (2016) Ubiquitin modifications. Cell Res 26: 399–422 [DOI] [PMC free article] [PubMed] [Google Scholar]
- Swatek KN, Aumayr M, Pruneda JN, Visser LJ, Berryman S, Kueck AF, Geurink PP, Ovaa H, van Kuppeveld FJM, Tuthill TJ et al (2018) Irreversible inactivation of ISG15 by a viral leader protease enables alternative infection detection strategies. Proc Natl Acad Sci USA 115: 2371–2376 [DOI] [PMC free article] [PubMed] [Google Scholar]
- Turnbull AP, Ioannidis S, Krajewski WW, Pinto‐Fernandez A, Heride C, Martin ACL, Tonkin LM, Townsend EC, Buker SM, Lancia DR et al (2017) Molecular basis of USP7 inhibition by selective small‐molecule inhibitors. Nature 550: 481–486 [DOI] [PMC free article] [PubMed] [Google Scholar]
- Wang M, Cao R, Zhang L, Yang X, Liu J, Xu M, Shi Z, Hu Z, Zhong W, Xiao G (2020) Remdesivir and chloroquine effectively inhibit the recently emerged novel coronavirus (2019‐nCoV) in vitro . Cell Res 30: 269–271 [DOI] [PMC free article] [PubMed] [Google Scholar]
- Wilkinson KD, Gan‐Erdene T, Kolli N (2005) Derivitization of the C‐terminus of ubiquitin and ubiquitin‐like proteins using intein chemistry: methods and uses. Meth Enzymol 399: 37–51 [DOI] [PubMed] [Google Scholar]
- Williams CJ, Headd JJ, Moriarty NW, Prisant MG, Videau LL, Deis LN, Verma V, Keedy DA, Hintze BJ, Chen VB et al (2018) MolProbity: more and better reference data for improved all‐atom structure validation. Protein Sci 27: 293–315 [DOI] [PMC free article] [PubMed] [Google Scholar]
- Winn MD, Ballard CC, Cowtan KD, Dodson EJ, Emsley P, Evans PR, Keegan RM, Krissinel EB, Leslie AGW, McCoy A et al (2011) Overview of the CCP4 suite and current developments. Acta Crystallogr D Biol Crystallogr 67: 235–242 [DOI] [PMC free article] [PubMed] [Google Scholar]
- Yao X, Ye F, Zhang M, Cui C, Huang B, Niu P, Liu X, Zhao L, Dong E, Song C et al (2020) In vitro antiviral activity and projection of optimized dosing design of hydroxychloroquine for the treatment of severe acute respiratory syndrome coronavirus 2 (SARS‐CoV‐2). Clin Infect Dis 71: 732–739 [DOI] [PMC free article] [PubMed] [Google Scholar]
- Yau R, Rape M (2016) The increasing complexity of the ubiquitin code. Nat Cell Biol 18: 579–586 [DOI] [PubMed] [Google Scholar]
- Ye Y, Akutsu M, Reyes‐Turcu F, Enchev RI, Wilkinson KD, Komander D (2011) Polyubiquitin binding and cross‐reactivity in the USP domain deubiquitinase USP21. EMBO Rep 12: 350–357 [DOI] [PMC free article] [PubMed] [Google Scholar]
- Zhang X, Smits AH, van Tilburg GBA, Jansen PWTC, Makowski MM, Ovaa H, Vermeulen M (2017) An interaction landscape of ubiquitin signaling. Mol Cell 65: 1–39 [DOI] [PubMed] [Google Scholar]
Associated Data
This section collects any data citations, data availability statements, or supplementary materials included in this article.
Supplementary Materials
Appendix
Expanded View Figures PDF
Dataset EV1
Source Data for Expanded View
Review Process File
Source Data for Figure 1
Source Data for Figure 2
Source Data for Figure 3
Source Data for Figure 5
Data Availability Statement
All reagents and materials are available upon reasonable request from the corresponding author (dk@wehi.edu.au). Coordinates and structure factors have been deposited with the protein data bank (https://www.rcsb.org/) under accession codes 6xaa (https://www.rcsb.org/structure/6XAA), 6xa9 (https://www.rcsb.org/structure/6XA9).