

Abstract
Coughs are one of the primary means of transmission of diseases such as influenza and SARS-CoV-2 (COVID-19). Disease spreading occurs by the expulsion of pathogen containing aerosol droplets. Fine droplets can pass through layers of masks and are carried away by the exhaled airflow unlike larger droplets that settle down due to gravity. Hence, it is important to quantitatively assess the maximum distance of travel of typical human coughs with and without different types of masks. Even though near field data are available near the mouth, far field data are scarce. In this study, the schlieren method that is a highly sensitive, non-intrusive flow visualization technique is used. It can directly image weak density gradients produced by coughs. An assessment of different methods of covering the mouth while coughing is arrived at by using observations from high speed schlieren images. The effectiveness of coughing into the elbow is examined. The velocity of propagation of coughs and the distance of propagation with and without masks are quantified. It is also found that normalizing the distance–velocity profiles causes all the data to collapse onto a universal non-dimensional curve irrespective of the usage of different types of masks or test subjects. Visualization of cough flow fields and analysis of experimental data reveal that the flow physics is governed by the propagation of viscous vortex rings.
I. INTRODUCTION
Airborne transmission by respiratory aerosol droplets produced during coughing and sneezing is shown to be the dominant mode of spreading for infectious diseases such as influenza and SARS-CoV-2 (COVID-19).1,2 Laser scattering studies show that over 99% of cough generated aerosol droplets are less than 10 µm in diameter.3 It is also shown that the primary size distribution of droplet nuclei in coughs is between 1 µm and 2 µm.4 Optical particle counter measurements have shown that most of the cough aerosol droplets are within 2 µm in diameter.5 These droplets are capable of carrying infectious pathogens and are capable of passing through surgical masks. These droplets can get advected with the expelled air. Models of cough droplet evaporation and propagation including droplet aerodynamics, evaporation thermodynamics, and crystallization kinetics have been developed.6 These models are important as droplet nuclei may still be capable of spreading infectious diseases. N95 masks provide excellent protection but do not completely stop the passage of very fine droplets.7 Face masks along with social distancing are the recommended means of controlling the spread of the novel coronavirus.8,9 Hence, it is important to quantitatively assess the effectiveness of masks in attenuating the airflow and propagation of fine aerosol droplets produced during coughs. Some studies have carried out in vivo estimation of the effectiveness of masks.10 These types of results can be utilized to tune mathematical models of infection spread.11–13 Another possible mode of infection spreading is through upward ejection of aerosol droplets generated by strong turbulent flows produced during flushing of toilets. There are recent computational studies that track the motion of such droplets.14 The effects of environmental conditions and the motion of the head during sneezing have also been computationally addressed.15
Computational models have been used to determine the trajectories of cough droplets, and it is demonstrated that small sized droplets are capable of traveling several meters along with the airflow.16 The circulating motion of vortex rings produced by coughs can enhance the transport of fine cough droplets. Experimental measurements using laser scattering and computational models have shown that cough droplets can travel at least as far as 2 m.17 Particle image velocimetry (PIV) has been used to determine the velocity field of human coughs without masks near the mouth.18 However, since a large fraction of the droplets are between 0.5 µm and 2 µm in diameter,5 it may be difficult to obtain adequate light scattering and mostly larger droplets may show up in experiments. The volumetric airflow rate from coughs has also been studied using spirometer based experiments.19 These data provide relevant information for computational studies that attempt to simulate the airflow and droplet motion from coughs. Scaled experimental models using interrupted jets in water have been used to investigate the nature of different temporal exit velocity profiles.20
Though there are experimental studies using scaled models and mannequins that simulate human cough flow rates,21 experiments using human test subjects are useful due to the complex anatomy of the human nasopharyngeal passage and human head motion while coughing. Experiments with mannequins along with laser scattering studies of coughs seeded by fog particles have been performed, and the distance of propagation of the cough airflow and qualitative images of flow features have been described.22 Schlieren imaging is a useful non-intrusive flow measurement technique that does not need high power laser sources or flow seeders that may be inconvenient to work with. These techniques directly image density gradients in the flow.23 Since coughs are relatively warmer than the environment, a schlieren setup sensitive enough to capture thermal currents from body heat can also adequately image the airflow produced by coughs. Schlieren techniques have been used to obtain qualitative and some near field quantitative estimates of human exhaled airflows.24–28 Qualitative comparisons of different masks have also been performed.26 In this study, the schlieren imaging technique is used with the objective of characterizing the coughs up to the maximum extent of propagation that can be detected by the implemented schlieren setup. The airflow velocities of coughs at distances both close to and far away from the mouth are quantified in order to quantify the effectiveness of different types of masks. Using related shadowgraph methods, coughs without masks have been tracked up to 0.6 m by previous studies.27 The current study improves upon the distance to which the coughs are tracked. In a manner similar to particle image velocimetry, quantitative velocity vector maps can be obtained using successive high speed schlieren images.29–31 Flow visualization methods can help in the quantification of infection transmission through human exhaled airflows. Better recommendations on reducing infection spreading can be arrived at based on results from such experiments.32
II. METHODS
In this study, a 300 mm diameter, 3 m focal length, spherical mirror was used. It was arranged in a double pass coincident setup, as shown in Fig. 1. The beam splitter was used to avoid placing the mirror in an off-axis orientation. Due to the usage of a long focal length spherical mirror, corrective optics were not necessary. Similar setups but with 1 m diameter parabolic mirrors were used in other studies.26,27 A high speed digital camera was used to record the data. The knife edge and slit were kept in a vertical orientation in order to image horizontal density gradients. This knife edge placement does not cut off any vertically deflected light rays and hence is insensitive to vertical density gradients. This arrangement is preferred as the wavefront of the cough airflow presents a horizontal density gradient due to the temperature difference between the ambient atmosphere and the cough airflow. The wavefront of the cough is defined as the interface of the warmer cough airflow and the relatively cooler ambient. Powerful point light sources such as the one used in this study are preferred as fast camera exposures, for high speed schlieren requires very bright point-like light sources. Standard references that explain schlieren and shadowgraph techniques in detail are available and have been used to understand various aspects of schlieren imaging.23
FIG. 1.
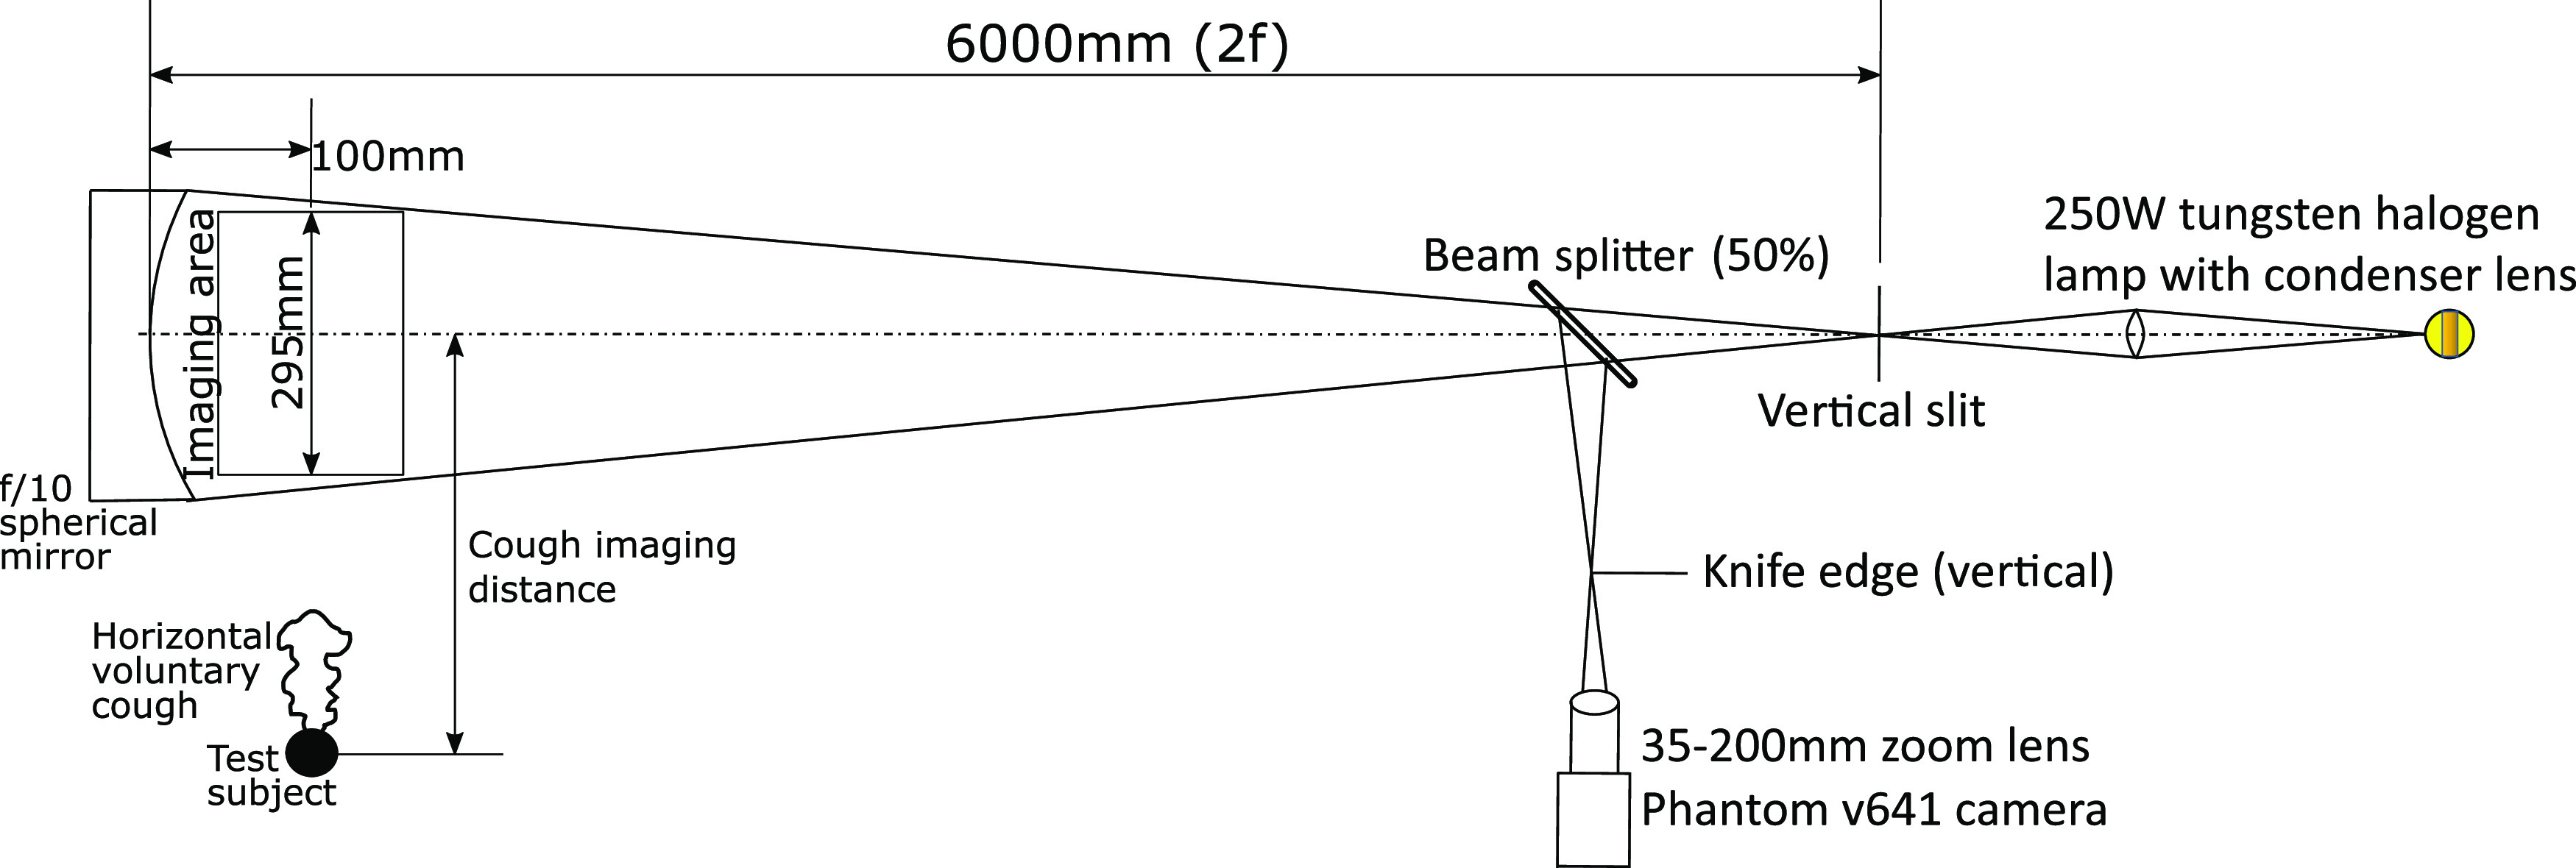
Schematic of the double pass schlieren setup realized for imaging human coughs.
Coughs from distances greater than the diameter of the mirror were imaged by standing away from the test area at measured offset distances and observing the motion of the wavefront of the cough across the mirror. The test subjects were not restrained in any manner to allow the voluntary coughs to be as natural as possible. However, this can lead to a maximum uncertainty of ±5 cm in distance measurements from the mirror when the test subject is standing out of the imaging area. This uncertainty is a worst case value and was estimated based on the maximum deviations in the position of the heads of test subjects while conducting experiments in the field of view of the mirror. This was deemed to be an acceptable compromise as restraining the test subjects would hinder natural body motions during coughing. The actual errors due to this uncertainty are expected to be much lesser as care was taken while measuring the horizontal distance of the test subjects from the center of the mirror. Velocity measurements were obtained by tracking the position of the cough jet boundary over successive frames recorded by the camera. Frame rates ranging from 100 fps to 5000 fps and exposure times varying from 25 µs to 665 µs were used to tailor the quality of the images according to the requirement. No time synchronization was used as the primary objective of these experiments was the determination of distance–velocity profiles. When the test subject was inside the imaging area, the data were acquired at 1500 fps. When test subjects were made to cough from a distance of 0.25 m from the center of the mirror, data were typically acquired at 250 fps. From larger distances, 100 fps was found to be sufficient as the velocity of the cough airflow front is low. In terms of tracking the cough wavefront, the exposure time was found to have a small impact on quantitative results. This is because the cough wavefront is a large scale structure that can easily be discerned against the background even with some motion blur. However, small sized turbulent features are highly smeared with larger exposure times as expected. The measurements were obtained with consent from four male volunteers and one female volunteer, all who were between 23 and 26 years of age.
The schedule of experiments did not follow a prepared test matrix. It was kept flexible to accommodate different maximum distances of voluntary coughs from person to person. The distances for conducting the experiments were determined from results at short ranges from each individual. At least three successive individual coughs were imaged from each distance.
The motion of the cough wavefront was manually tracked using individual frames by recording the pixel location of the cough airflow wavefront. This procedure produces a distance–time profile within the field of view of the mirror. Velocity estimates were obtained by differentiating least squares curve fits to displacement–time profiles over small distance windows rather than taking finite differences in the distance–time data.
A maximum uncertainty of ±5 pixels is possible based on the sharpness of the wavefront and the resolution of the images acquired. This is seen to lead to a maximum 3σ uncertainty in velocity determination of 0.17 m/s when the velocity is 4.78 m/s (3.5%). When the velocity is 0.18 m/s, the 3σ uncertainty in velocity is seen to be 0.008 m/s (4.3%). The standoff distance from the mirror for the test subjects was kept as small as possible due to considerations of the non-parallel nature of the light path. Due to the long focal length of this setup, uncertainties in results due to standoff distance variations are expected to be less than 2% in magnitude. Furthermore, these two errors have to be considered in the root sum of squares sense. Hence, the maximum uncertainty in the measurement of the distance of the wavefront of ±5 cm is of greater significance than the uncertainty in velocity estimation at long ranges (due to the test subjects left unrestrained). In all plots containing quantitative data, the distance measurement uncertainty is shown as horizontal error bars. Wherever vertical error bars are shown in distance–time profiles, they represent a ±10 pixel uncertainty, which is twice the maximum width of the wavefront of the cough (or effectively a 6σ uncertainty). Attempts to automate the post-processing were only moderately successful due to high background air movement levels and insufficient vibration isolation of the schlieren setup.
III. RESULTS AND DISCUSSION
Figures 2(a)–2(i) present schlieren images at 40 ms after the initiation of the cough produced while covering the nose and mouth using various techniques. These figures are qualitative, and the flow patterns are representative of coughs produced by different test subjects. The main differences between test subjects are in the quantitative values of the initial airflow velocity and distance of propagation. Qualitative flow features remain similar across test subjects. Grayscale schlieren images presented in this section without front floodlights may not clearly depict the manner of covering the nose and mouth. Hence, Fig. 6 is included to show how a test subject typically performed these actions while coughing.
FIG. 2.

(a) Typical cough without a mask. (b) Typical cough with a disposable surgical mask. (c) Typical cough with an N95 mask. (d) Covering the mouth with one hand. (e) Covering the mouth and nose by cupping both hands. (f) Using a 40 × 40 cm2 handkerchief folded over four times. (g) Covering the mouth with the hand while wearing a disposable surgical mask. (h) Coughing into a bare elbow (no shirt sleeve). (i) Coughing into the elbow while wearing a shirt with a long sleeve that covers the nose. (j) Visualization of the wavefront motion from a cough initiated 2.0 m from the center of the mirror (no mask case). For reference, the diameter of bright circular images of the mirror is 300 mm. Refer to Fig. 6 to see how a typical test subject covers the nose and mouth while coughing.
FIG. 6.

Images illustrating various methods of covering the nose and mouth in order to provide context to Figs. 2 and 5. (a) No mask. (b) Surgical mask. (c) N95 mask. (d) Single hand. (e) Cupped hands. (f) Folded handkerchief. (g) Surgical mask along with a single hand covering the nose and mouth. (h) Elbow left bare covering the mouth. (i) Covering the nose and mouth while wearing a full sleeved shirt.
40 ms is chosen so that the cough airflows are completely contained in the available imaging area. The boundaries of the airflow are represented by thick dashed lines. This is done in order to provide a qualitative understanding of the relative velocities of the airflow produced under various situations. The length scale for this figure is 300 mm, which corresponds to the diameter of the bright circular image of the spherical mirror as seen in Figs. 2(a)–2(i). The actual reference used for velocimetry is on the order of 285 mm–295 mm due to the non-parallel path of the light rays and the standoff distance of the test subjects from the mirror.
The effectiveness of surgical and N95 masks in comparison with coughing with an uncovered mouth and nose is apparent from Figs. 2(a)–2(c). Disposable three ply surgical masks such as the one used in the current study cut down the initial velocity. N95 masks are much more effective, and the initial velocity is lowered even further. Across five different test subjects, disposable surgical masks used in this study cut down the initial velocity by an approximate factor of 2–4. N95 masks reduced the initial velocity by a factor of about 6–10. Different individuals produce different cough airflow velocities. Voluntary coughs from individuals can be influenced due to the presence and usage of masks, which may not occur in real coughs. Coughs from many more test subjects have to be analyzed to provide an accurate quantitative measure of effectiveness of different types of masks in reducing the airflow velocity. The minimum number of test subjects required for this purpose must be determined through statistical considerations.
Schlieren flow visualization on account of its sensitivity can easily visualize leakage airflows as seen in Fig. 2(c). Here, the leak is due to an improper fit at the bridge of the nose. It has been identified in a computational droplet tracking study that leakage from improperly fitting masks can significantly reduce the effectiveness of masks in stopping droplet travel.33 The same study has shown that droplets travel approximately half the distance while wearing regular face masks. The current study reveals a similar drop in the initial airflow velocity as well as the distance of propagation of the airflow. This reinforces the assumption that cough droplet and airflow propagation distances are correlated. Schlieren techniques such as the ones from this study can be used to quantify air leakage from improperly fitted masks as computational approaches will face difficulty in modeling the human facial motion and mask material compliance effects. This leakage has also been observed in previous studies with schlieren imaging. Laser scattering studies with mannequin models have also revealed the existence of such leaks with masks that have bendable metallic clips to ensure a fit at the bridge of the nose.22 This suggests that unless very good care is taken, such leaks are generally difficult to contain. Even medical grade N95 masks used in the current study were unable to stop this leakage. This is likely due to the pressure rise inside the mask while coughing that causes potential leaks to open up.
Figure 2(d) is a schlieren image of a test subject coughing while covering the nose and mouth with a single hand. This reduces the airflow velocity as expected, but there is significant leakage through the gaps between the fingers and some flow is redirected upward and downward. When using two cupped hands as seen in Fig. 2(e) to cover the nose and mouth as some people do, it is observed that there are three leaks: one through the gap between the palms, a leak caused by the airflow redirected upward, and a third leak that passes through the gap left between the fourth and fifth digits of the hands while cupping. Figure 2(g) shows that covering the nose with a hand while also wearing a disposable surgical mask nearly stops the horizontal spreading of the cough airflow. However, most of the flow is redirected upward and downward. From Figs. 2(f) and 2(i), it is seen that a folded handkerchief held by a hand and an elbow covered by a sleeve are the best in terms of attenuating the airflow from a cough if N95 masks are not available. Coughing into the elbow is not very effective if it is left bare [Fig. 2(h)]. The airflow from the mouth is bifurcated upward and downward. The subsequent flow from the nose advects the upward moving airflow forward. This is because a bare elbow is unable to form a proper seal against the airflow from the nose. If the arm is covered by a sleeve, it can act as an obstruction to the nose airflow and the spread into the environment is limited. This has been noted in a previous study making use of shadowgraph techniques where the efficacy of coughing into sleeves had been questioned.27 In this study, it is found that a loose fitting long sleeve does much better than a bare elbow in reducing the ejection of cough air into the atmosphere. This is because a loose sleeve can form a much better seal against the airflow from the nose and mouth rather than the bare elbow or a tighter well fit sleeve. In Fig. 2(j), the motion of the wavefront of a cough without a mask initiated from a distance of 2.0 m from the mirror center is shown. This shows how the speed of the cough wavefront at large distances from a mirror can be estimated. Figure 2(j) is highly processed to enhance the visibility of the weak wavefront and eliminate noise in the images.
From some male test subjects, hoarse sounding coughs were heard. Correspondingly, a periodic vortex ring ejection phenomenon was seen in high speed schlieren videos that appears as a pulsation of the cough airflow. These pulsations start several milliseconds after the initiation of the cough. Vortex rings are typically produced by injecting fluid into a quiescent medium for a short duration. This is true even while coughing, and vortex rings are formed during the initiation of coughs. In the laboratory, they are typically produced by the motion of a piston pushing a column of fluid into a still reservoir. In the situation considered in this paper, vibrations in the airway passage lead to periodic constrictions and relaxations leading to flow variations that produce vortex rings. These vortex rings are different from the initial vortex ring that is always produced. These subsequent periodic vortex rings and corresponding pulsations in the flow were not observed in individuals with clean sounding coughs. The female test subject in this study did not produce a hoarse sounding cough, and no pulsations in the cough airflow were observed. The results are shown in Fig. 3. At some reference time t0, the first pulse is seen in the flow. At t0 + 7.2 ms and t0 + 14.4 ms, the second and third pulses are seen, respectively. At t0 + 3.6 ms, the first pulse that had appeared at t0 is seen to move forward. This image shows that at t0 + 3.6 ms, there is no flow structure seen at the original location of the first pulse. This image is shown to demonstrate that the pulses are not stationary phenomena but are large scale structures being advected along with the cough airflow. High speed schlieren videos show the same phenomenon in greater temporal detail. Thus, the time period of vortex ring ejection is ∼7.2 ms and the frequency of vortex ring ejection has been estimated as 138 Hz from these data. This frequency is in the same range as the natural speech frequency of the test subject leading support to the hypothesis that this phenomenon is driven by the vibrations of the vocal cords.
FIG. 3.

Sequence of schlieren images showing the periodic ejection and motion of vortex rings in hoarse sounding coughs.
With a qualitative understanding of how cough airflows behave, a more detailed quantitative investigation was undertaken. During the ongoing COVID-19 pandemic, it was observed that the usage of masks and social distancing were the most consistent recommendations given by public health agencies and officials. Hence, it was decided to investigate the spreading distances and velocities of coughs while wearing disposable surgical masks and N95 respirators and compare them with the situation while not wearing a mask. Other investigators have also identified that social distancing guidelines may need to be critically analyzed and updated based on experimental and computational analysis of cough droplet propagation in human cough generated airflows.34,35
Figures 4(a)–4(c) show that there is a wide spread of initial velocities between the coughs of different individuals. Except in Figs. 4(c) and 4(f) corresponding to coughs while wearing N95 masks, each data point usually represents a velocity measurement from a different cough. Cough airflows while wearing N95 masks were completely contained in the field of view, and hence, multiple coughs from the same individual were not used. Different coughs from the same individual appear to have low variability as seen from Figs. 4(a) and 4(b) where data from individuals all lie on the same trend curve. This indicates that there is some consistency in the strength of typical voluntary coughs produced by individuals. The much larger person to person variability could depend on differences in the initial cough velocity, the time duration of coughs, and the open area of the mouth.
FIG. 4.

(a) Distance–velocity profiles for five test subjects coughing without masks. (b) Distance–velocity profiles for test subjects coughing while wearing disposable surgical masks. (c) Distance–velocity profiles for test subjects coughing while wearing N95 masks. (d) Non-dimensional results for coughing without masks. (e) Non-dimensional results for coughing with disposable surgical masks. (f) Non-dimensional results for coughing with N95 masks.
Without a mask, the distance of propagation was seen to range from 1.5 m to ∼3 m in the existing schlieren setup. These values are similar to measurements reported in the literature using cough simulators22 where a value of 8 ft is reported for coughs simulated by mannequin models without masks. However, large variations across different test subjects are apparent from this study, and accurate quantification of spreading distances must be obtained from sufficiently large sample sizes. Even a simple disposable surgical mask drastically reduced the spread to between 0.5 m and 1.5 m. N95 masks are the best at containing the airflow and limit the spread to between 0.1 m and 0.25 m across different test subjects. This maximum distance of spread estimation is based on the visibility of the motion of the cough wavefront. Visibility of the wavefront drops off usually when the velocity of the wavefront drops below 5 cm/s–10 cm/s and the background air motion has similar levels. At such slow horizontal speeds, the cough air tends to rise vertically due to buoyancy and the horizontal spread is contained to this distance.
All the data in Fig. 4(c) are obtained by taking analytical derivatives of curve fits to distance–time profiles from N95 masks. This is because the schlieren technique does not measure velocities directly, but instead the velocities are measured by tracking the rate of change in displacement of the cough airflow wavefront. For the other cases without masks or with disposable surgical masks, the velocities and distance of propagation are high and the variation of velocity with distance is low. This coupled with the small field of view leads to the inability in obtaining complete distance–time profiles with a single cough. Hence, several coughs were imaged by making the test subject stand at progressively greater distances from the center of the mirror.
This procedure lends itself well to the estimation of distance–velocity profiles, but distance–time profiles are not obtained since multiple coughs have to be imaged and time synchronization for the initiation of the cough is unavailable with a single camera setup. Over small time windows, linear fits to distance–time data of the cough wavefront motion serve as the approximations to the wavefront velocity when the cough airflow passes across the imaging region. This procedure has the benefit of demonstrating that each individual over the duration of the test campaign has relatively good consistency in producing voluntary coughs. This is seen from the fact that all the data points fall on very definite exponential trends. However, coughs with N95 masks were completely contained in the mirror and the entire distance–time profiles can be curve fit using suitable functions. The choice of the curve fit is motivated by the success of the exponential fit in describing the experimental data without masks and with disposable surgical masks. Hence, the velocity–distance profiles can be obtained by analytically differentiating these curve fits without resorting to the previous procedure of using small time windows. This process is followed rather than methods such as numerical differentiation as numerical derivatives of experimental data are generally very noisy. Backward and central differences were initially attempted, and it was seen that they have a large scatter about the same exponential trend and hence are abandoned in favor of the currently adopted method.
These measurements are non-dimensionalized by using the initial velocity and the distance at which the velocity of the wavefront drops to 1% of the initial level for each individual test subject. This 1% figure of merit is completely arbitrary, and any consistent value can be taken for non-dimensionalization. The initial velocity can be determined either by considering the frame–frame motion at the onset of cough or by curve fitting the distance–velocity profiles. In this study, initial velocities obtained from curve fits are used. This normalization causes all the aggregated data to collapse onto the same curve, as shown in Figs. 4(d)–4(f). The equation of the universal curve followed is v/v0 = exp(−4.673 x/dc), where v0 and dc are the reference velocity and distance used to non-dimensionalize the experimental data. In this study, the parameter dc is obtained by extrapolating the exponential curve fits to the wavefront distance–velocity profiles of individual test subjects. Further research is required to relate this characteristic distance to the initial cough wavefront velocity, the cough duration, and the mouth open areas. Additionally, this must be validated with dynamically scaled experiments in neutrally buoyant conditions in order to eliminate the effect of the upward rising tendency of warm cough air.
As seen in Fig. 4, exponential profiles fit the distance–velocity data well. Thus, a more thorough investigation of the feasibility of the fitting was performed to justify why a single exponential fit is appropriate for the data throughout the distance of propagation of cough airflows. This is required as previous studies describe the distance–time profiles by means of a two stage jet with different curves at initial and final times.20 No single power law curve was found to represent the data well. In this study, we make use of the data from N95 masks as complete time–distance profiles are available for long time durations due to lower velocities of propagation.
Figure 5(a) shows a well defined vortex ring when a test subject wearing an N95 mask has executed a cough. In the other cases with no masks or disposable surgical masks, high speed schlieren images show an initial vortex ring that gets engulfed by the trailing flow that catches up. The cough airflow subsequently leaves the imaging area due to the restriction of the mirror diameter. Hence, the same analysis could not be repeated for those cases. On the other hand, the N95 mask is able to dissipate the airflow well enough that individual vortex rings are visible. It is also qualitatively observed that to obtain similar results from piston/cylinder vortex ring generators, a stroke length–diameter ratio greater than 4.0 must be required. This observation is made based on studies that determine the formation number for vortex rings.36 This is important because experiments with mannequins and cough simulators need to satisfy this condition apart from reproducing realistic volumetric flow rates measured from coughs. Failing to do so will not produce the same vortex ring and trailing jet structures that are observed in real coughs. More detailed experiments are required to obtain quantitative estimates of the circulation and vorticity fields produced by coughs.
FIG. 5.

(a) Typical vortex ring formed due to coughing with an N95 mask. (b) Fitting time–distance data using . (c) Comparing the results from exponential fits to distance–velocity data and the results obtained by curve fitting with the analytical form of the velocity of propagation of viscous vortex rings.
From analysis, it is possible to obtain approximate expressions for the velocity of propagation of viscous vortex rings.37,38 In particular, a simple analytical result for the propagation velocity that depends on time (t), initial radius (R), vortex ring circulation (χ), and kinematic viscosity (ν) when νt ≪ R2 is available.37 The form of the expression is U = a + b log(t). Integrating this expression leads to the expression for the distance–time profile. Hence, this must be the natural choice for a curve fit for the data when νt ≪ R2. (The typical value of νt for t = 1 s is 1.5 × 10⁻⁵ and R2 is ∼1.56 × 10⁻⁴ for a vortex ring that is initially 2.5 cm in diameter. This indicates an order of magnitude difference and the assumptions here are valid.)
Figure 5(b) demonstrates that the time–distance data are well fitted by the profiles. Figure 5(c) shows the distance–velocity profiles estimated for the N95 mask using experimental data. The scattered data in Fig. 5(c) are estimated using the curve fit coefficients from Fig. 5(b). [Three out of five subjects are used to avoid cluttering in Fig. 5(c).] The analytical form of the expressions for the velocity of viscous vortex rings is used to obtain the velocity, and the distance is noted from schlieren images. The exponential fits to the data in Fig. 4(c) are superposed on the Fig. 5(c) to show that the exponential fit is a good representation of the data even if it is not arising from an analytical result for the propagation of viscous vortex rings. Additionally, it is possible that that exponential fit will remain valid even for νt ≃ R2 and νt ≫ R2, whereas the analytical expression fails as it is only accurate to first order and the slow exponential decay in circulation must be considered. The distance–velocity profiles from this theory are seen to be Lambert-W functions, and these will not remain valid when the assumptions in the analytical result break down. The same exercise is not possible in this study for the case without masks or with the surgical masks. This is because experimental time–distance profiles for the entire distance of travel are not available due to the small size of the schlieren mirror. Velocity–distance measurements are available at large distances, and time–distance profiles can only be reconstructed by integration of the curve fits.
This analysis along with the universality of the non-dimensional results indicates that vortex rings are the driving phenomenon behind coughs. Any simulation or experiment that tries to simulate natural coughs must attempt to recreate the same flow structures apart from cough flow rates and initial velocities as these play an important role in enhancing the transport of respiratory droplets.
IV. CONCLUSIONS
Voluntary coughs from five test subjects were qualitatively and quantitatively analyzed using the schlieren imaging technique in this study. It is shown that without masks, the airflow from coughs is capable of traversing at least 1.5 m–3.0 m. A disposable surgical mask greatly reduces this distance to between 0.5 m and 1.5 m. N95 masks have the best effectiveness and completely contain the horizontal spread to between 0.1 m and 0.25 m. It was also observed and confirmed that a long sleeve that covers the elbow substantially reduces the ejection of the cough airflow into the environment compared to coughing into a bare elbow. This study again emphasizes the simultaneous need for face masks and adequate social distancing. A periodic vortex ring ejection phenomenon is seen in hoarse coughs from two male test subjects. This is different from the leading vortex ring motion, which occurs for all test subjects during the initiation of coughs. Quantitatively, the frequency of vortex ring ejection was observed to be in the same range as the natural frequency of adult human male vocal cords. In the example shown in this study, the frequency of pulsation was 138 Hz.
Non-dimensionalization of the experimental distance–velocity data revealed that there is a universal exponentially decaying distance–velocity trend that all cough airflows follow. The universal curve obtained in this study is v/v0 = exp(−4.673x/dc). Additional experiments are required to establish a correlation of the reference distance (dc) used for non-dimensionalization with parameters such as the initial cough velocity, the time duration of the cough, and the open area of the mouth. It was also demonstrated that the distance–time profiles for the vortex rings ejected from coughing into N95 masks are well fitted with the form of the analytical expression for the velocity of propagation of viscous vortex rings. Exponential curves are close to the fits using the expressions obtained from approximate analytical considerations and can be used for quantitative descriptions of distance–velocity profiles of cough airflows to large distances. This analysis confirms that all cough airflows are governed by the physics of viscous vortex rings since the same universal curve is valid for experimental data from coughs without masks or with disposable surgical masks. Any subsequent tests with mannequins and cough simulators must attempt to recreate similar flow fields in order to accurately capture the propagation of airflow from coughs.
DATA AVAILABILITY
The distribution of raw data is subject to institutional restrictions. The data that support the findings of this study are available from the corresponding author upon reasonable request.
ACKNOWLEDGMENTS
The authors thank K. Srinivasan, Dr. S. L. N. Desikan, R. Saravanan, B. Murugan, and K. J. Francise for providing valuable suggestions regarding high speed schlieren imaging. Additionally, the authors thank Dr. Pankaj Priyadarshi for reviewing the initial manuscript and providing valuable inputs.
Note: This paper is part of the Special Topic on Flow and the Virus.
Contributor Information
Padmanabha Prasanna Simha, Email: , .
Prasanna Simha Mohan Rao, Email: .
REFERENCES
- 1.Cowling B. J., Ip D. K., Fang V. J., Suntarattiwong P., Olsen S. J., Levy J., Uyeki T. M., Leung G. M., Peiris J. M., Chotpitayasunondh T. et al. , “Aerosol transmission is an important mode of influenza A virus spread,” Nat. Commun. 4, 1935 (2013). 10.1038/ncomms2922 [DOI] [PMC free article] [PubMed] [Google Scholar]
- 2.Zhang R., Li Y., Zhang A. L., Wang Y., and Molina M. J., “Identifying airborne transmission as the dominant route for the spread of COVID-19,” Proc. Natl. Acad. Sci. U. S. A. 117, 14857 (2020). 10.1073/pnas.2009637117 [DOI] [PMC free article] [PubMed] [Google Scholar]
- 3.Zayas G., Chiang M. C., Wong E., MacDonald F., Lange C. F., Senthilselvan A., and King M., “Cough aerosol in healthy participants: Fundamental knowledge to optimize droplet-spread infectious respiratory disease management,” BMC Pulm. Med. 12, 11 (2012). 10.1186/1471-2466-12-11 [DOI] [PMC free article] [PubMed] [Google Scholar]
- 4.Yang S., Lee G. W. M., Chen C.-M., Wu C.-C., and Yu K.-P., “The size and concentration of droplets generated by coughing in human subjects,” J. Aerosol Med. 20, 484–494 (2007). 10.1089/jam.2007.0610 [DOI] [PubMed] [Google Scholar]
- 5.Papineni R. S. and Rosenthal F. S., “The size distribution of droplets in the exhaled breath of healthy human subjects,” J. Aerosol Med. 10, 105–116 (1997). 10.1089/jam.1997.10.105 [DOI] [PubMed] [Google Scholar]
- 6.Chaudhuri S., Basu S., Kabi P., Unni V. R., and Saha A., “Modeling the role of respiratory droplets in COVID-19 type pandemics,” Phys. Fluids 32, 063309 (2020). 10.1063/5.0015984 [DOI] [PMC free article] [PubMed] [Google Scholar]
- 7.Qian Y., Willeke K., Grinshpun S. A., Donnelly J., and Coffey C. C., “Performance of N95 respirators: Filtration efficiency for airborne microbial and inert particles,” Am. Ind. Hyg. Assoc. J. 59, 128–132 (1998). 10.1080/15428119891010389 [DOI] [PubMed] [Google Scholar]
- 8.Greenhalgh T., Schmid M. B., Czypionka T., Bassler D., and Gruer L., “Face masks for the public during the COVID-19 crisis,” BMJ 369, m1435 (2020). 10.1136/bmj.m1435 [DOI] [PubMed] [Google Scholar]
- 9.Feng S., Shen C., Xia N., Song W., Fan M., and Cowling B. J., “Rational use of face masks in the COVID-19 pandemic,” Lancet Respir. Med. 8, 434–436 (2020). 10.1016/s2213-2600(20)30134-x [DOI] [PMC free article] [PubMed] [Google Scholar]
- 10.Johnson D. F., Druce J. D., Birch C., and Grayson M. L., “A quantitative assessment of the efficacy of surgical and N95 masks to filter influenza virus in patients with acute influenza infection,” Clin. Infect. Dis. 49, 275–277 (2009). 10.1086/600041 [DOI] [PubMed] [Google Scholar]
- 11.Eikenberry S. E., Mancuso M., Iboi E., Phan T., Eikenberry K., Kuang Y., Kostelich E., and Gumel A. B., “To mask or not to mask: Modeling the potential for face mask use by the general public to curtail the COVID-19 pandemic,” Infect. Dis. Model. 5, 293 (2020). 10.1016/j.idm.2020.04.001 [DOI] [PMC free article] [PubMed] [Google Scholar]
- 12.Long Y., Hu T., Liu L., Chen R., Guo Q., Yang L., Cheng Y., Huang J., and Du L., “Effectiveness of N95 respirators versus surgical masks against influenza: A systematic review and meta-analysis,” J. Evid. Based Med. 13, 93 (2020). 10.1111/jebm.12381 [DOI] [PMC free article] [PubMed] [Google Scholar]
- 13.Fanelli D. and Piazza F., “Analysis and forecast of COVID-19 spreading in China, Italy and France,” Chaos, Solitons Fractals 134, 109761 (2020). 10.1016/j.chaos.2020.109761 [DOI] [PMC free article] [PubMed] [Google Scholar]
- 14.Li Y.-Y., Wang J.-X., and Chen X., “Can a toilet promote virus transmission? From a fluid dynamics perspective,” Phys. Fluids 32, 065107 (2020). 10.1063/5.0013318 [DOI] [PMC free article] [PubMed] [Google Scholar]
- 15.Busco G., Yang S. R., Seo J., and Hassan Y. A., “Sneezing and asymptomatic virus transmission,” Phys. Fluids 32, 073309 (2020). 10.1063/5.0019090 [DOI] [PMC free article] [PubMed] [Google Scholar]
- 16.Wei J. and Li Y., “Enhanced spread of expiratory droplets by turbulence in a cough jet,” Build. Environ. 93, 86–96 (2015). 10.1016/j.buildenv.2015.06.018 [DOI] [Google Scholar]
- 17.Zhu S., Kato S., and Yang J.-H., “Study on transport characteristics of saliva droplets produced by coughing in a calm indoor environment,” Build. Environ. 41, 1691–1702 (2006). 10.1016/j.buildenv.2005.06.024 [DOI] [Google Scholar]
- 18.VanSciver M., Miller S., and Hertzberg J., “Particle image velocimetry of human cough,” Aerosol Sci. Technol. 45, 415–422 (2011). 10.1080/02786826.2010.542785 [DOI] [Google Scholar]
- 19.Gupta J. K., Lin C. H., and Chen Q., “Flow dynamics and characterization of a cough,” Indoor Air 19, 517–525 (2009). 10.1111/j.1600-0668.2009.00619.x [DOI] [PubMed] [Google Scholar]
- 20.Wei J. and Li Y., “Human cough as a two-stage jet and its role in particle transport,” PLoS One 12, e0169235 (2017). 10.1371/journal.pone.0169235 [DOI] [PMC free article] [PubMed] [Google Scholar]
- 21.Bourouiba L., Dehandschoewercker E., and Bush J. W. M., “Violent expiratory events: On coughing and sneezing,” J. Fluid Mech. 745, 537–563 (2014). 10.1017/jfm.2014.88 [DOI] [Google Scholar]
- 22.Verma S., Dhanak M., and Frankenfield J., “Visualizing the effectiveness of face masks in obstructing respiratory jets,” Phys. Fluids 32, 061708 (2020). 10.1063/5.0016018 [DOI] [PMC free article] [PubMed] [Google Scholar]
- 23.Settles G. S., Schlieren and Shadowgraph Techniques: Visualizing Phenomena in Transparent Media (Springer Science & Business Media, 2012). [Google Scholar]
- 24.Settles G. S., Hackett E. B., Miller J. D., and Weinstein L. M., “Full-scale schlieren flow visualization,” Flow Visualization 7, 2–13 (1995). [Google Scholar]
- 25.Tang J. W. and Settles G. S., “Coughing and aerosols,” N. Engl. J. Med. 359, e19 (2008). 10.1056/nejmicm072576 [DOI] [PubMed] [Google Scholar]
- 26.Tang J. W., Liebner T. J., Craven B. A., and Settles G. S., “A schlieren optical study of the human cough with and without wearing masks for aerosol infection control,” J. R. Soc., Interface 6, S727–S736 (2009). 10.1098/rsif.2009.0295.focus [DOI] [PMC free article] [PubMed] [Google Scholar]
- 27.Tang J. W., Nicolle A. D., Klettner C. A., Pantelic J., Wang L., Suhaimi A. B., Tan A. Y., Ong G. W., Su R., Sekhar C. et al. , “Airflow dynamics of human jets: Sneezing and breathing-potential sources of infectious aerosols,” PLoS One 8, e59970 (2013). 10.1371/journal.pone.0059970 [DOI] [PMC free article] [PubMed] [Google Scholar]
- 28.Biss M. M., Settles G. S., Staymates M. E., and Sanderson S. R., “Differential schlieren-interferometry with a simple adjustable Wollaston-like prism,” Appl. Opt. 47, 328–335 (2008). 10.1364/ao.47.000328 [DOI] [PubMed] [Google Scholar]
- 29.Hargather M. J., Lawson M. J., Settles G. S., and Weinstein L. M., “Seedless velocimetry measurements by schlieren image velocimetry,” AIAA J. 49, 611–620 (2011). 10.2514/1.j050753 [DOI] [Google Scholar]
- 30.Biswas S. and Qiao L., “A comprehensive statistical investigation of schlieren image velocimetry (SIV) using high-velocity helium jet,” Exp. Fluids 58, 18 (2017). 10.1007/s00348-017-2305-2 [DOI] [Google Scholar]
- 31.Arnaud E., Mémin E., Sosa R., and Artana G., “A fluid motion estimator for schlieren image velocimetry,” in European Conference on Computer Vision (Springer, 2006), pp. 198–210. [Google Scholar]
- 32.Tang J. W., Noakes C. J., Nielsen P. V., Eames I., Nicolle A., Li Y., and Settles G. S., “Observing and quantifying airflows in the infection control of aerosol- and airborne-transmitted diseases: An overview of approaches,” J. Hosp. Infect. 77, 213–222 (2011). 10.1016/j.jhin.2010.09.037 [DOI] [PMC free article] [PubMed] [Google Scholar]
- 33.Dbouk T. and Drikakis D., “On respiratory droplets and face masks,” Phys. Fluids 32, 063303 (2020). 10.1063/5.0015044 [DOI] [PMC free article] [PubMed] [Google Scholar]
- 34.Bourouiba L., “Turbulent gas clouds and respiratory pathogen emissions: Potential implications for reducing transmission of COVID-19,” JAMA 323, 1837–1838 (2020). 10.1001/jama.2020.4756 [DOI] [PubMed] [Google Scholar]
- 35.Dbouk T. and Drikakis D., “On coughing and airborne droplet transmission to humans,” Phys. Fluids 32, 053310 (2020). 10.1063/5.0011960 [DOI] [PMC free article] [PubMed] [Google Scholar]
- 36.Gharib M., Rambod E., and Shariff K., “A universal time scale for vortex ring formation,” J. Fluid Mech. 360, 121–140 (1998). 10.1017/s0022112097008410 [DOI] [Google Scholar]
- 37.Saffman P. G., “The velocity of viscous vortex rings,” Stud. Appl. Math. 49, 371–380 (1970). 10.1002/sapm1970494371 [DOI] [Google Scholar]
- 38.Pullin D. I., “Vortex ring formation at tube and orifice openings,” Phys. Fluids 22, 401–403 (1979). 10.1063/1.862606 [DOI] [Google Scholar]
Associated Data
This section collects any data citations, data availability statements, or supplementary materials included in this article.
Data Availability Statement
The distribution of raw data is subject to institutional restrictions. The data that support the findings of this study are available from the corresponding author upon reasonable request.