

Abstract
This paper analyses whether social distancing experienced by alternative demographic groups within the US has been different amid COVID‐19. The formal investigation is achieved by using daily state‐level mobility data from the US covering information on the demographic categories of income, education and race/ethnicity. The results show that social distancing has been experienced more by higher‐income, higher‐educated or Asian people after the declaration of National Emergency on 13 March 2020. Since alternative demographic groups were subject to alternative employment opportunities during this period (e.g., due to being able to work from home), it is implied that COVID‐19 has redistributive effects that require demographic‐group specific policies.
Keywords: coronavirus, COVID‐19, demographics, education, income, race, social distancing
Resumen
En este artículo se analiza si el distanciamiento social experimentado por los grupos demográficos alternativos dentro de los EE.UU. ha sido diferente durante la pandemia de COVID‐19. La investigación formal se hizo utilizando datos diarios de movilidad a nivel estatal en los Estados Unidos que incluyen información sobre las categorías demográficas de ingresos, educación y raza/etnia. Los resultados muestran que quienes han experimentado más el distanciamiento social han sido quienes tienen mayores ingresos, mayor educación o personas asiáticas, después de la declaración de emergencia nacional del 13 de marzo de 2020. Dado que los grupos demográficos alternativos tuvieron oportunidades alternativas de empleo durante este período (p. ej. la posibilidad de trabajar desde el hogar), se asume que COVID‐19 tiene efectos redistributivos que requieren políticas específicas para grupos demográficos.
抄録
本稿では、米国内の非主流の人口集団が経験するソーシャル・ディスタンディングは、COVID‐19の下では異なっているかどうかを分析する。所得、教育および人種/民族の人口統計学的カテゴリーに関する情報を含む米国の毎日の州レベルの移動データを用いて、正式な調査を実施する。結果から、国家非常事態宣言が発令された2020年3月13日以降、高所得者、高学歴者、アジア系の間で、社会的距離をとることがより多く経験されていることが示された。この期間、非主流の人口集団が他の雇用機会を受けていた (例えば、在宅勤務で仕事ができるために)ことから、COVID‐19は人口集団固有の政策を必要とする再分配効果を持つといえる。
1. INTRODUCTION
The coronavirus disease 2019 (COVID‐19) was declared as a pandemic by the World Health Organization on 11 March 2020, whereas the US declared National Emergency about it on 13 March 2020. Accordingly, several governments around the world have implemented stay‐at‐home orders as COVID‐19 spreads mainly through person‐to‐person contact (e.g., see Chan et al., 2020), Although some of these orders were based on demographic characteristics such as age groups due to the way that COVID‐19 affects people of alternative ages (e.g., see Dowd et al., 2020), in practice, knowledge and attitudes have been different across other demographic characteristics such as income, education, race, ethnicity, gender, occupation, population, and place of current residence. 1Since economic activity is highly related to mobility as indicated by studies such as by Baker, Farrokhnia, Meyer, Pagel, and Yannelis (2020), these developments imply potential redistributive effects of COVID‐19 across demographic groups that require the attention of policy‐makers.
Based on this motivation, this paper analyses how alternative demographic groups have experienced social distancing within the US amid COVID‐19. Daily state‐level mobility data for social interactions covering the period between 21 January 2020 and 26 June 2020 borrowed from Couture, Dingel, Green, Handbury, and Kevin (2020) are utilized for alternative demographic categories of income, education and race/ethnicity. The descriptive statistics for the median US state suggest that social distancing has been experienced more by higher‐income, higher‐educated or Asian people after the declaration of National Emergency on 13 March 2020. This observation is mostly due to these groups having relatively higher levels of social interaction (with respect to other groups) before the declaration of National Emergency, because all groups have experienced similar levels of social interaction after the declaration.
Since the descriptive statistics for the median US state do not control for any state‐specific development such as state‐level policies or the health system of the state that may change over time, a formal investigation is also achieved by using a panel regression analysis. The objective of this regression is to capture how different demographic groups have achieved social distancing after controlling for factors that are state‐time specific (e.g., state‐level policies on certain days) or group‐state specific (e.g., higher‐income individuals in certain states socially interacting differently from other higher‐income individuals in other states).
The results of the formal investigation support the descriptive statistics by showing that social distancing has been experienced more by higher‐income, higher‐educated or Asian people compared to other demographic groups after the declaration of National Emergency. This result is line with earlier studies such as not only by Austrian et al. (2020) who have shown that lower‐income people have experienced less social distancing due to fear of losing income during COVID‐19 but also by Borjas (2020) who has shown that the likelihood that a test was positive was larger in predominantly black neighbourhoods in New York City. The results are also supported by other studies such as by Baker et al. (2020) who have shown that higher‐income people move less and thus spend less in restaurants, groceries or retailers during COVID‐19 or by Bonaccorsi et al. (2020) who have shown that mobility contraction is stronger in municipalities, where inequality is higher and income per capita is lower, or by Srichan et al. (2020) who have shown that the level of education, occupation or income is associated with how people experience social distancing during COVID‐19.
Important policy implications follow, especially when it is considered that higher‐educated, higher‐income or Asian people were able to work at home and maintain employment during COVID‐19 due to their occupations as suggested in studies such as by Bick, Blandin, and Mertens (2020) or Dingel and Neiman (2020), whereas lower‐educated workers, Blacks or Hispanics were not able to work at home due to their occupations and thus became unemployed as suggested in studies such as by Gupta et al. (2020) or Yasenov (2020). In particular, although higher‐income, higher‐educated or Asian people have experienced higher social distancing after the declaration of National Emergency, since social interaction levels are similar across demographic groups after the declaration, redistributive effects of COVID‐19 are implied due to different demographic groups being or not being able to work at home. Accordingly, demographic‐group specific policies are required to reduce not only the overall economic impact of COVID‐19 but also the corresponding inequality across demographic groups.
The rest of the paper is organized as follows. The next section describes the data set, while Section 3introduces the estimation methodology. Section 4 depicts the empirical results, whereas Section 5 achieves the corresponding discussion. Section 6 concludes.
2. DATA AND DESCRIPTIVE STATISTICS
The social interaction data covering the daily period between 21 January 2020 and 26 June 2020 are borrowed from Couture et al. (2020). This is a state‐level data set of mobility covering information on demographic groups of income, education and race/ethnicity. The social interaction is based on PlaceIQ data that are used to construct a device exposure index (DEX). Given that a smartphone is observed at a particular commercial venue on a particular day, DEX measures the number of distinct devices that visit the same commercial venue on the same day. In order to focus on devices of which movements can be reliably characterized (particularly after the onset of COVID‐19), Couture et al. (2020) restricts the set of devices included in their DEX calculation to those that pinged on at least 11 days over any 14‐day period starting from 1 November 2019. Commercial venues (about 900,000 of them) used in DEX calculations are those that are small enough such that visiting devices are indeed exposed to each other. The state‐level DEX values (used in this paper) measure the average exposure of devices residing in a given US state.
In order to obtain information on demographic groups, Couture et al. (2020) assign a fixed permanent block group of residence for each smartphone device based on the duration of its residential visits in the week prior to 14 February 2020. Once the permanent block group is identified for each smartphone device, Couture et al. (2020) match each device with the corresponding demographic characteristics based on 2014‐2018 American Community Survey (ACS) data.
In this data set, income groups are determined as income quartiles based on the median income of ACS block groups; higher quartiles represent higher income levels. Education groups are determined as education quartiles based on the college share within each ACS block group; higher quartiles represent higher education levels. Similarly, race/ethnicity is grouped as Blacks, Hispanics, Whites and Asians using the information obtained from each ACS block group.
The corresponding DEX data for the social interaction of different income groups is given in Figure 1, where the median values across US states are provided. The top panel represents the raw data (that are subject to daily seasonality), where social interaction increases with the level of income before the declaration of National Emergency on 13 March 2020. Social interaction is about the same across income groups during April, and it starts increasing with income again in late May and June due to the openings. It is implied that social distancing has been experienced more by higher‐income individuals, although this observation is mostly due to these groups having relatively higher levels of social interaction (with respect to other groups) before the declaration of National Emergency. The bottom panel of Figure 1 represents seven‐day moving averages with equal average values in January 2020 to have a smoother picture, where the difference across demographic groups regarding their social interaction is visually observed better with respect to their normal interaction before the declaration of National Emergency.
FIGURE 1.
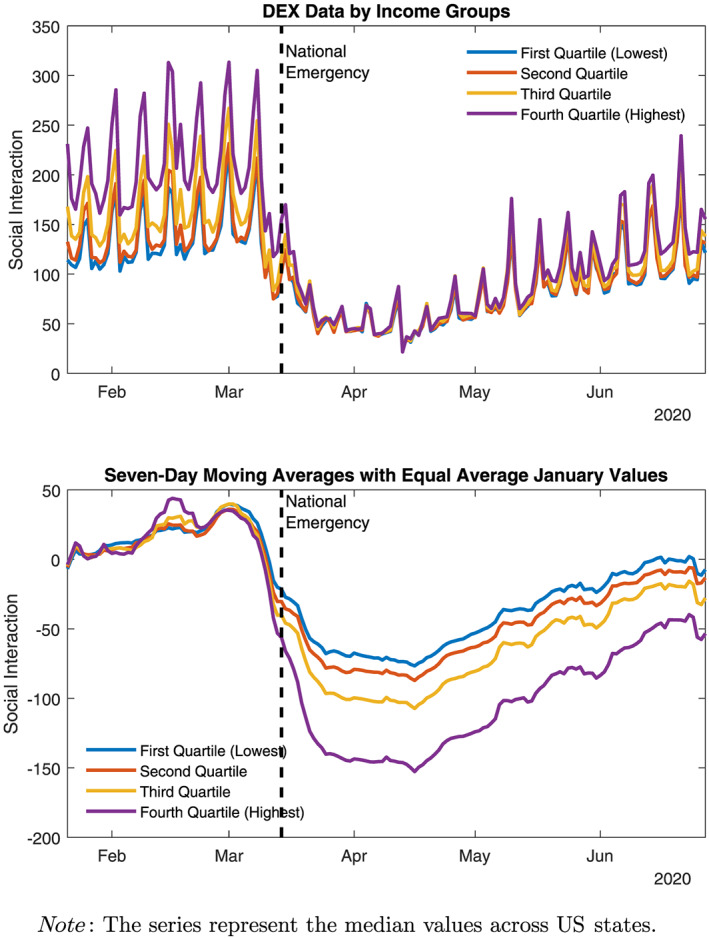
DEX data by income groups
Similar patterns of DEX data can be observed in Figure 2 (for the median US state) by education groups, where there is evidence for higher‐education people experiencing higher social distancing, again due to their higher initial social interaction before the declaration of National Emergency. Similarly, Figure 3 represents social interaction by race/ethnicity (for the median US state), where Asian people have experienced more social distancing, again due to their higher initial social interaction.
FIGURE 2.
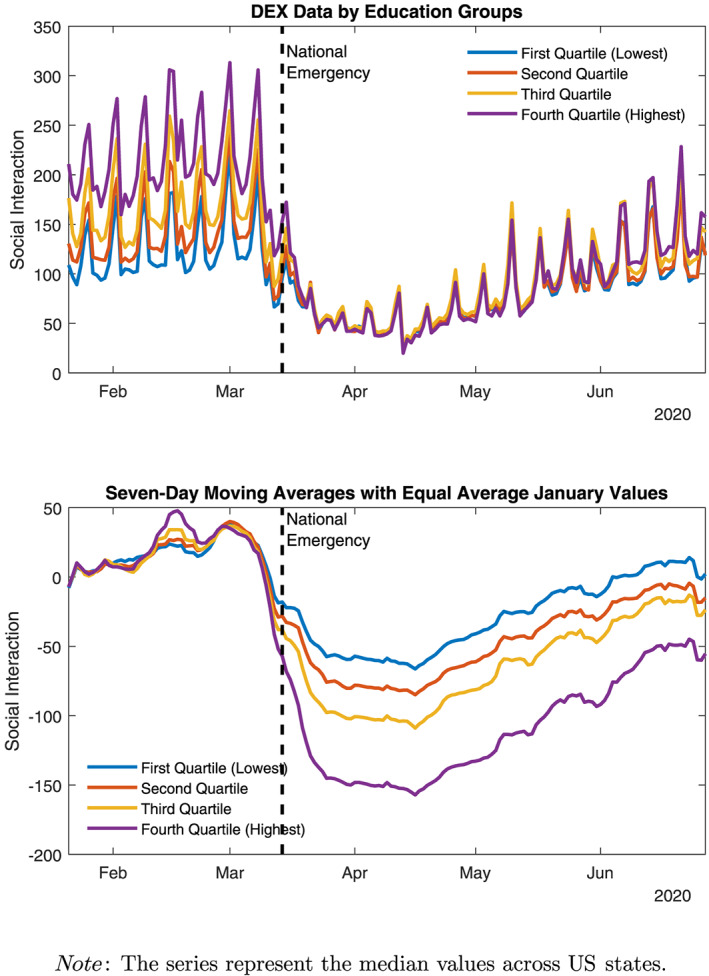
DEX data by education groups
FIGURE 3.
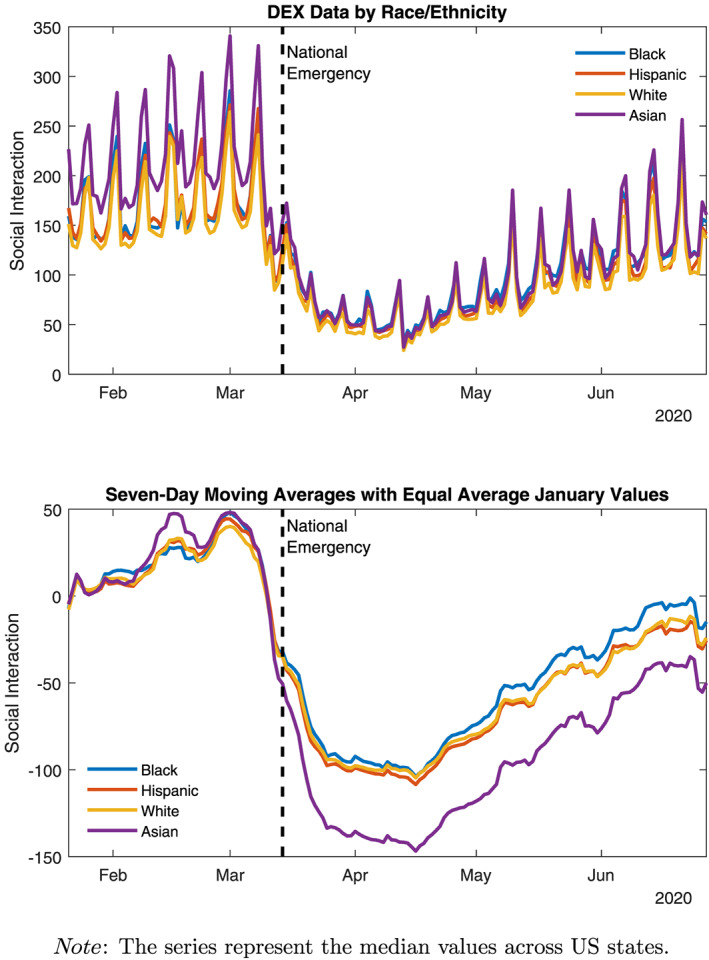
DEX data by race/ethnicity
Overall, there is evidence for heterogenous changes in social interaction across demographic groups according to Figures 1–3. Nevertheless, these descriptive statistics for the median US state do not control for any state‐specific development such as state‐level policies that may change over time or any group‐state characteristic such as higher‐income people in certain states socially interacting more in general. Accordingly, a formal investigation is achieved as described in the next section by using a panel regression analysis, where these potential factors are controlled for.
3. ESTIMATION METHODOLOGY
The formal investigation is achieved through separate estimations for the demographic categories of income, education, and race/ethnicity. The objective of these estimations is to capture how different demographic groups have achieved social distancing after controlling for factors that are state‐time specific (e.g., state‐level policies on certain days) or group‐state specific (e.g., higher‐income individuals in certain states socially interacting differently from other higher‐income individuals in other states).
In technical terms, the social interaction for each demographic group in the US is captured by group‐time fixed effects in the following regression:
| (1) |
where I gst is the log average exposure of devices for group g in state s at time t, φ gt represents group‐time fixed effects, κ st represents state‐time fixed effects, ϕ gs represents group‐state fixed effects, and ε gst represents residuals. Based on three demographic categories in the DEX data, groups correspond to income quartiles, education quartiles or races/ethnicity.
In this regression, group‐time fixed effects φ gt are the main focus of investigation (to be further used in a secondary analysis, below), since we would like to know whether social interaction has evolved over time in a different way across demographic groups. State‐time fixed effects κ st control for any state‐specific change over time, such as the spread of COVID‐19 or the corresponding state‐level policy reaction. These state‐time fixed effects κ st also control for the number of devices that can be different across states over time in the DEX data. Finally, group‐state fixed effects ϕ gs control for any group‐specific characteristic within a state that is constant over time, such as higher‐income individuals in a certain US state socially interacting differently from higher‐income individuals in another US state.
Once group‐time fixed effects φ gt are estimated to capture the social interaction for each demographic group within the US over time, in a secondary regression, they are further used to investigate whether social interaction has evolved over time in different ways across demographic groups. The corresponding regression specification is given by the following difference‐in‐difference design:
| (2) |
where takes a value of zero (one) at time t before (after) the declaration of National Emergency on 13 March 2020 in the US by the White House, and θ g is the corresponding group‐specific coefficient. Time fixed effects δ t control for developments over time (that are common across all groups), whereas group fixed effects γ g control for factors that are group specific (that are constant over time).
In this specification, when income groups are compared, the highest income group is excluded in so that the estimated coefficients of θ g represent how other income groups have interacted socially with respect to the highest‐income quartile after the declaration of National Emergency. Similarly, when education groups (races/ethnicities) are compared, the highest education group (Asian) is excluded in so that the estimated coefficients of θ g represent how other education groups (races/ethnicities) have interactedsocially with respect to the highest‐education quartile (Asian) after the declaration of National Emergency. Within this context, the very same estimated coefficients of θ g can also be considered as the relative social distancing measures of the highest‐income group, highest‐education group or Asians with respect to other groups.
4. ESTIMATION RESULTS
The estimations are achieved separately for income groups, education groups and races/ethnicity. The corresponding results are given in the following subsections.
4.1. Income groups
The estimated group‐time fixed effects φ gt within the US based on Equation (1) are represented in Figure 4 when income groups are considered. As is evident at the top panel of Figure 4, after controlling for state‐time and group‐state fixed effects, in relative terms, social distancing experienced by higher‐income groups has increased after the declaration of National Emergency. In order to have a smoother visualization, the same results are represented as seven‐day moving averages at the bottom panel of Figure 4, where group‐specific averages are equalized for observations in January 2020. Once again, higher‐income groups have experienced more social distancing with respect to lower‐income groups.
FIGURE 4.
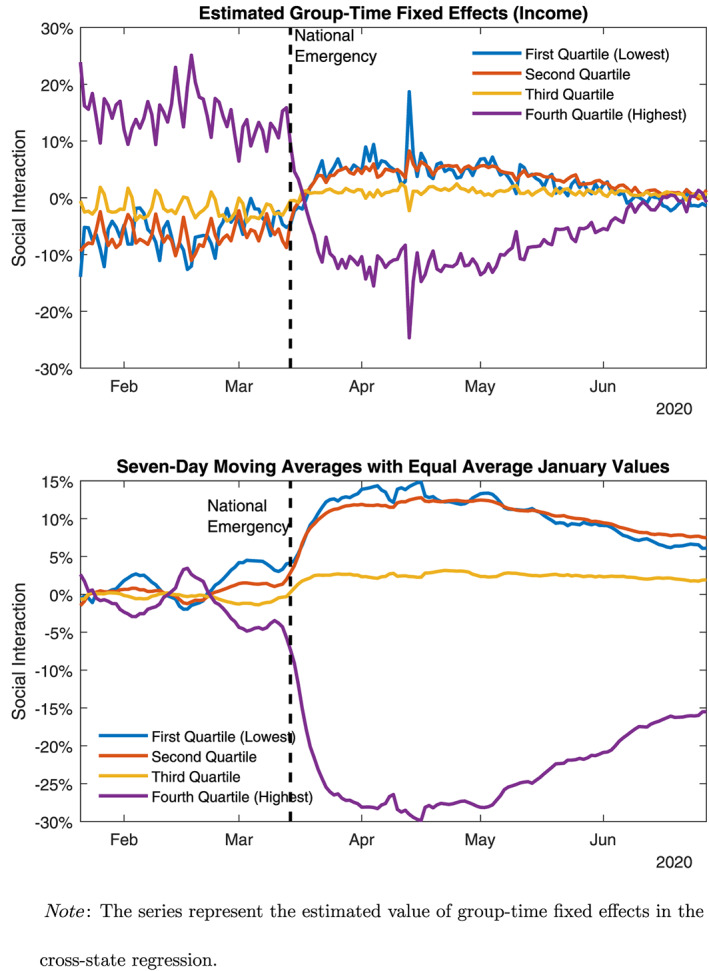
Estimated social interaction by income groups
When the observed patterns of income groups at the top panel of Figure 4 are further used in Equation (2) in a secondary regression, the estimation results are given in Table 1. As is evident, the social distancing experienced by the highest‐income group after the declaration of National Emergency is about 31% and 32% more than the first and the second income quartiles, respectively, and 25% more than the third income quartile. These results are robust to the consideration of time fixed effects and group‐specific fixed effects due to the difference‐in‐difference design of Equation (2).
TABLE 1.
Social interaction by income groups
| Social interaction compared to highest income quartile after the declaration of National Emergency for COVID‐19 | |
|---|---|
| (First Income Quartile) x (National Emergency) | 0.309*** |
| (0.00104) | |
| (Second Income Quartile) x (National Emergency) | 0.319*** |
| (0.00104) | |
| (Third Income Quartile) x (National Emergency) | 0.248*** |
| (0.00104) | |
| Day Fixed Effects | YES |
| Group‐Specific Fixed Effects | YES |
| Sample Size | 32436 |
| R‐Squared | 0.793 |
| Adjusted R‐Squared | 0.792 |
Notes: *** represents significance at the 0.1% level. Standard errors are in parentheses. The dependent variable represents the estimated group‐time fixed effects in the cross‐state regression. The coefficients represent the social interaction of a specific income group after the decleration of National Emergency on 13 March 2020 for COVID‐19 with respect to the highest‐income quartile.
With respect to the literature, these results are consistent with studies such as by Alexander and Karger (2020) who have shown that residents of high‐income counties began reducing their movement well before stay‐at‐home orders went into effect or studies such as by Lou and Shen (2020) who have shown that social‐distance‐policy effects on the lower‐income group is smaller than that of the upper‐income group or studies such as by Ruiz‐Euler, Privitera, Giuffrida, Lake, and Zara (2020) who have shown that the decline in human mobility during COVID‐19 happened at different speeds for high versus low income groups within most US cities.
4.2. Education groups
The estimated group‐time fixed effects φ gt within the US based on Equation (1) are represented in Figure 5 when education groups are considered. As is evident at the top panel of Figure 5, after controlling for state‐time and group‐state fixed effects, social distancing has been experienced more by higher‐educated people after the declaration of National Emergency. The corresponding smoother visualization at the bottom panel of Figure 5 supports these results as well.
FIGURE 5.
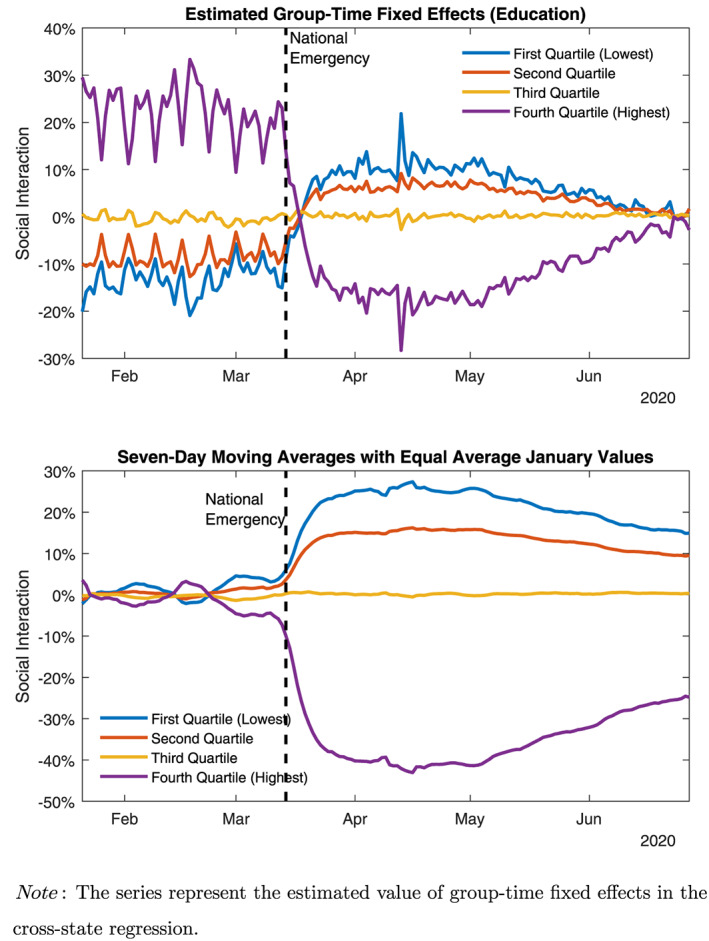
Estimated social interaction by education groups
When the observed patterns of education groups at the top panel of Figure 5 are further used in Equation (2) in a secondary regression, the estimation results are given in Table 2. As is evident, the social distancing experienced by the highest‐education group after the declaration of National Emergency is about 53% more than the first education quartile, 46% more than the second education quartile, and 34% more than the third education quartile. Once again, these results are robust to the consideration of time fixed effects and group‐specific fixed effects due to the difference‐in‐difference design of Equation (2).
TABLE 2.
Social interaction by education groups
| Social interaction compared to highest education quartile after the declaration of National Emergency for COVID‐19 | |
|---|---|
| (First Education Quartile) x (National Emergency) | 0.533*** |
| (0.00135) | |
| (Second Education Quartile) x (National Emergency) | 0.461*** |
| (0.00135) | |
| (Third Education Quartile) x (National Emergency) | 0.340*** |
| (0.00135) | |
| Day Fixed Effects | YES |
| Group‐Specific Fixed Effects | YES |
| Sample Size | 32436 |
| R‐Squared | 0.850 |
| Adjusted R‐Squared | 0.850 |
Notes: *** represents significance at the 0.1% level. Standard errors are in parentheses. The dependent variable represents the estimated group‐time fixed effects in the cross‐state regression. The coefficients represent the social interaction of a specific education group after the decleration of National Emergency on 13 March 2020 for COVID‐19 with respect to the higest‐education quartile.
With respect to the literature, these results may shed light on the evidence provided in studies such as by Bonacini, Gallo, and Scicchitano (2020) who have shown that working from home (due to social distancing) increases income inequality among employees, potentially due to the heterogeneity across education levels. This is also consistent with the idea that lower‐income people have to continue working outside during COVID‐19, as they have experienced higher unemployment rates as shown in studies such as by Cho and Winters (2020).
4.3. Races/ethnicity
The estimated group‐time fixed effects φ gt within the US based on Equation (1) are represented in Figure 6 when races/ethnicity are considered. As is evident at the top panel of Figure 6, after controlling for state‐time and group‐state fixed effects, social distancing experienced by Blacks and Hispanics has been less than that by Asians during April and May. In order to have a smoother visualization, the same results are represented as seven‐day moving averages at the bottom panel of Figure 6.
FIGURE 6.
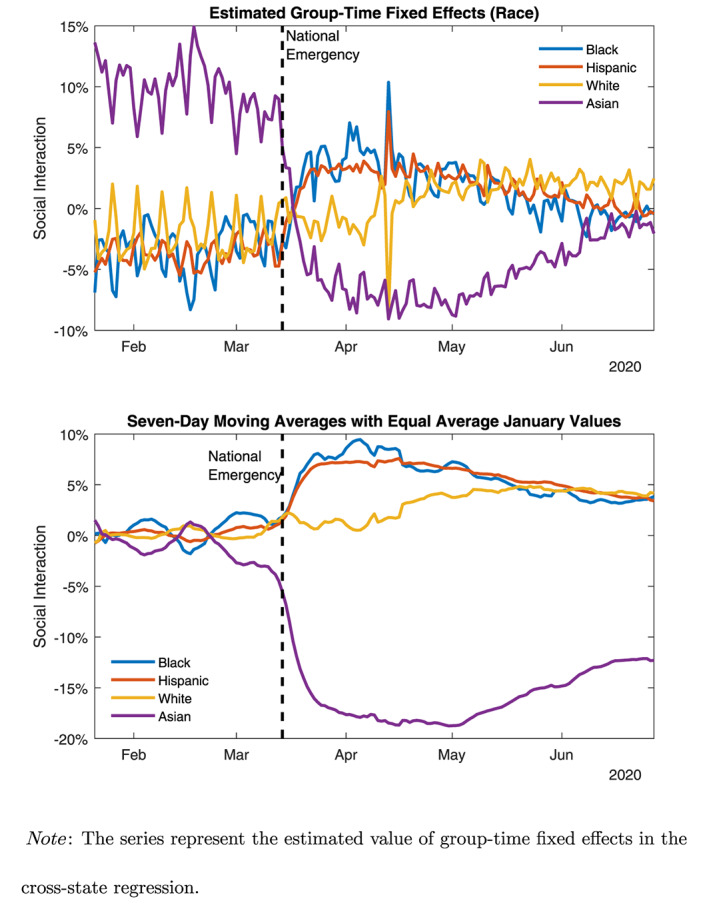
Estimated social interaction by race/ethnicity
When the observed patterns of income groups at the top panel of Figure 6 are further used in Equation (2) in a secondary regression, the estimation results are given in Table 3. As is evident, the social distancing experienced by Asians after the declaration of National Emergency is about 20% more than Blacks and Hispanics, and 18% more than Whites. These results are again robust to the consideration of time fixed effects and group‐specific fixed effects due to the difference‐in‐difference design of Equation (2).
TABLE 3.
Social interaction by race/ethnicity
| Social interaction compared to Asians after the declaration of National Emergency for COVID‐19 | |
|---|---|
| (Black) x (National Emergency) | 0.197*** |
| (0.000752) | |
| (Hispanic) x (National Emergency) | 0.202*** |
| (0.000720) | |
| (White) x (National Emergency) | 0.178*** |
| (0.000720) | |
| Day Fixed Effects | YES |
| Group‐Specific Fixed Effects | YES |
| Sample Size | 28938 |
| R‐Squared | 0.783 |
| Adjusted R‐Squared | 0.781 |
Notes: *** represents significance at the 0.1% level. Standard errors are in parentheses. The dependent variable represents the estimated group‐time fixed effects in the cross‐state regression. The coefficients represent the social interaction of a specific race after the decleration of National Emergency on 13 March 2020 for COVID‐19 with respect to Asians.
With respect to the literature, these results showing that social distancing experienced by Asians is higher than other races/ethnicity is consistent with studies such as by Bartos, Bauer, Cahlíková, and Chytilová (2020) or Xu and Liu (2020) who have shown that exogenously elevating salience of thoughts related to COVID‐19 pandemic magnifies hostility and discrimination against foreigners, especially from Asia.
5. DISCUSSION OF ESTIMATION RESULTS
This section discusses the estimation results by connecting them to the existing literature. Overall, there is evidence for significant differences across demographic groups within the US regarding the social distancing experienced. Important policy implications follow, especially when it is considered that higher‐educated, higher‐income or Asians were able to work at home and maintain employment during COVID‐19 as suggested in studies such as by Bick et al. (2020) or Dingel and Neiman (2020), whereas lower‐educated workers, Blacks or Hispanics were not able to work at home and thus became unemployed as suggested in studies such as by Gupta et al. (2020) or Yasenov (2020). In particular, although higher‐income, higher‐educated or Asians have experienced higher social distancing after the declaration of National Emergency, since social interaction levels are similar across demographic groups after the declaration, redistributive effects of COVID‐19 are implied due to different demographic groups being or not able to work at home. Accordingly, demographic‐group specific policies are required to reduce not only the overall economic impact of COVID‐19 but also the corresponding inequality across demographic groups.
The results also have implications for other economic or social policy responses, since alternative social distancing across demographic groups are reflected as unequal economic consequences across them. For instance, studies such as by Chronopoulos, Lukas, and Wilson (2020) have shown evidence for variations in the level and composition of consumer spending amid COVID‐19 by age, gender and income level, whereas studies such as by Foremny, Sorribas‐Navarro, and Vall Castelló (2020) have shown evidence for substantial deterioration of mental health that is pronounced in groups of the population with less stable income sources. Similarly, studies such as by Ranasinghe, Karunarathna, and Pradeepamali (2020) have shown that the highest COVID‐19 impact has been on the poor whose food security is at the lowest level and then on middle income earners, whereas studies such as by Perugini et al. (2020) have shown that lockdowns due to COVID‐19 are likely to significantly increase inequality and poverty and that the magnitude of the change is larger in more unequal countries. It is implied that demographic‐group specific policies could reduce the inequality across demographic groups due to COVID‐19.
6. CONCLUSION
This paper has analysed whether social distancing experienced by alternative demographic groups in the US has been different amid COVID‐19. The formal investigation has been achieved by using daily state‐level data from the US covering information on the demographic categories of income, education and race/ethnicity.
The results have shown that the social distancing experienced by the highest‐income group after the declaration of National Emergency has been about 31% and 32% more than the first and the second income quartiles, respectively, and 25% more than the third income quartile. The social distancing experienced by the highest‐education group after the declaration of National Emergency has been about 53% more than the first education quartile, 46% more than the second education quartile, and 34% more than the third education quartile. The social distancing experienced by Asians after the declaration of National Emergency has been about 20% more than Blacks and Hispanics, and 18% more than Whites.
Although potential reasons behind alternative social distancing amid COVID‐19 across demographic groups (e.g., necessity of working for lower‐income people or luxury of working at home for higher‐educated people) are not formally investigated in this paper, the results provide important implications for policy makers, such as the potential consideration of demographic‐group‐specific policies.
ACKNOWLEDGEMENTS
The author would like to thank the editor Tomaz Ponce Dentinho, the associate editor Neil Reid and two anonymous referees for their helpful comments and suggestions. The usual disclaimer applies.
Yilmazkuday H. COVID‐19 and unequal social distancing across demographic groups. Reg Sci Policy Pract. 2020;12:1235–1248. 10.1111/rsp3.12329
Footnotes
For example, see studies such as by Aun Lor, Barrett, Ortmann, and Guibert (2016), Coibion, Gorodnichenko, and Weber (2020), Hanspal, Weber, and Wohlfart (2020), Wheaton and Kinsella Thompson (2020), Wright, Sonin, Driscoll, and Wilson (2020) or Zhong et al. (2020) who have shown how different groups in societies have experienced different social distancing.
REFERENCES
- Alexander, D. , & Karger, E. (2020). Do Stay‐at‐Home Orders Cause People to Stay at Home? Effects of Stay‐at‐Home Orders on Consumer Behavior. SSRN Electronic Journal. 10.2139/ssrn.3583625 [DOI] [Google Scholar]
- AunLor, J. C. T. , Barrett, D. H. , Ortmann, L. W. , & Guibert, D. J. H. (2016). Key ethical issues discussed at cdc‐sponsored international, regional meetings to explore cultural perspectives and contexts on pandemic in.uenza preparedness and response. International Journal of Health Policy and Management, 5(11), 653–662. [DOI] [PMC free article] [PubMed] [Google Scholar]
- Austrian, K. , Pinchoff, J. , Tidwell, J. B. , White, C. , Abuya, T. , Kangwana, B. , … Ngo, T. D. (2020). COVID‐19 Related Knowledge, Attitudes, Practices and Needs of Households in Informal Settlements in Nairobi, Kenya. SSRN Electronic Journal. 10.2139/ssrn.3576785 [DOI] [Google Scholar]
- Baker, S. R. , Farrokhnia, R. A. , Meyer, S. , Pagel, M. , & Yannelis, C. (2020). How Does Household Spending Respond to an Epidemic? Consumption During the 2020 COVID‐19 Pandemic. SSRN Electronic Journal. 10.2139/ssrn.3565521 [DOI] [Google Scholar]
- Bartos, V. , Bauer, M. , Cahlikova, J. , & Chytilová, J. (2020). COVID‐19 Crisis Fuels Hostility against Foreigners. SSRN Electronic Journal. 10.2139/ssrn.3593411 [DOI] [PMC free article] [PubMed] [Google Scholar]
- Bick, A. , Blandin, A. , & Mertens, K. (2020). Work from Home After the COVID‐19 Outbreak. Federal Reserve Bank of Dallas, Working Papers, 2020(2017). 10.24149/wp2017 [DOI] [Google Scholar]
- Bonaccorsi, G. , Pierri, F. , Cinelli, M. , Flori, A. , Galeazzi, A. , Porcelli, F. , … Pammolli, F. (2020). Economic and social consequences of human mobility restrictions under COVID‐19. Proceedings of the National Academy of Sciences, 117(27), 15530–15535. [DOI] [PMC free article] [PubMed] [Google Scholar]
- Bonacini, L. , Gallo, G. , & Scicchitano, S. (2020). All that Glitters Is not Gold. Effects of Working from Home on Income Inequality at the Time of COVID‐19. SSRN Electronic Journal. 10.2139/ssrn.3597996 [DOI] [Google Scholar]
- Borjas, G. J. (2020). Demographic determinants of testing incidence and COVID‐19 infections in New York City neighborhoods. (Working Paper 26952): National Bureau of Economic Research.
- Chan, J. F.‐W. , Yuan, S. , Kok, K.‐H. , To, K. K.‐W. , Chu, H. , Yang, J. , … Yuen, K.‐Y. (2020). A familial cluster of pneumonia associated with the 2019 novel coronavirus indicating person‐to‐person transmission: A study of a family cluster. The Lancet, 395(10223), 514–523. [DOI] [PMC free article] [PubMed] [Google Scholar]
- Cho, S. J. , & Winters, J. V. (2020). The distributional impacts of early employment losses from COVID‐19. URL: SSRN 3602755.
- Chronopoulos, D. K. , Lukas, M. , & Wilson, J. O. (2020). Consumer spending responses to the COVID‐19 pandemic: An assessment of Great Britain. URL: SSRN 3586723.
- Coibion, O. , Gorodnichenko, Y. , & Weber, M. (2020). The cost of the COVID‐19 crisis: Lockdowns, macroeconomic expectations, and consumer spending. (Working Paper 27141): National Bureau of Economic Research.
- Couture, V. , Dingel, J. I. , Green, A. , Handbury, J. , & Kevin, W. (2020). Device exposure index based on PlaceIQ data. Retrieved from https://github.com/COVIDExposureIndices
- Dingel, J. I. , & Neiman, B. (2020). How many jobs can be done at home? (Working Paper 26948): National Bureau of Economic Research.
- Dowd, J. B. , Andriano, L. , Brazel, D. M. , Rotondi, V. , Block, P. , Ding, X. , … Mills, M. C. (2020). Demographic science aids in understanding the spread and fatality rates of COVID‐19. Proceedings of the National Academy of Sciences, 117(18), 9696–9698. 10.1073/pnas.2004911117 [DOI] [PMC free article] [PubMed] [Google Scholar]
- Foremny, D. , Sorribas‐Navarro, P. , & Vall Castelló, J. (2020). Living at the peak: Health and public finance during the Covid‐19 pandemic. URL: SSRN 3578483.
- Gupta, S. , Montenovo, L. , Nguyen, T. D. , Rojas, F. L. , Schmutte, I. M. , Simon, K. I. ,… Wing, C. (2020). Effects of social distancing policy on labor market outcomes. (Working Paper 27280): National Bureau of Economic Research. Retrieved from http://www.nber.org/papers/w27280 [DOI] [PMC free article] [PubMed]
- Hanspal, T. , Weber, A. , & Wohlfart, J. (2020). Income and Wealth Shocks and Expectations during the COVID‐19 Pandemic. SSRN Electronic Journal. 10.2139/ssrn.3578472 [DOI] [Google Scholar]
- Lou, J. , & Shen, X. (2020). Are stay‐at‐home orders more difficult to follow for low‐income groups? URL: SSRN 3585376. [DOI] [PMC free article] [PubMed]
- Perugini, C. , & Vladisavljevic, M. (2020). Social stability challenged: Pandemics, inequality and policy responses. IZA Discussion Paper No. 13249. Retrieved from https://ssrn.com/abstract=3602425 [DOI] [PMC free article] [PubMed]
- Ranasinghe, R. , Karunarathna, C. , & Pradeepamali, J. (2020). After corona (COVID‐19) impacts on global poverty and recovery of tourism based service economies: An appraisal. URL: SSRN 3591259.
- Ruiz‐Euler, A. , Privitera, F. , Giuffrida, D. , Lake, B. , & Zara, I. (2020). Mobility patterns and income distribution in times of crisis: US urban centers during the COVID‐19 pandemic. URL: SSRN 3572324.
- Srichan, P. , Apidechkul, T. , Tamornpark, R. , Yeemard, F. , Khunthason, S. , Kitchanapaiboon, S. , … Upala, P. (2020). Knowledge, attitude and preparedness to respond to the 2019 novel coronavirus (COVID‐19) among the bordered population of Northern Thailand in the early period of the outbreak: A cross‐sectional study. URL: SSRN 3546046. [DOI] [PubMed]
- Wheaton, W. C. , & Kinsella Thompson, A. (2020). The geography of COVID‐19 growth in the US: Counties and metropolitan areas. URL: SSRN 3570540.
- Wright, A. L. , Sonin, K. , Driscoll, J. , & Wilson, J. (2020). Poverty and economic dislocation reduce compliance with COVID‐19 shelter‐in‐place protocols. (Working Paper 2020‐40): University of Chicago, Becker Friedman Institute for Economics. [DOI] [PMC free article] [PubMed]
- Xu, C. , & Liu, M. Y. (2020). Social cost with no political gain: The “Chinese Virus” Effect. 10.31234/osf.io/j4t2r [DOI]
- Yasenov, V. I. (2020). Who can work from home? IZA Discussion Paper No. 13197, Retrieved from https://ssrn.com/abstract=3590895
- Zhong, B.‐L. , Luo, W. , Li, H.‐M. , Zhang, Q.‐Q. , Liu, X.‐G. , Li, W.‐T. , & Li, Y. (2020). Knowledge, attitudes, and practices towards COVID‐19 among Chinese residents during the rapid rise period of the COVID‐19 outbreak: a quick online cross‐sectional survey. International Journal of Biological Sciences, 16(10), 1745–1752. 10.7150/ijbs.45221 [DOI] [PMC free article] [PubMed] [Google Scholar]