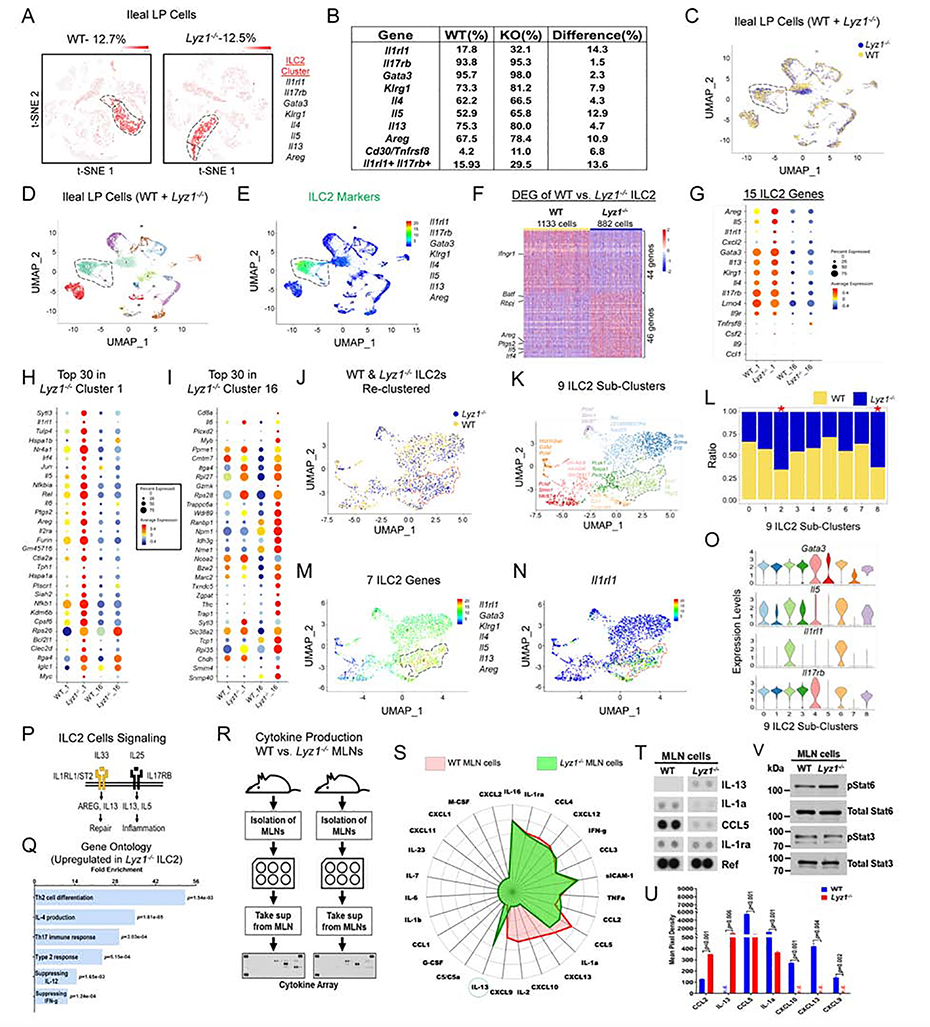
Figure 3. scRNAseq reveals immune-activated ILC2 in Lyz1−/− ileal lamina propria.
(A) Unsupervised separate clustering (t-SNE plot) of LP cells identified ILC2 populations in WT mice (total of 1,017 cells, 12.7% of all LP cells) and in Lyz1−/− mice (844 cells, 12.5% of all LP cells). (B) Table summarizing the percentage of ILC2 cells that expressed indicated genes in WT and Lyz1−/− LP. (C-D) Uniform manifold approximation and projection (UMAP) of combined clustering of WT and Lyz1−/− LP cells (WT, 8767 cells; Lyz1−/−, 7492 cells) resulted in 23 distinct clusters. (E) ILC2s (clusters 1 &16) identified based on the indicated set of signature genes. (F) 90 differentially expressed genes between WT and Lyz1−/− ILC2 population in cluster 1. (G-I) Representative differentially expressed genes in WT and Lyz1−/− ILC2s. Dot size reflects the percentage of cells in the cluster that express the gene; color indicates the average expression of the gene. (G) Differential expression of 15 ILC2 signature genes by WT and Lyz1−/− ILC2s. (H) Top 30 genes increased in Lyz1−/− cluster 1. (I) Top 30 genes increased in Lyz1−/− cluster 16. (J-O) All WT and Lyz1−/− ILC2 cells (a total of 2281 cells) were further partitioned into 9 sub-clusters colored by genotype (J) or by cluster (K), with top 3 differentially expressed genes indicated next to each sub-cluster. (L) Bar graph with the relative distribution of WT and Lyz1−/− ILC2 cells in each sub-cluster. The Lyz1−/− ILC2-dominated sub-clusters 2 & 8 were denoted by an asterisk. (M) UMAP projection with 7 indicated signature genes elevated in sub-cluster 2 of Lyz1−/− ILC2. (N) ILC2 UMAP projection with highlighetd relative expression of Il1rl1 mRNA. (O) Violin plots of indicated gene expression across 9 ILC2 sub-clusters. (P) Schematic illustration of ILC2 signaling through IL1RL1 and IL17RB receptors in tissue repair and inflammation. (Q) Gene ontology (GO) categories (sorted by P value) with top pathways overrepresented in Lyz1−/− ILC2 compared to WT ILC2 in cluster 1. (R-S) Experimental design and radar plot with differential cytokine/chemokine secretion by WT (red) and Lyz1−/− (green) MLN cells at steady state. IL-13 highlighted by a circle. (T) Representative dot blots showing elevated IL-13 production by Lyz1−/− MLN cells. (U) Quantification of cytokine/chemokine production from two independent experiments. The bar graph displays mean ± SEM. (V) Western blots for pStat6 and pStat3 using MLN cell lysates from the experiment shown in S-U. See also Figure S3.

