

Significance Statement
Donor-specific anti-HLA antibodies (HLA-DSAs) are often not detectable in serum of kidney allograft recipients whose biopsies display histology of antibody-mediated rejection (ABMR), which creates uncertainty in clinical decision making. The authors show that ABMR histology associates with a distinct transcriptional profile that is independent of the presence of HLA-DSAs, although the presence of HLA-DSAs is also an independent risk factor for graft failure after ABMR histology. However, molecular assessment of allograft biopsy specimens does not elucidate the underlying cause of ABMR histology, and these findings indicate that therapeutic decisions should not be based solely on the histologic and molecular presentation. Future studies should work toward identifying and targeting the underlying stimulus of ABMR histology.
Keywords: antibody-mediated rejection, kidney transplantation, transcriptomics, donor-specific antibodies, natural killer cells
Visual Abstract

Abstract
Background
Circulating donor-specific anti-HLA antibodies (HLA-DSAs) are often absent in serum of kidney allograft recipients whose biopsy specimens demonstrate histology of antibody-mediated rejection (ABMR). It is unclear whether cases involving ABMR histology without detectable HLA-DSAs represent a distinct clinical and molecular phenotype.
Methods
In this multicenter cohort study, we integrated allograft microarray analysis with extensive clinical and histologic phenotyping from 224 kidney transplant recipients between 2011 and 2017. We used the term ABMR histology for biopsy specimens that fulfill the first two Banff 2017 criteria for ABMR, irrespective of HLA-DSA status.
Results
Of 224 biopsy specimens, 56 had ABMR histology; 26 of these (46.4%) lacked detectable serum HLA-DSAs. Biopsy specimens with ABMR histology showed overexpression of transcripts mostly related to IFNγ-induced pathways and activation of natural killer cells and endothelial cells. HLA-DSA–positive and HLA-DSA–negative biopsy specimens with ABMR histology displayed similar upregulation of pathways and enrichment of infiltrating leukocytes. Transcriptional heterogeneity observed in biopsy specimens with ABMR histology was not associated with HLA-DSA status but was caused by concomitant T cell–mediated rejection. Compared with cases lacking ABMR histology, those with ABMR histology and HLA-DSA had higher allograft failure risk (hazard ratio [HR], 7.24; 95% confidence interval [95% CI], 3.04 to 17.20) than cases without HLA-DSA (HR, 2.33; 95% CI, 0.85 to 6.33), despite the absence of transcriptional differences.
Conclusions
ABMR histology corresponds to a robust intragraft transcriptional signature, irrespective of HLA-DSA status. Outcome after ABMR histology is not solely determined by the histomolecular presentation but is predicted by the underlying etiologic factor. It is important to consider this heterogeneity in further research and in treatment decisions for patients with ABMR histology.
Although the short-term outcome after kidney transplantation has significantly improved in the past decades, long-term allograft survival has not increased to a similar extent.1,2 Currently available immunosuppressive agents are able to prevent and treat T cell–mediated rejection (TCMR), but are less potent for antibody-mediated rejection (ABMR), which has now become a prominent cause of late graft failure.3–6
Historically, the Banff consortium defined ABMR based on histologic criteria combined with serologic evidence of donor-specific anti-human leukocyte antigen (HLA) antibodies (HLA-DSAs).7 However, despite increasing sensitivity of antibody detection assays, a significant proportion of patients with the same histologic picture of ABMR (hereafter referred to as ABMRh), do not have detectable circulating HLA-DSA.8,9
In the 2017 Banff revision, C4d deposition in peritubular capillaries, circulating non-HLA antibodies, and intrarenal ABMR-associated transcripts were added as surrogate third criteria.10 However, further validation of this adaptation is warranted. First, although C4d deposition is associated with HLA-DSA, we recently showed that C4d deposition does not associate with outcome in cases with HLA-DSA–negative ABMRh, which was similar to outcome of a control group without ABMRh.8,11,12 Second, non-HLA antibodies constitute a broad range of autoantibodies with high interpatient variability, and assessment of non-HLA antibodies is complicated by uncertainty about mean fluorescence intensity cutoff values.13–15 Third, currently reported molecular classifiers are based on ABMR-associated transcripts, but validation on different sequencing platforms and in independent cohorts is lacking. Finally, recent evidence indicates that microvascular inflammation (MVI) on graft biopsy samples is not always triggered by antibodies, but instead sometimes results from direct activation of natural killer (NK) cells due to missing-self recognition, suggesting alternative possible explanations.16
In this multicenter study, we aimed to elucidate whether the transcriptional profile of biopsies with HLA-DSA–negative ABMRh can indicate an undetected humoral etiology, or whether HLA-DSA–negative ABMRh should be considered as a distinct histomolecular entity. For this purpose, we investigated the transcriptome of 224 prospectively collected kidney allograft biopsy specimens.
Methods
Population and Data Collection
A total of 224 renal allograft biopsy samples from 224 single kidney allograft recipients were collected in four European transplant centers between June 2011 and March 2017 (University Hospitals Leuven, Leuven, Belgium; Hannover Medical School, Hanover, Germany; University Hospital Limoges, Limoges, France; and Necker Hospital, Paris, France) in the context of the BIOMArkers of renal Graft INjuries (BIOMARGIN) study (www.biomargin.eu; clinicaltrials.gov number NCT02832661), and the Reclassification using OmiCs integration in KidnEy Transplantation (ROCKET) study. All transplantations were performed with negative complement-dependent cytotoxicity crossmatches. In these four clinical centers, protocol biopsies were performed at 3, 12, and sometimes at 24 months after transplantation, according to local center practice, in addition to the indication biopsies. Institutional review boards and national regulatory agencies (when required) approved the study protocol at each clinical center. Each patient contributed one biopsy specimen. Independent validation was performed on data of computer-assisted analysis of graft inflammation in 47 biopsy specimens collected at Edouard Herriot Hospital and Jules Courmont Hospital (Lyon, France), as recently reported by Sicard et al.17 The microarray gene expression data from an independent cohort originally described by Sellarés et al.,18 publicly available in the Gene Expression Omnibus of the National Institutes of Health (GSE36059; http://www.ncbi.nlm.nih.gov/geo/), was used as a second independent validation set.
Clinicopathologic Assessment
Histologic lesions were scored according to the Banff 2017 criteria by a local expert pathologist in each participating center.10 The term “ABMRh” was used for biopsy specimens that fulfilled the first two (histologic) Banff criteria for ABMR by combining Banff scores for glomerulitis, peritubular capillaritis, arteritis, thrombotic microangiopathy, and C4d deposition. As per Banff 2017 guidelines, GN was considered as an exclusion criterion for ABMRh, as well as peritubular capillaritis without glomerulitis in the presence of borderline rejection, TCMR, or polyomavirus-associated nephropathy. For diagnosis of borderline rejection, interstitial inflammation (i>0) was required in the presence of tubulitis. HLA-DSAs after transplantation were determined per local center practice. HLA-DSA positivity was defined as detectable donor-specific serum anti-HLA antibodies with a mean fluorescence intensity value of >500 at the moment of biopsy or any time before. To delineate a strict definition of HLA-DSA–negative ABMRh, patients with resolved HLA-DSA at time of the biopsy, but with previously detectable HLA-DSA, were allocated to the HLA-DSA–positive group. In the external microarray cohort from Edmonton (GSE36059), biopsy specimens determined to be mixed rejection, ABMR, or possible ABMR in the original study were considered as ABMRh. Data on patient HLA-DSA status were not available in the public data set but were provided by the corresponding author. For the external computerized imaging data, details were published previously.16,17 Briefly, double stainings with anti-CD34 (endothelial cells) and one respective antibody among anti-CD3 (T cells), anti-CD20 (B cells), anti-CD66b (granulocytes), anti-CD68 (macrophages), and anti-CD56 (NK cells) were performed by immunochemistry on paraffin-embedded sections using an anti-human CD34 (clone QBEnd10, 1:200; Dako, Les Ulis, France) and anti-human CD3 (clone SK7, 1:150; Becton Dickinson, Le Pont de Claix, France), anti-human CD20 (clone L26, 1:400; Dako), anti-CD66b (clone G10F5, 1:300; Becton Dickinson), anti-human CD68 (clone PGM1, 1:100; Dako), and anti-human CD56 (clone CD564, 1:10; produced by Novocastra and distributed by Leica Microsystemes SAS, Nanterre, France), respectively. Computerized quantitative analyses were conducted to quantify the density of each immune cell type in the microcirculation and tubulointerstitial compartment of the renal allograft.17
Biopsy Sample Collection and Transcriptomic Analysis
Two needle cores were taken at each kidney allograft biopsy. One was used for histology and at least half of the other was immediately stored in Allprotect Tissue Reagent (Qiagen Benelux BV, Venlo, The Netherlands). The Allprotect tubes were stored at 4°C (minimum 24 hours to a maximum of 72 hours), and then stored at −20°C until RNA extraction. Total RNA was isolated from the kidney allograft biopsy specimens using the Allprep DNA/RNA/miRNA Universal Kit (Qiagen Benelux BV) on a QIAcube instrument (Qiagen Benelux BV). The quantity (absorbance at 260 nm) and purity (ratio of the absorbance at 230, 260, and 280 nm) of the isolated RNA were measured using the NanoDrop ND-1000 spectrophotometer (Thermo Fisher Scientific/Life Technologies Europe BV, Ghent, Belgium). RNA integrity was evaluated with the Eukaryote nano/pico RNA Kit (Agilent Technologies Belgium NV, Diegem, Belgium) on the Bioanalyzer 2100 instrument (Agilent Technologies Belgium NV). The extracted RNA was subsequently stored at −80°C until microarray analysis. The arrays were washed and stained with streptavidin-phycoerythrin on an automated Fluidics Station (Affymetrix, High Wycombe, United Kingdom) and scanned on the GeneChip Scanner 3000 7G System (Affymetrix). Total RNA extracted from the biopsy samples was first amplified and biotinylated to complementary RNA (cRNA) using the GeneChip 3′ IVT PLUS Reagent Kit (Affymetrix). The quality of labeled and fragmented cRNA was assessed with the Agilent 2100 Bioanalyzer. Fragmented cRNA was hybridized to the Affymetrix GeneChip Human Genome U133 Plus 2.0 Arrays (Affymetrix), which comprised 54,675 probe sets covering the whole genome. The arrays were washed and stained with streptavidin-phycoerythrin on an automated Fluidics Station (Affymetrix) and scanned on the GeneChip Scanner 3000 7G System (Affymetrix). The resulting image files (.dat files) were generated using the GeneChip Command Console Software (AGCC), and intensity values for each probe cell (.cel file) were calculated. The microarray data were handled in accordance with the Minimum Information About a Microarray Experiment guidelines. The microarray gene expression data are available at the Gene Expression Omnibus database under the accession number GSE147089.
Data Analyses
The microarray data were analyzed using TAC software (version 4.0; Thermo Fisher Scientific, Carlsbad, CA) and Bioconductor tools in R (version 3.5.3; www.rstudio.com).19 The robust multichip average method was performed on the raw expression data (.cel files) to obtain a log2 expression value for each probe set, and batch effect correction was performed for timing of the microarray analysis by using the LIMMA package.20,21 For comparative analysis, the LIMMA package was used to identify the gene probe sets that showed significant differential expression between the studied groups, based on moderated t-statistics with Benjamini–Hochberg false discovery rate (FDR) correction for multiple testing.21 FDR-adjusted P values <0.01 were considered significant. The Bio Functional Analysis tool in the Ingenuity Pathway Analysis program (Ingenuity Systems) was used to identify the biologic functions associated with the data sets of significantly differentially expressed gene probe sets. Deconvolution analysis was performed by the online CIBERSORT tool (https://cibersort.stanford.edu/).22 Briefly, by application of the LM22 gene signature matrix, the relative infiltration pattern of 11 major leukocyte types, corresponding to 22 leukocyte subtypes, within each biopsy specimen was calculated. To estimate absolute infiltration within a specific biopsy specimen, calculated relative leukocyte fractions were multiplied by the ratio of CD45 expression within the biopsy specimen, a pan-leukocyte marker, to the mean CD45 expression in a group of normal biopsy specimens, resulting in a dimensionless parameter.23 Dimensionality reduction of expression data were performed using t-distributed stochastic neighbor embedding (t-SNE).24 A weighted gene coexpression network analysis (WGCNA) was performed to correlate clinical traits with transcriptional heterogeneity within biopsy specimens.25 To construct a topologic overlap matrix, coexpression similarity was defined by biweight midcorrelation with a soft threshold power value of 13, corresponding to a scale‐free topology fitting index of 0.886. Coexpressing gene probe sets were assigned to modules by average linkage hierarchic clustering, with a minimal module size set at 30 gene probe sets with a deepSplit=3. Modules were merged if similarity was >0.75. Module-trait association testing was performed with the application of an FDR correction with a cutoff of 0.05.
For clinicopathologic features, nominal variables were compared using the chi-squared test or Fisher exact test, where appropriate. Comparison of continuous variables was performed by t test/ANOVA or Mann–Whitney U/Kruskal–Wallis test procedure for normal and non-normal distributed data, respectively. Two-sided hypothesis tests with a significance level of <0.05 were considered significant. For the computerized imaging data, principal component analysis with 95% confidence ellipses were used to integrate leukocyte subtype quantities within different renal compartments. We used SAS (version 9.4; SAS Institute Inc., Cary, NC) for statistical analysis and GraphPad Prism (version 8.0.1; GraphPad Software, San Diego, CA) for graphical presentation.
Results
Study Population, Demographics, and Histology
Of the 224 included kidney allograft biopsy specimens, ABMRh was identified in 56 cases. Of these, 30 cases (53.6%) had concomitant or previous documentation of HLA-DSAs (HLA-DSA–positive ABMRh). Importantly, in 11 of 30 cases (36.7%), HLA-DSA had resolved at the time of biopsy. Conversely, in 26 of 56 ABMRh cases (46.4%), no HLA-DSAs were or had ever been detected (HLA-DSA–negative ABMRh). In this group, eight of 26 (30.8%) biopsy specimens showed C4d deposition, thus fulfilling the Banff 2017 criteria for active ABMR.10
Compared with other cases, ABMRh cases were identified more often at indication than at protocol biopsies, with higher proteinuria and lower eGFR at time of the biopsies (Table 1). In addition, delayed graft function had preceded ABMRh biopsies more frequently (34.6% versus 17.4%), and more specifically associated with HLA-DSA–negative than HLA-DSA–positive ABMRh (46.2% versus 24.1%), although this trend did not reach statistical significance (P=0.09). Patients with HLA-DSA–positive ABMRh had received a kidney transplant at a younger age than patients with HLA-DSA–negative ABMRh (43.3 versus 52.5 years, P=0.02). Other recipient and donor characteristics were similar between groups. Treatment of ABMRh occurred more often after indication than protocol biopsies (29/36 versus 7/20, P<0.001), without differences between HLA-DSA groups, although HLA-DSA–positive patients received intravenous Igs more often.
Table 1.
Demographic and clinical characteristics
| Characteristics | No ABMRh (n=168) | ABMRh (n=56) | P Value | HLA-DSA–Negative ABMRh (n=26) | HLA-DSA–Positive ABMRh (n=30) | P Value |
|---|---|---|---|---|---|---|
| Recipient | ||||||
| Age at transplantation (yr), mean (±SD) | 49.2 (±14.9) | 47.6 (±14.6) | 0.48 | 52.5 (±12.7) | 43.3 (±15.0) | 0.02a |
| Gender (female), n (%) | 72/172 (42.9) | 25/56 (44.6) | 0.82 | 12/26 (46.2) | 13/30 (43.3) | 0.83 |
| Ethnicity, n (%) | ||||||
| White | 148/167 (88.6) | 48/56 (85.7) | 0.83 | 23/26 (88.5) | 25/30 (83.3) | 0.80 |
| Black | 6/167 (3.6) | 2/56 (3.6) | 0.83 | 1/26 (3.9) | 1/30 (3.3) | 0.80 |
| Asian | 4/167 (2.4) | 1/56 (1.8) | 0.83 | 0/26 (0.0) | 1/30 (3.3) | 0.80 |
| Other | 9/167 (5.4) | 5/56 (8.9) | 0.83 | 2/26 (7.7) | 3/30 (10.0) | 0.80 |
| Repeat transplantation, n (%) | 28/168 (16.7) | 17/56 (30.4) | 0.03a | 6/26 (23.1) | 11/30 (36.7) | 0.27 |
| Immunologic profile, n (%) | ||||||
| HLA-DSA ever present | 54/168 (32.1) | 30/56 (53.6) | 0.004a | 0/26 (0.0) | 30/30 (100.0) | <0.001a |
| HLA-DSA at biopsy | 19/154 (12.3) | 18/55 (32.7) | <0.001a | 0/26 (0.0) | 18/29 (62.1) | <0.001a |
| HLA-DSA at transplantation | 33/159 (20.8) | 19/55 (34.6) | 0.04a | 0/26 (0.0) | 19/29 (65.5) | <0.001a |
| Anti-HLA antibodies ever present | 87/168 (51.8) | 44/56 (78.6) | <0.001a | 14/26 (53.9) | 30/30 (100.0) | <0.001a |
| Donor | ||||||
| Age (yr), mean (±SD) | 48.7 (±15.9) | 47.6 (±14.4) | 0.65 | 50.8 (±14.8) | 44.7 (±13.6) | 0.12 |
| Gender (female), n (%) | 76/156 (48.7) | 30/53 (56.6) | 0.32 | 12/25 (48.0) | 18/28 (64.3) | 0.23 |
| Living donation, n (%) | 33/168 (19.6) | 8/55 (14.6) | 0.68 | 3/26 (11.5) | 5/29 (17.2) | 0.73 |
| Donation after brain death, n (%) | 119/168 (70.8) | 42/55 (76.4) | 0.31 | 20/26 (76.9) | 22/29 (75.9) | 0.73 |
| Donation after circulatory death, n (%) | 16/168 (9.5) | 5/55 (9.1) | 0.31 | 3/26 (11.5) | 2/29 (6.9) | 0.73 |
| Biopsy | ||||||
| Days post-transplantation, median (IQR) | 370 (93–928) | 361 (40–1059) | 0.25 | 250 (16–708) | 361 (84–1777) | 0.30 |
| Context | ||||||
| Indication, n (%) | 49/168 (29.2) | 36/56 (64.3) | <0.001a | 18/26 (69.2) | 18/30 (60.0) | 0.47 |
| Protocol, n (%) | 119/168 (70.8) | 20/56 (35.7) | <0.001a | 8/26 (30.8) | 12/30 (40.0) | 0.47 |
| eGFR (ml/min per 1.73 m2), mean (±SD) | 45.1 (±20.3) | 30.6 (±20.3) | <0.001a | 25.8 (±16.6) | 34.8 (±21.7) | 0.09 |
| Proteinuria (g/g creatinine), median (IQR) | 0.13 (0.07–0.25) | 0.46 (0.19–1.78) | <0.001a | 0.39 (0.15–1.36) | 0.78 (0.3–2.26) | 0.19 |
| Immunosuppression, n (%) | ||||||
| Cyclosporin | 11/168 (6.6) | 7/56 (12.5) | 0.16 | 4/26 (15.4) | 3/30 (10.0) | 0.69 |
| Tacrolimus | 147/168 (87.5) | 46/56 (82.1) | 0.32 | 20/26 (76.9) | 26/30 (86.7) | 0.49 |
| Mycophenolate mofetil | 155/168 (92.3) | 49/56 (87.5) | 0.28 | 23/26 (88.5) | 26/30 (86.7) | >0.99 |
| Azathioprine | 7/168 (4.2) | 0/56 (0.0) | 0.20 | 0/24 (0.0) | 0/28 (0.0) | >0.99 |
| mTOR inhibitor | 8/168 (4.8) | 6/56 (10.7) | 0.11 | 3/26 (11.5) | 3/30 (10.0) | >0.99 |
| Corticosteroids | 141/168 (83.9) | 52/56 (92.9) | 0.09 | 24/26 (92.3) | 28/30 (93.3) | >0.99 |
| Treatment after ABMRh diagnosis, n (%) | — | — | — | 18/26 (69.2%) | 18/30 (60.0%) | 0.47 |
| Corticosteroids | — | — | — | 17/18 (94.4%) | 16/18 (88.9%) | >0.99 |
| Anti-thymocyte globulin | — | — | — | 3/18 (16.7%) | 2/18 (11.1%) | >0.99 |
| Intravenous Ig | — | — | — | 2/18 (11.1%) | 8/18 (44.4%) | 0.03a |
| Plasmapheresis | — | — | — | 4/18 (22.2%) | 9/18 (50.0%) | 0.08 |
| Rituximab | — | — | — | 2/18 (11.1%) | 5/18 (27.8%) | 0.21 |
| Eculizumab | — | — | — | 0/18 (0.0%) | 1/18 (5.6%) | >0.99 |
| Transplantation | ||||||
| Delayed graft function, n (%) | 29/167 (17.4) | 19/55 (34.6) | 0.007a | 12/26 (46.2) | 7/29 (24.1) | 0.09 |
| Cold ischemia time (h), median (IQR) | 12.6 (7.9–16.9) | 13.0 (7.9–17.7) | 0.51 | 11.9 (7.9–16.2) | 15.3 (7.0–17.8) | 0.30 |
| Warm ischemia time (h), median (IQR) | 0.3 (0.1–0.4) | 0.3 (0.1–0.4) | 0.77 | 0.4 (0.1–0.4) | 0.1 (0.1–0.2) | 0.77 |
| Immunosuppression, n (%) | ||||||
| Induction therapy | 116/167 (69.5) | 44/54 (81.5) | 0.09 | 21/26 (80.8) | 23/28 (82.1) | >0.99 |
| ATG | 15/116 (12.9) | 7/44 (15.9) | 0.88 | 3/21 (14.3) | 4/23 (17.4) | >0.99 |
| Anti-CD25 | 98/116 (84.5) | 36/44 (81.8) | 0.88 | 18/21 (85.7) | 18/23 (78.3) | >0.99 |
| Other | 2/116 (1.72) | 1/44 (2.3) | 0.88 | 0/21 (0.0) | 1/23 (4.4) | >0.99 |
| Cyclosporin | 27/168 (16.1) | 10/56 (17.9) | 0.76 | 4/26 (15.4) | 6/30 (20.0) | 0.74 |
| Tacrolimus | 139/168 (82.7) | 46/56 (82.1) | 0.92 | 22/26 (84.6) | 24/30 (80.0) | 0.74 |
| Mycophenolate mofetil | 156/168 (92.9) | 51/56 (91.1) | 0.66 | 24/26 (92.3) | 27/30 (90.0) | >0.99 |
| Azathioprine | 2/168 (1.2) | 0/56 (0.0) | >0.99 | 0/24 (0.0) | 0/28 (0.0) | >0.99 |
| mTOR inhibitor | 4/168 (2.4) | 3/56 (5.4) | 0.37 | 1/26 (4.2) | 2/30 (6.7) | >0.99 |
| Corticosteroids | 167/168 (99.4) | 56/56 (100.0) | >0.99 | 26/26 (100) | 30/30 (100.0) | >0.99 |
Denominator numbers less than original group size indicate incomplete information. Percentage values may not add up to 100% due to rounding. IQR, interquartile range; mTOR, mammalian target of rapamycin; ATG, anti-thymocyte globulin.
Indicates significant P values for difference between groups.
Apart from the defining histologic lesions, ABMRh biopsy specimens also had more tubulitis and interstitial inflammation, with TCMR diagnosed in 14/56 (25.0%) versus 10/168 (6.0%) biopsy specimens without ABMRh (P<0.001). Except for more C4d deposition in ABMRh biopsy specimens with HLA-DSAs, there were no histologic differences between HLA-DSA–positive ABMRh and HLA-DSA–negative ABMRh (Table 2).
Table 2.
Comparison of histologic features between phenotypes
| Parameter | No ABMRh (n=168) | ABMRh (n=56) | P Value | HLA-DSA Negative ABMRh (n=26) | HLA-DSA Positive ABMRh (n=30) | P Value |
|---|---|---|---|---|---|---|
| g, mean (±SD) | 0.05 (±0.22) | 1.95 (±0.94) | <0.001a | 2.19 (±0.80) | 1.73 (±1.01) | 0.09 |
| g≥1, n (%) | 9/168 (5.4) | 53/56 (94.6) | <0.001a | 26/26 (100.0) | 27/30 (90.0) | 0.24 |
| ptc, mean (±SD) | 0.09 (±0.43) | 1.07 (±0.89) | <0.001a | 1.12 (±0.82) | 1.03 (±0.96) | 0.66 |
| ptc≥1, n (%) | 9/168 (5.4) | 39/56 (69.6) | <0.001a | 20/26 (76.9) | 19/30 (63.3) | 0.27 |
| MVI score, mean (±SD) | 0.14 (±0.47) | 3.01 (±1.30) | <0.001a | 3.31 (±1.09) | 2.77 (±1.43) | 0.13 |
| MVI ≥2, n (%) | 4/168 (2.4) | 49/56 (87.5) | <0.001a | 25/26 (96.2) | 24/30 (80.0) | 0.11 |
| C4d, mean (±SD) | 0.12 (±0.55) | 0.84 (±1.16) | <0.001a | 0.46 (±0.81) | 1.17 (±1.32) | 0.04a |
| C4d≥1, n (%) | 9/168 (5.4) | 24/56 (42.9) | <0.001a | 8/26 (30.8) | 16/30 (53.3) | 0.09 |
| v, mean (±SD) | 0.04 (±0.22) | 0.38 (±0.65) | <0.001a | 0.42 (±0.58) | 0.33 (±0.71) | 0.29 |
| v≥1, n (%) | 5/168 (3.0) | 17/56 (30.4) | <0.001a | 10/26 (38.5) | 7/30 (23.3) | 0.22 |
| cg, mean (±SD) | 0.07 (±0.41) | 0.40 (±0.81) | <0.001a | 0.35 (±0.63) | 0.45 (±0.95) | 0.94 |
| cg≥1, n (%) | 7/168 (4.2) | 14/56 (25.0) | <0.001a | 7/26 (26.9) | 7/30 (23.3) | 0.77 |
| i, mean (±SD) | 0.24 (±0.65) | 0.63 (±1.05) | 0.006a | 0.77 (±1.21) | 0.50 (±0.90) | 0.42 |
| i≥1, n (%) | 25/168 (14.9) | 17/56 (30.4) | 0.01a | 9/26 (34.6) | 8/30 (26.7) | 0.52 |
| t, mean (±SD) | 0.44 (±0.76) | 0.70 (±0.76) | 0.004a | 0.69 (±0.88) | 0.70 (±0.65) | 0.65 |
| t≥1, n (%) | 52/168 (31.0) | 30/56 (53.6) | 0.003a | 12/26 (46.2) | 18/30 (60.0) | 0.30 |
| ti, mean (±SD) | 0.38 (±0.79) | 0.57 (±0.87) | 0.04a | 0.46 (±0.86) | 0.67 (±0.88) | 0.30 |
| ti≥1, n (%) | 38/168 (22.6) | 21/56 (37.5) | 0.03a | 8/26 (30.8) | 13/30 (43.3) | 0.33 |
| ci, mean (±SD) | 0.94 (±1.10) | 0.68 (±0.79) | 0.30 | 0.54 (±0.71) | 0.80 (±0.85) | 0.25 |
| ci≥1, n (%) | 87/168 (51.8) | 24/56 (42.8) | 0.58 | 11/26 (42.3) | 17/30 (56.7) | 0.28 |
| ct, mean (±SD) | 1.01 (±1.01) | 0.80 (±0.72) | 0.40 | 0.73 (±0.67) | 0.87 (±0.78) | 0.58 |
| ct≥1, n (%) | 103/168 (61.3) | 36/56 (64.3) | 0.69 | 16/26 (61.5) | 20/30 (66.7) | 0.69 |
| ah, mean (±SD) | 0.85 (±0.99) | 1.04 (±1.11) | 0.32 | 1.08 (±1.06) | 1.00 (±1.17) | 0.61 |
| ah≥1, n (%) | 88/168 (52.4) | 32/56 (57.1) | 0.54 | 17/26 (65.4) | 15/30 (50.0.4) | 0.25 |
| cv, mean (±SD) | 0.83 (±0.95) | 1.20 (±1.15) | 0.04a | 1.42 (±1.21) | 1.00 (±1.08) | 0.19 |
| cv≥1, n (%) | 87/168 (51.8) | 35/56 (62.5) | 0.16 | 18/26 (70.8) | 17/30 (56.7) | 0.33 |
| TCMR, n (%) | 10/168 (6.0) | 14/56 (25.0) | <0.001a | 8/26 (30.8) | 6/30 (20.0) | 0.35 |
| Borderline, n (%) | 20/168 (11.9) | 6/56 (10.7) | 0.81 | 2/26 (7.7) | 4/30 (13.3) | 0.68 |
| IFTA, n (%) | 80/168 (47.6) | 24/56 (42.9) | 0.54 | 11/26 (42.3) | 13/30 (43.3) | 0.94 |
| PVAN, n (%) | 2/168 (1.2) | 1/56 (1.8) | >0.99 | 0/26 (0.0) | 1/30 (3.3) | >0.99 |
| ATN, n (%) | 34/168 (20.2) | 22/56 (39.3) | 0.004a | 9/26 (34.6) | 13/30 (43.3) | 0.51 |
| GN, n (%) | 1/168 (0.6) | 3/56 (5.4) | 0.05a | 2/26 (7.7) | 1/30 (3.3) | 0.59 |
| TMA, n (%) | 3/168 (1.8) | 6/56 (10.7) | 0.009a | 3/26 (11.5) | 3/30 (10.0) | >0.99 |
| Pyelonephritis, n (%) | 3/168 (1.8) | 0/56 (0.0) | 0.57 | 0/24 (0.0) | 0/30 (0.0) | >0.99 |
Denominator numbers less than original group size indicate missing data. Percentage values may not add up to 100% due to rounding. g, glomerulitis; ptc, peritubular capillaritis; v, intimal arteritis; i, interstitial inflammation; t, tubulitis; ti, total inflammation; ci, interstitial fibrosis; ct, tubular atrophy; ah, arteriolar hyalinosis; cv, vascular fibrous intimal thickening; IFTA, interstitial fibrosis and tubular atrophy; PVAN, polyomavirus-associated nephropathy; ATN, acute tubular necrosis; TMA, thrombotic microangiopathy.
Indicates significance P values for difference between groups.
Transcriptional Comparison of HLA-DSA–Positive and HLA-DSA–Negative ABMRh Subtypes
Next, whole transcriptome analysis of all 224 biopsy specimens was performed. In comparison to other biopsy samples, we identified upregulation of 3848 transcripts in ABMRh biopsy specimens, corresponding to 1756 genes, and downregulation of 2516 transcripts, or 1436 genes (Figure 1A, Supplemental Table 1). Among the differentially expressed gene list were 19/23 previously reported DSA-specific transcripts and 16/20 ABMR classifiers, reflecting a high similarity to previously reported ABMR cohorts.18,26 Comparing HLA-DSA–positive ABMRh and HLA-DSA–negative ABMRh, only sex-specific genes were expressed with a more than twofold change, reflecting a higher tendency of female donors in the HLA-DSA–positive group (64.3% versus 48.0% female donors, respectively). After correction for multiple testing, no transcripts were differentially expressed between HLA-DSA–positive and HLA-DSA–negative cases (Figure 1B). Alternative stratification of ABMRh biopsy samples according to C4d positivity, HLA-DSA status at time of the biopsy, the third Banff 2017 criterion (C4d or DSA positive), and concomitant borderline changes or TCMR did not reveal transcriptional differences between groups either (Supplemental Figure 1). Similarly, if MVI (defined as the sum of glomerulitis and peritubular capillaritis ≥2) was used, no differences were observed between HLA-DSA–positive and HLA-DSA–negative MVI cases. To corroborate these findings, we analyzed gene expression data from an external cohort18 and again found no differentially expressed genes between HLA-DSA–negative ABMRh (n=10) and HLA-DSA–positive ABMRh (n=87) cases (Supplemental Figure 2).
Figure 1.
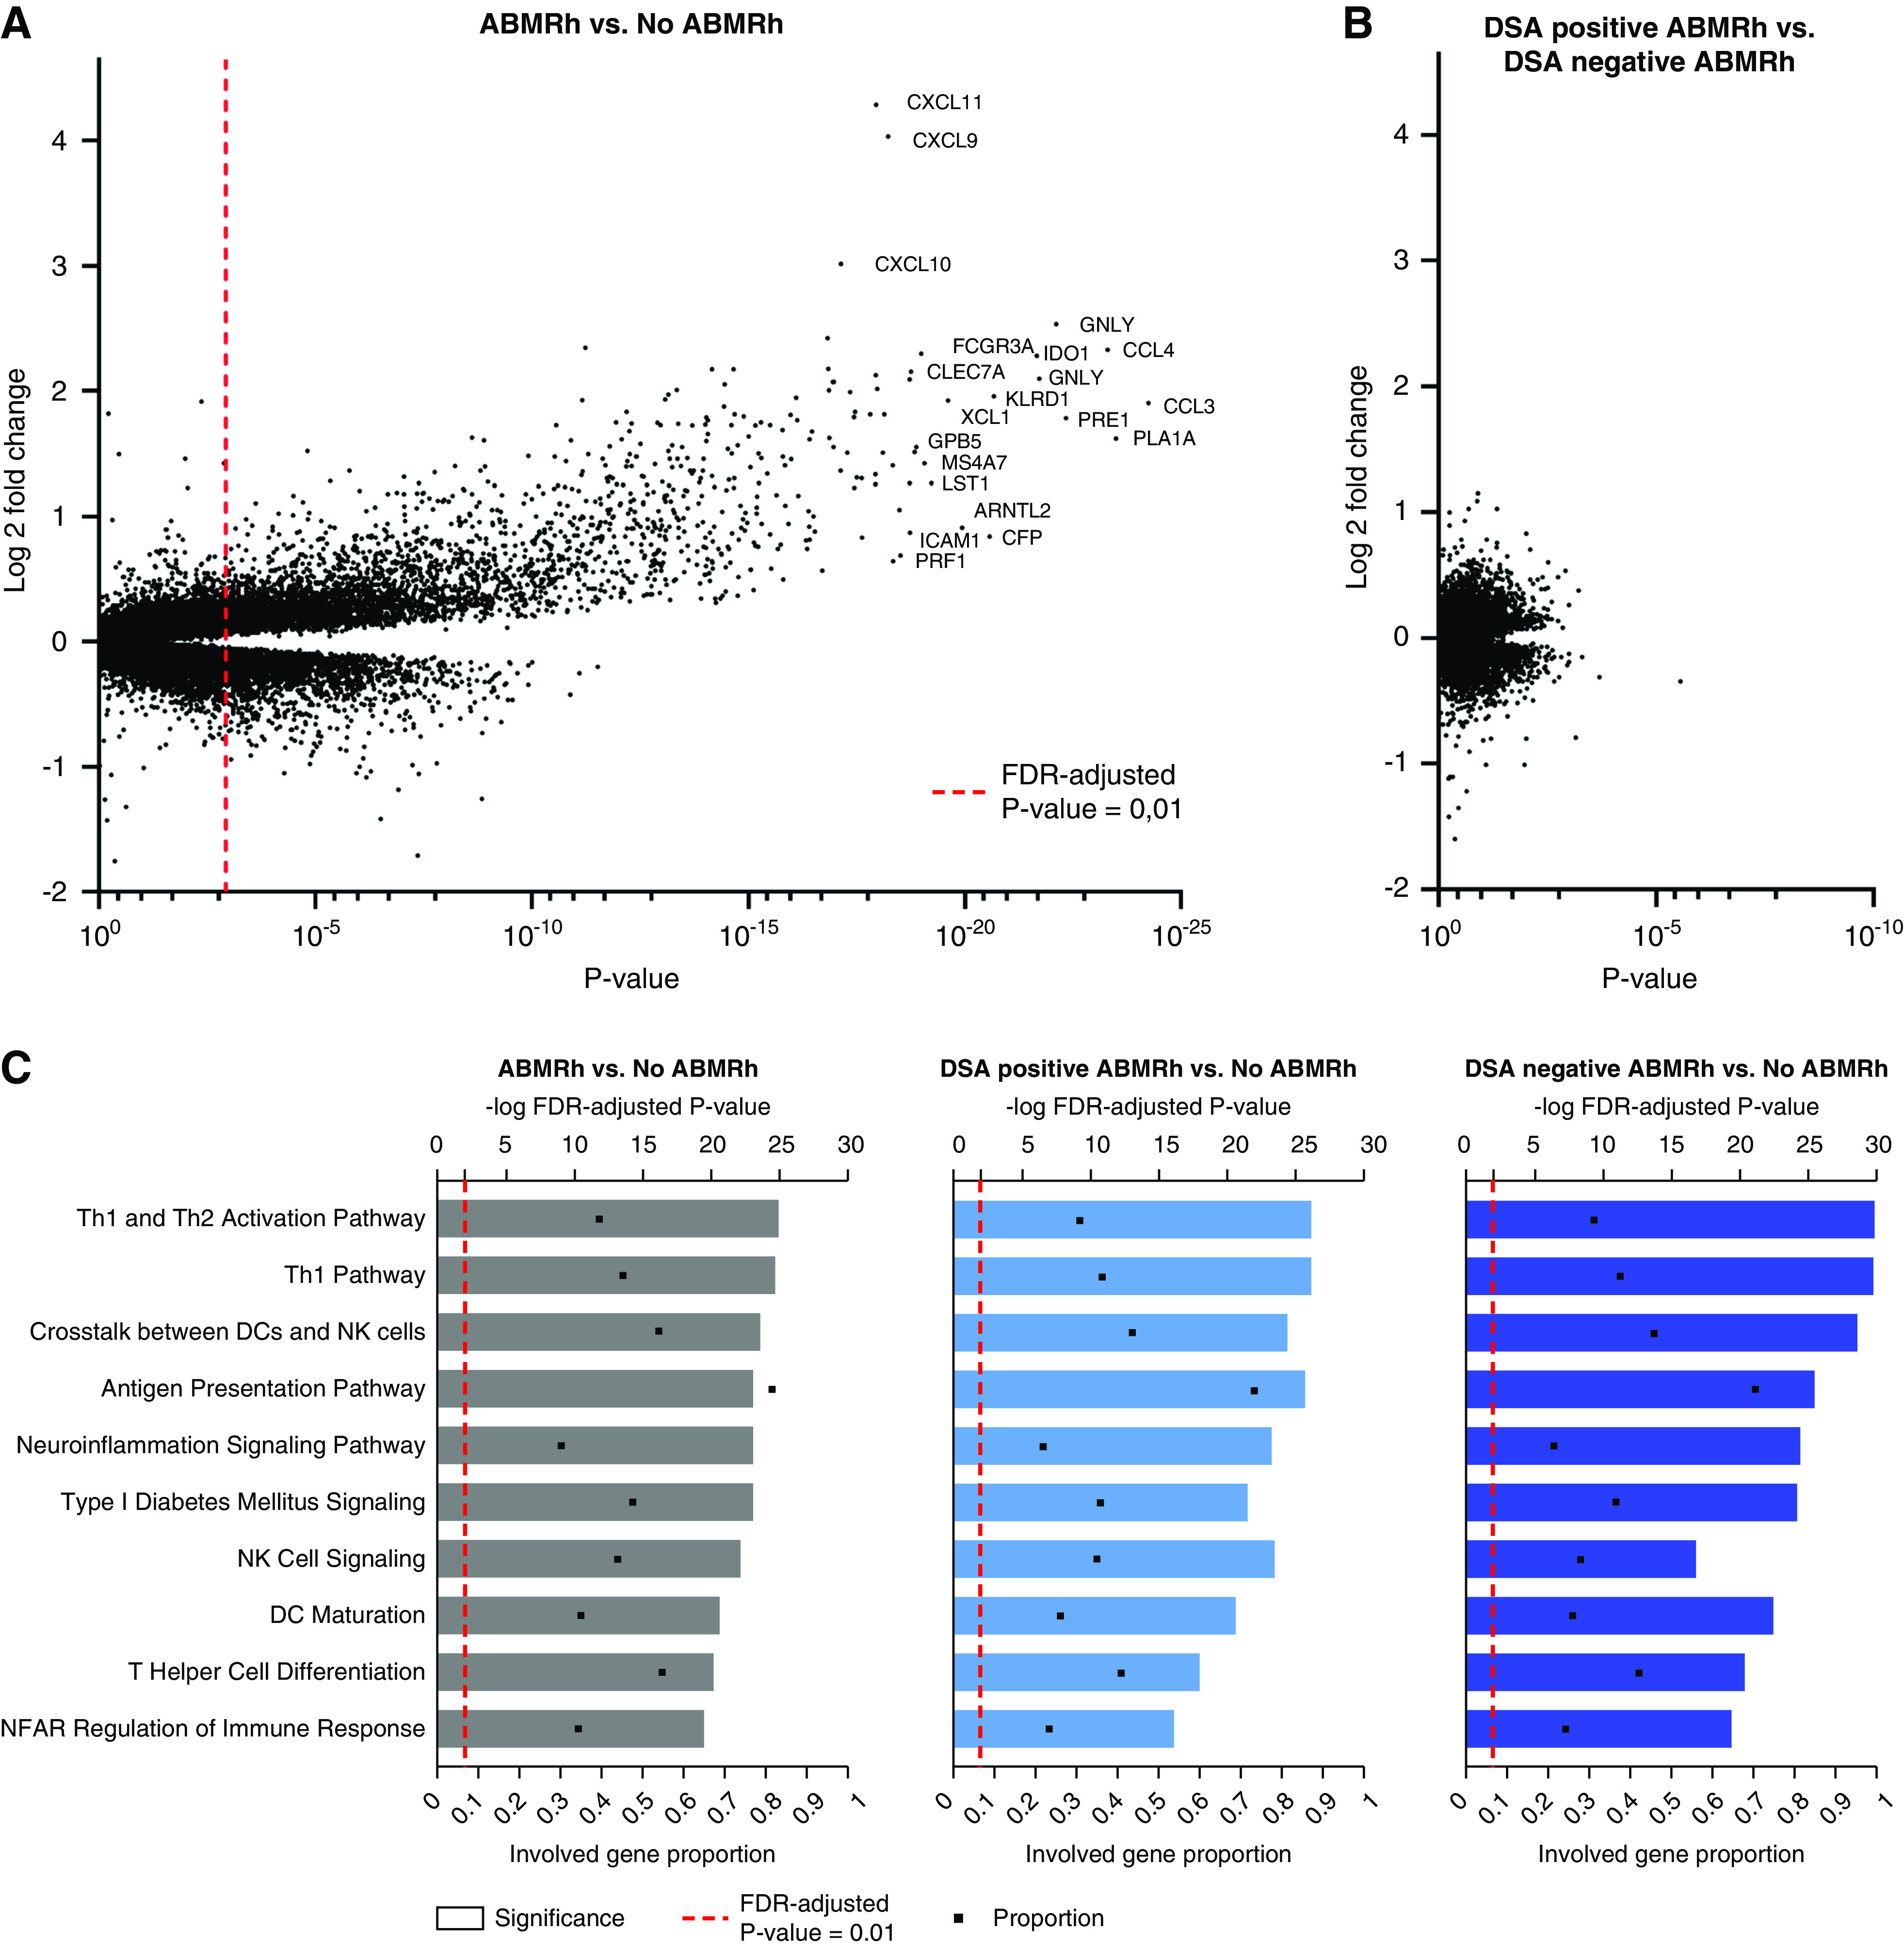
HLA-DSA-negative ABMRh exhibits similar transcriptional changes as HLA-DSA-positive ABMRh. (A) Differential gene expression analysis between ABMRh (n=56) and no ABMRh (n=168). Genes can be represented by multiple probe sets within a single microarray. FDR-adjusted P value <0.01 was considered significant (dashed red line). (B) Differential gene expression analysis between HLA-DSA–negative ABMRh (n=26) and HLA-DSA–positive ABMRh (n=30). No probe sets were found to differ between these two groups after FDR adjustment, despite a clear distinction between ABMRh cases and other biopsy specimens as presented in (A). (C) Ingenuity pathway analysis of differentially expressed genes in ABMRh, HLA-DSA–positive ABMRh, or HLA-DSA–negative ABMRh versus other biopsy specimens. The top ten upregulated pathways in ABMRh were preserved in both ABMRh subtypes. Gene proportion denotes the fraction of known genes within the analyzed pathway that are significantly overexpressed. DCs, dendritic cells; NFAT, nuclear factor of activated T cells; Th1, T helper type 1 cell.
Pathway analysis revealed an upregulation of 269 distinct genetic pathways in ABMRh versus biopsy specimens without ABMRh. The most significantly enriched pathways were related to T helper cell activation and maturation, antigen presentation, NK cell signaling, crosstalk between dendritic cells and NK cells, and crosstalk between the innate and adaptive immune system (Supplemental Table 2).23 These pathways were similarly enriched when HLA-DSA–negative ABMRh and HLA-DSA–positive ABMRh were compared separately to biopsy specimens without ABMRh (Figure 1C).
Leukocyte Infiltration and Histology of ABMR
Next, we studied the association between leukocyte infiltration and histologic findings. Considering that many probe sets are not specific for immune cell subsets, we used CIBERSORT deconvolution analysis based on the LM22 gene signature matrix to estimate intragraft leukocyte infiltration.22 Leukocyte infiltration correlated better with acute than chronic histologic lesions. Irrespective of patient HLA-DSA status, NK cells and monocytes/macrophages most strongly associated with severity of glomerulitis, peritubular capillaritis, and intimal arteritis, and associated less with C4d deposition or transplant glomerulopathy (Figure 2A, Supplemental Figure 3). The infiltration of other leukocyte subtypes also correlated with severity of MVI, with the exception of γδ T cells, which associated mostly with TCMR lesions, neutrophils, and eosinophils.
Figure 2.
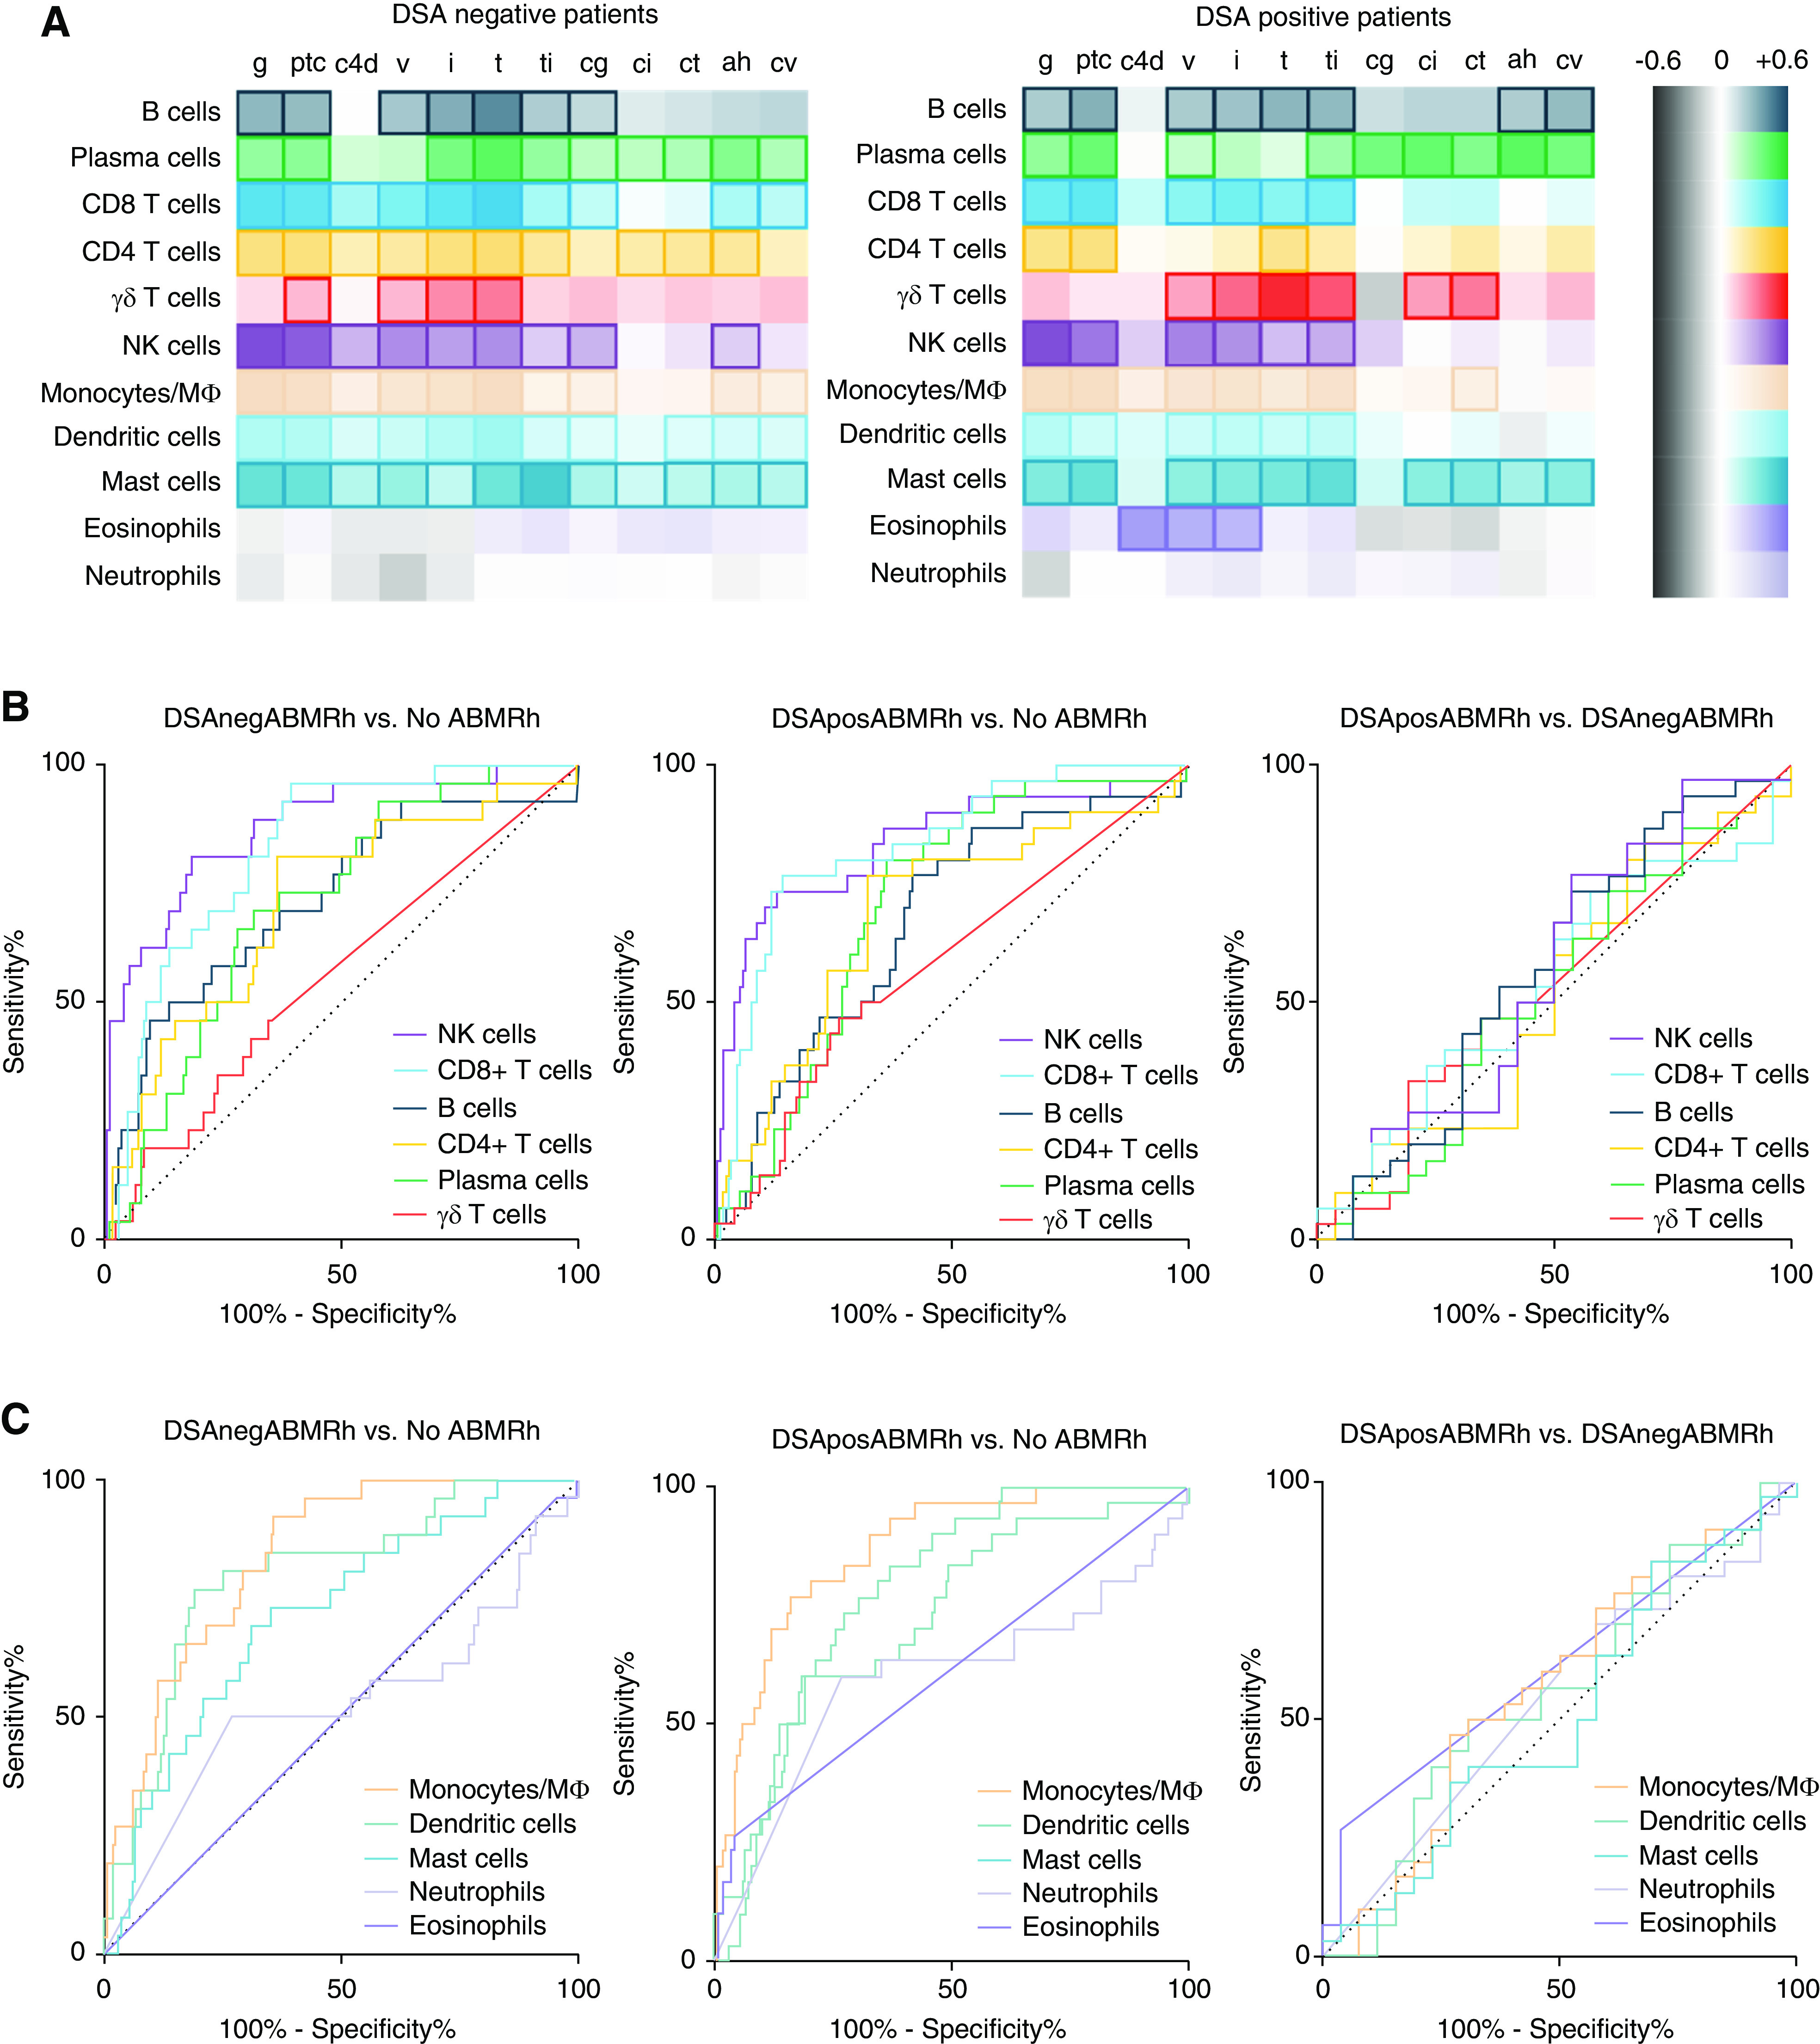
Intragraft leukocyte infiltration associates with ABMR histology. (A) Heatmap of Spearman correlation coefficients between absolute leukocyte infiltration and severity of histologic lesions in patients who are HLA-DSA negative (DSAneg; n=140) and those who are HLA-DSA positive (DSApos; n=84). Marked boxes indicate statistical significance (P<0.05). (B and C) Receiver operating characteristic curves depicting diagnostic accuracy of (B) lymphoid and (C) myeloid cell infiltration for and between ABMRh subtypes. Infiltration of NK cells, monocytes/macrophages, and CD8-positive T cells had the highest predictive value for ABMRh, regardless of HLA-DSA status. The heatmap for the entire population and receiver operating characteristic curves for ABMRh are depicted in Supplemental Figure 2. Mϕ, macrophage.
In patients who were HLA-DSA negative, NK cell infiltration had the highest diagnostic accuracy for ABMRh (area under the curve [AUC]=0.87), followed by monocytes/macrophages (AUC=0.84) and CD8 T cells (AUC=0.82) (Figure 2, B and C, Supplemental Table 3). Similarly, in patients who were HLA-DSA positive, ABMRh was best predicted by monocytes/macrophages (AUC=0.87), NK cells (AUC=0.84), and CD8 T cells (AUC=0.83). However, no leukocyte subtypes could differentiate HLA-DSA–positive from HLA-DSA–negative ABMRh.
To validate our finding that leukocyte infiltration did not differ between phenotypes of ABMR histology, we analyzed 47 independent biopsies with MVI using the computer-assisted analysis of graft inflammation technique, which allows the quantification of macrophages, T cells, B cells, and granulocytes per unit surface of interstitium and microcirculation. In line with our findings using CIBERSORT deconvolution, T cells and macrophages constituted the most abundant cell types in MVI biopsies, whereas NK cells formed a minority of infiltrating cells. A comparison between HLA-DSA–positive MVI (n=32) and HLA-DSA–negative MVI (n=15) did not show any differences in leukocyte subset infiltration, both within the interstitial and microcirculatory compartment (Supplemental Figure 4). Principal component analysis of the entire data set showed a major overlap between groups, suggesting that similar cellular infiltrates account for MVI lesions in both patients who are HLA-DSA positive and those who are HLA-DSA negative (Figure 3).
Figure 3.
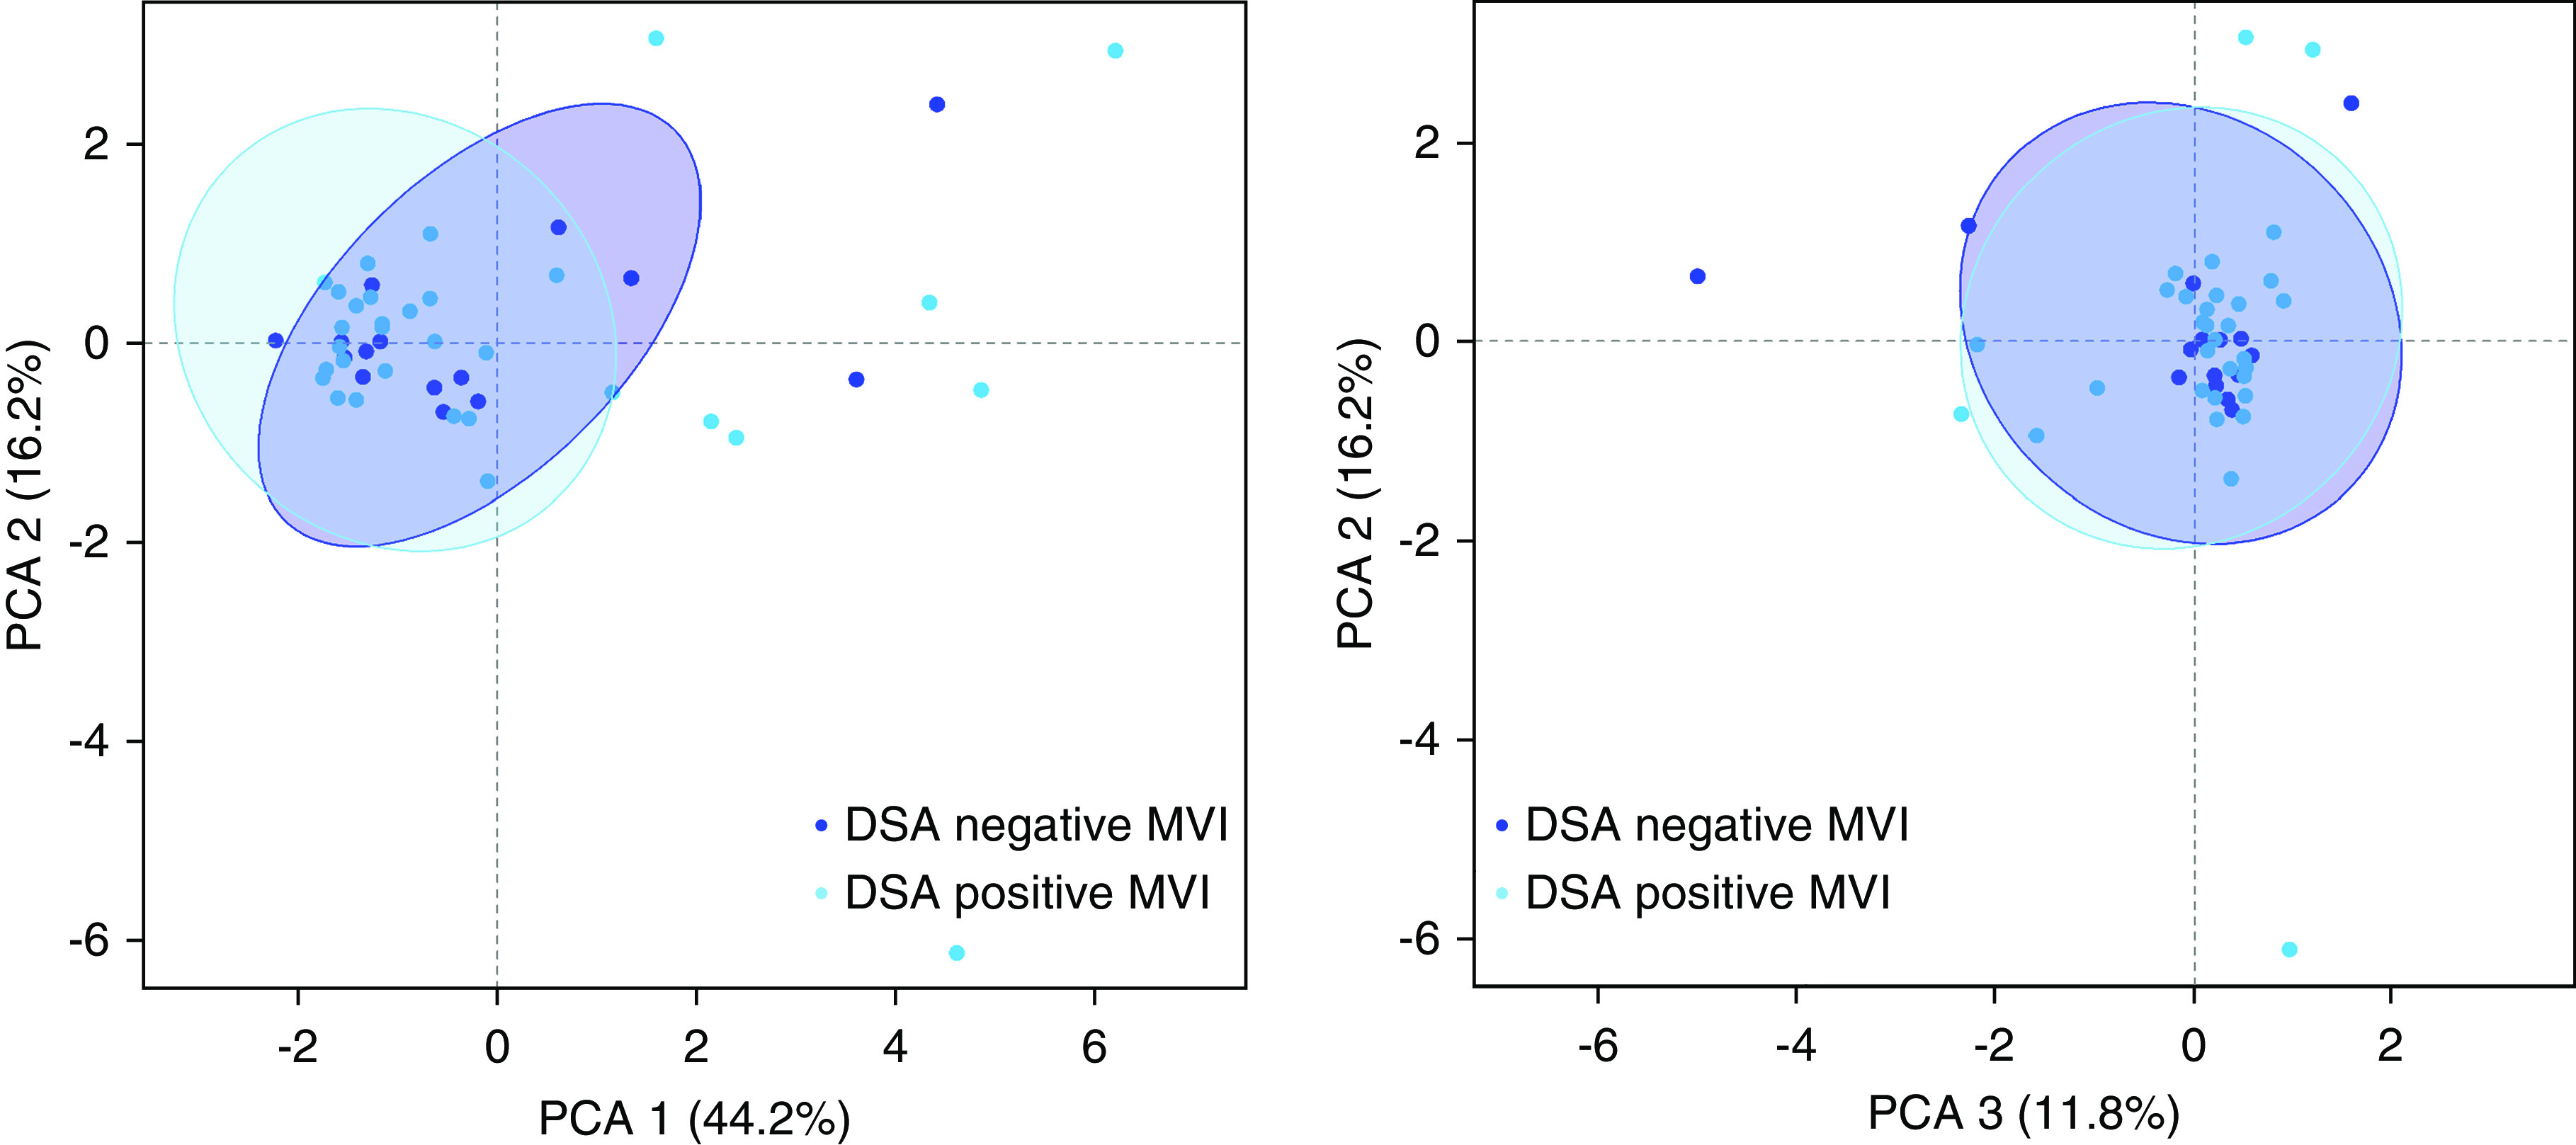
Spatial distribution and extent of leukocyte infiltration in MVI is not influenced by HLA-DSA. Principal component analysis (PCA) of leukocyte subset infiltration quantified by computer-assisted analysis of immunohistochemical staining in kidney allografts with MVI, in the presence (n=32) or absence (n=15) of circulating HLA-DSA. Plotted 95% confidence ellipses show major areas of overlap.
Molecular Heterogeneity of ABMRh
Given the absence of molecular differences between HLA-DSA–positive ABMRh and HLA-DSA–negative ABMRh, we next investigated whether the ABMRh biopsy cohort was homogeneous at the transcriptional level. Based on expression data from all probe sets, t-SNE was used to visualize distance between biopsies (Figure 4A). In addition, t-SNE was also performed using subsets of probe sets representing genes associated with NK cells,22 antibody-dependent cellular cytotoxicity (ADCC),27 and ABMR—including DSA-specific transcripts.28 Selective gene subsets discriminated most ABMRh cases from cases without ABMRh, whereas biopsy specimens with HLA-DSA–positive ABMRh coclustered with the HLA-DSA–negative ABMRh cases (Figure 4, B–D).
Figure 4.
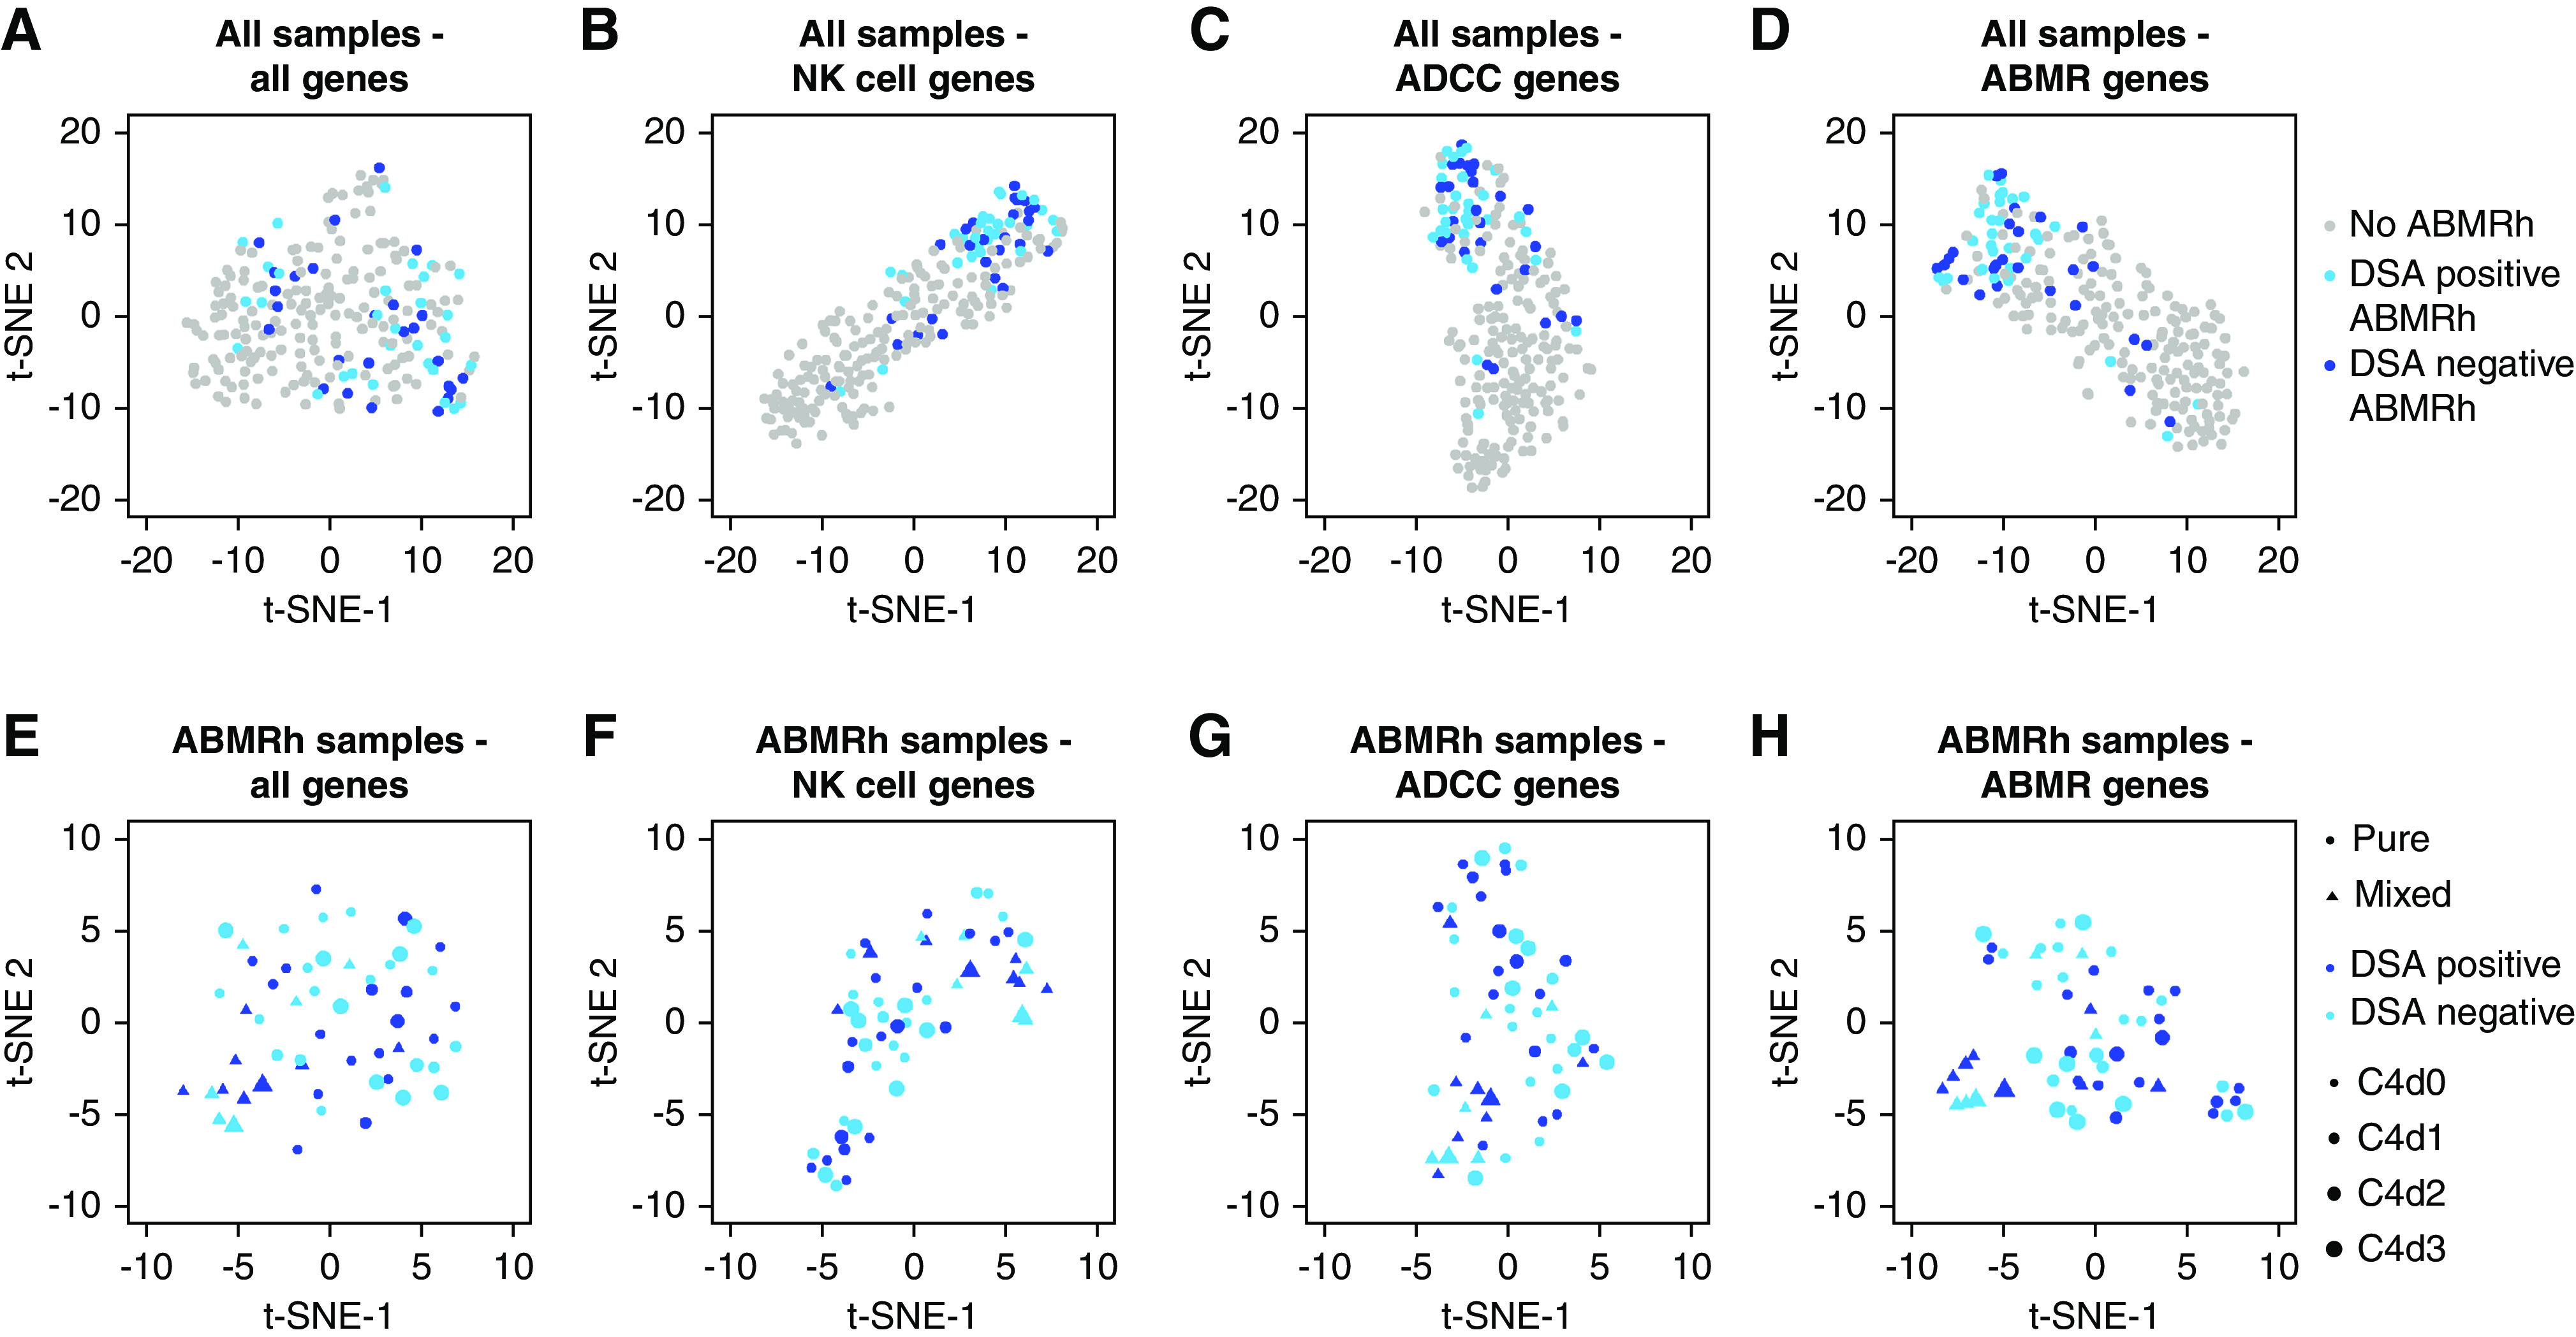
HLA-DSA status does not explain molecular heterogeneity within ABMRh. (A–D) Clustering of all allograft biopsy specimens (n=224) based on expression of (A) all genes and (B–D) gene subsets distinguished most ABMRh biopsy specimens. Ten ABMRh cases were persistent outliers. (E–H) Among ABMRh biopsy specimens (n=56), transcriptional heterogeneity was not explained by HLA-DSA or C4d severity, whereas biopsy specimens with mixed rejection (concomitant borderline/TCMR) colocalize. t-SNE was used for dimensionality reduction. Points represent individual biopsies.
However, ten ABMRh biopsy specimens were persistent outliers, regardless of the applied gene list. In general, these outlier biopsy samples had less MVI, less additional tubulointerstitial inflammation, and more interstitial fibrosis and tubular atrophy than the other ABMRh biopsy samples, although timing and allograft function were similar (Supplemental Table 4). Interestingly, in the outlier group, CIBERSORT-estimated leukocyte infiltration was similar to cases without ABMRh (Supplemental Figure 5).
Next, focusing solely on ABMRh biopsy specimens, molecular heterogeneity was revealed that could be partially attributed to clustering of biopsies with mixed rejection (Figure 4, E–H). Neither HLA-DSA status nor biopsy C4d deposition could account for the molecular heterogeneity within ABMRh biopsy specimens.
We evaluated whether ABMR-specific transcripts correlated with the histomorphologic ABMR lesion scores in different HLA-DSA conditions by grouping the samples according to serum HLA-DSA status and calculation of the sum of glomerulitis, peritubular capillaritis, C4d deposition, arteritis, and transplant glomerulopathy. Selective gene sets colocalized biopsy specimens with similar humoral lesion scores regardless of HLA-DSA status, demonstrating that similar genes are associated with ABMR lesion severity in patients who are HLA-DSA negative (Figure 5).
Figure 5.
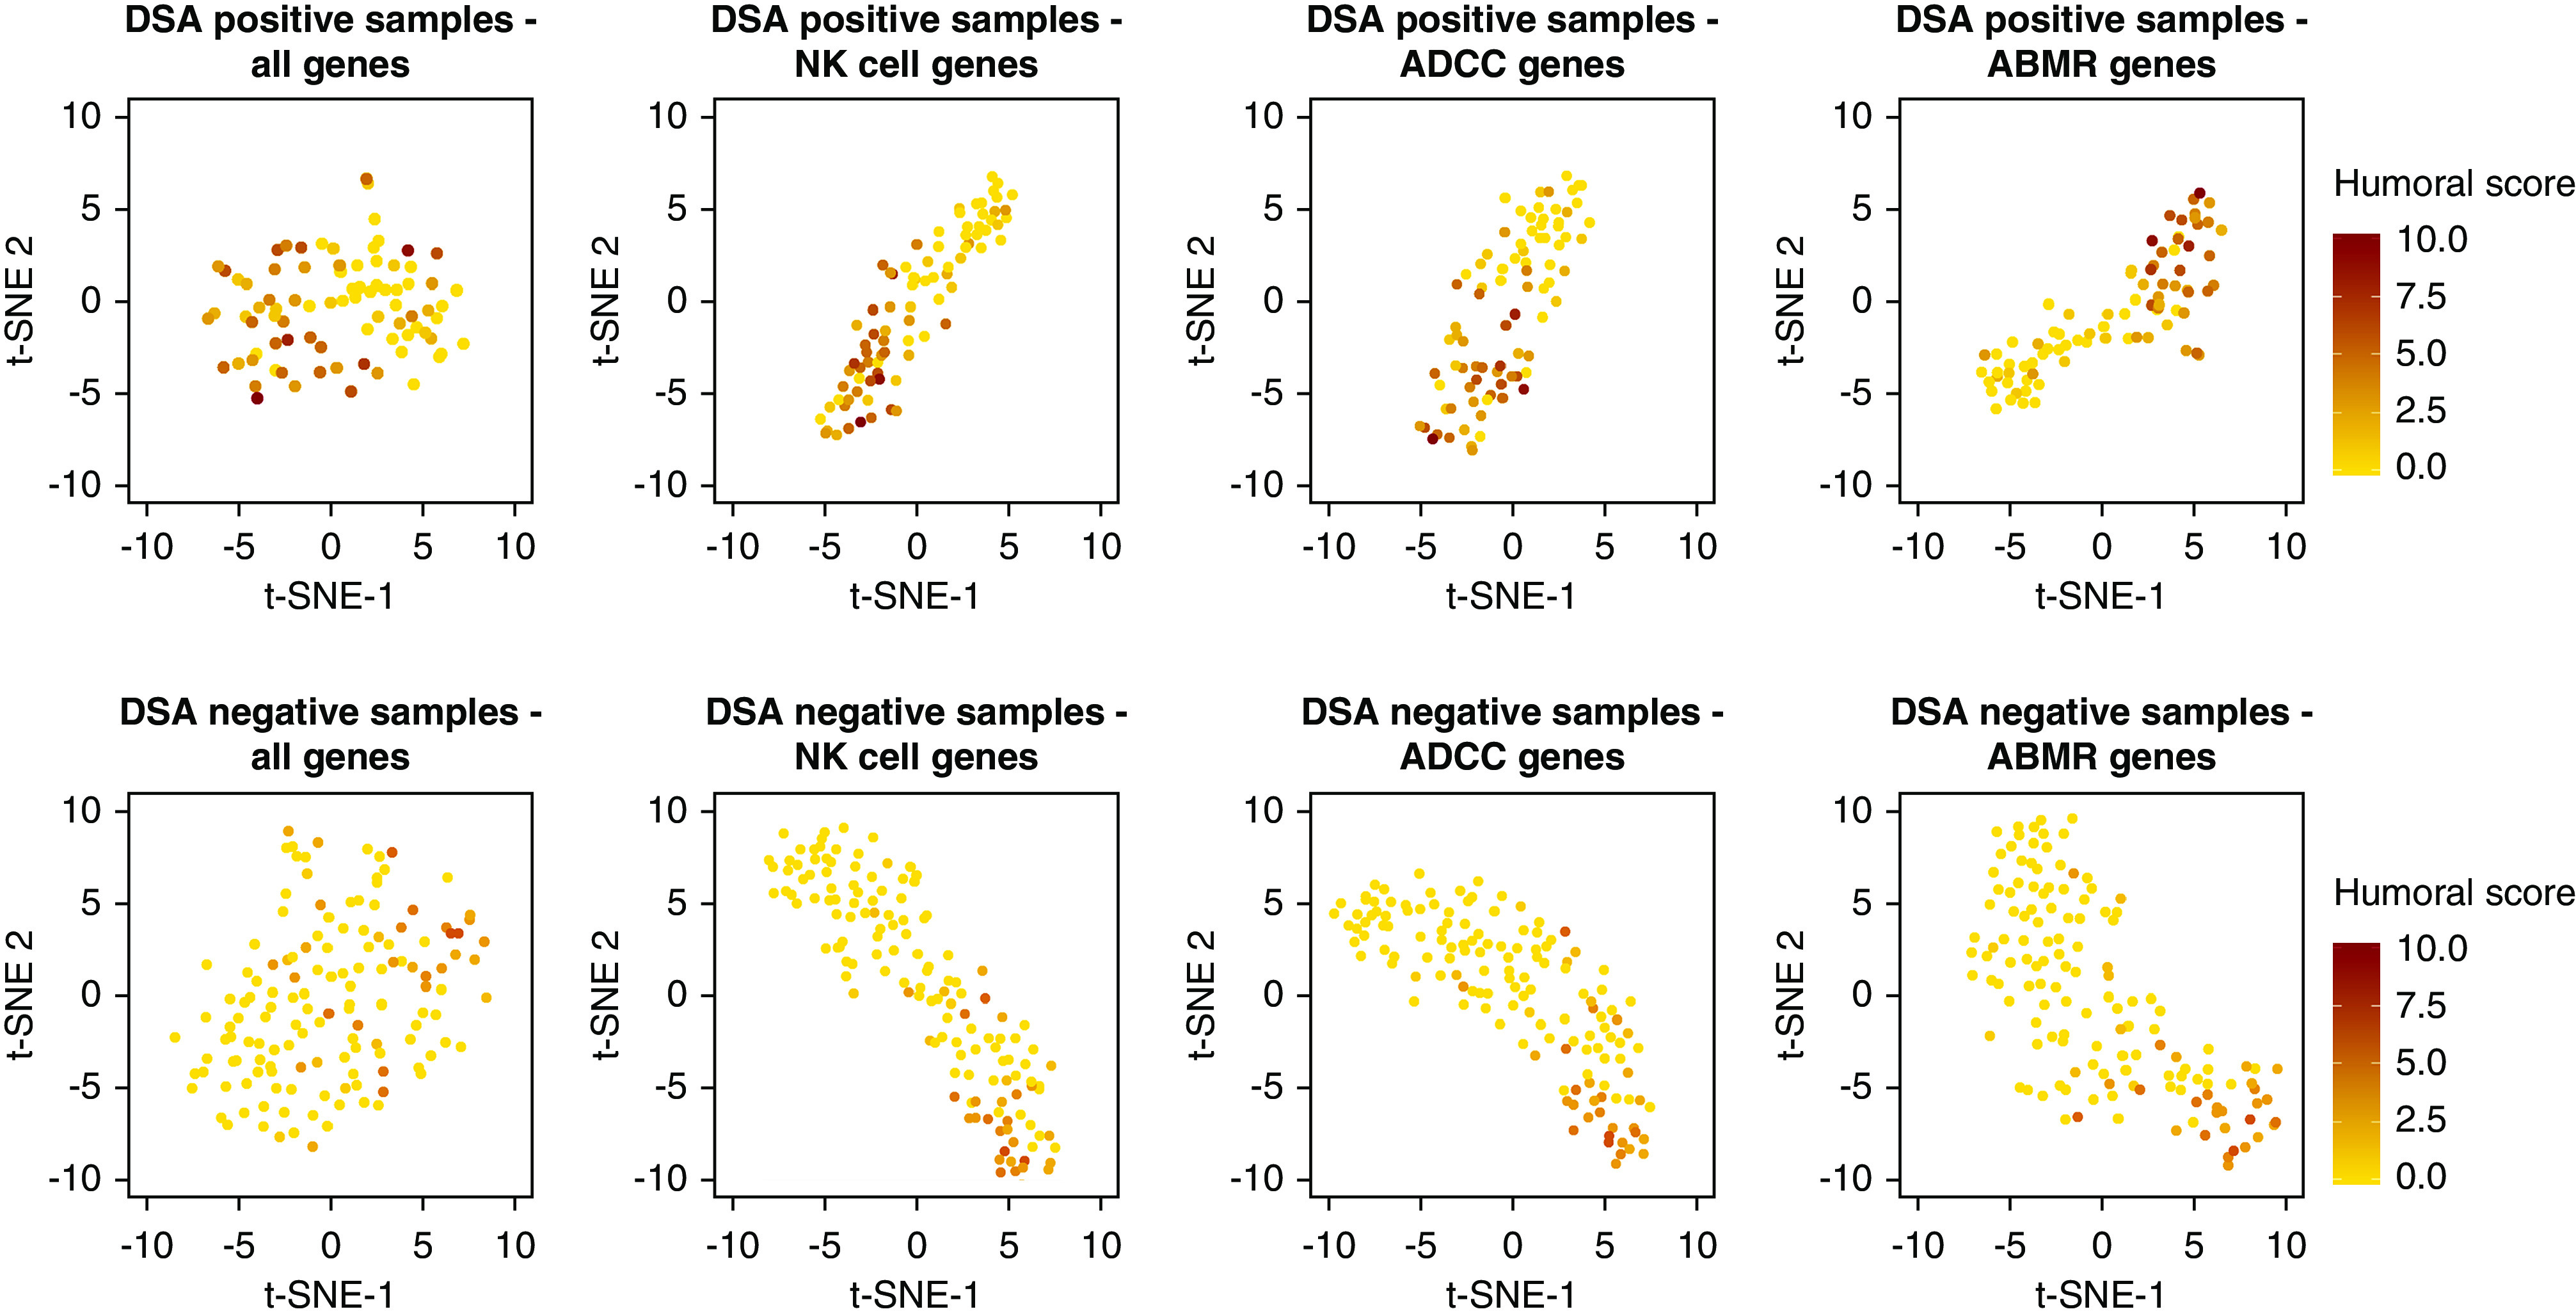
ABMR gene subset expression correlates with humoral lesion severity. Clustering of biopsy specimens based on expression of selective gene sets, with labeling based on the histomorphologic humoral lesion score (i.e., sum of glomerulitis, peritubular capillaritis, arteritis, C4d and transplant glomerulopathy). In both patients who were HLA-DSA positive (n=84) and HLA-DSA negative (n=140), ADCC, NK cell, and ABMR transcripts associate with severity of humoral scores. t-SNE is used for dimensionality reduction. Points represent biopsy specimens.
To further investigate the transcriptional heterogeneity within ABMRh, WGCNA was performed to identify modules of covarying genes. Within ABMRh biopsy specimens, 37 modules were identified, none of which significantly associated with HLA-DSA status (Figure 6). Borderline rejection or C4d score did not correlate with expressional variation within ABMRh cases either. In contrast, module-trait analysis associated five modules with concomitant TCMR. These findings confirm that the transcriptional variability seen in ABMRh biopsy specimens is not caused by HLA-DSA status, but rather reflects the presence of concomitant TCMR.
Figure 6.
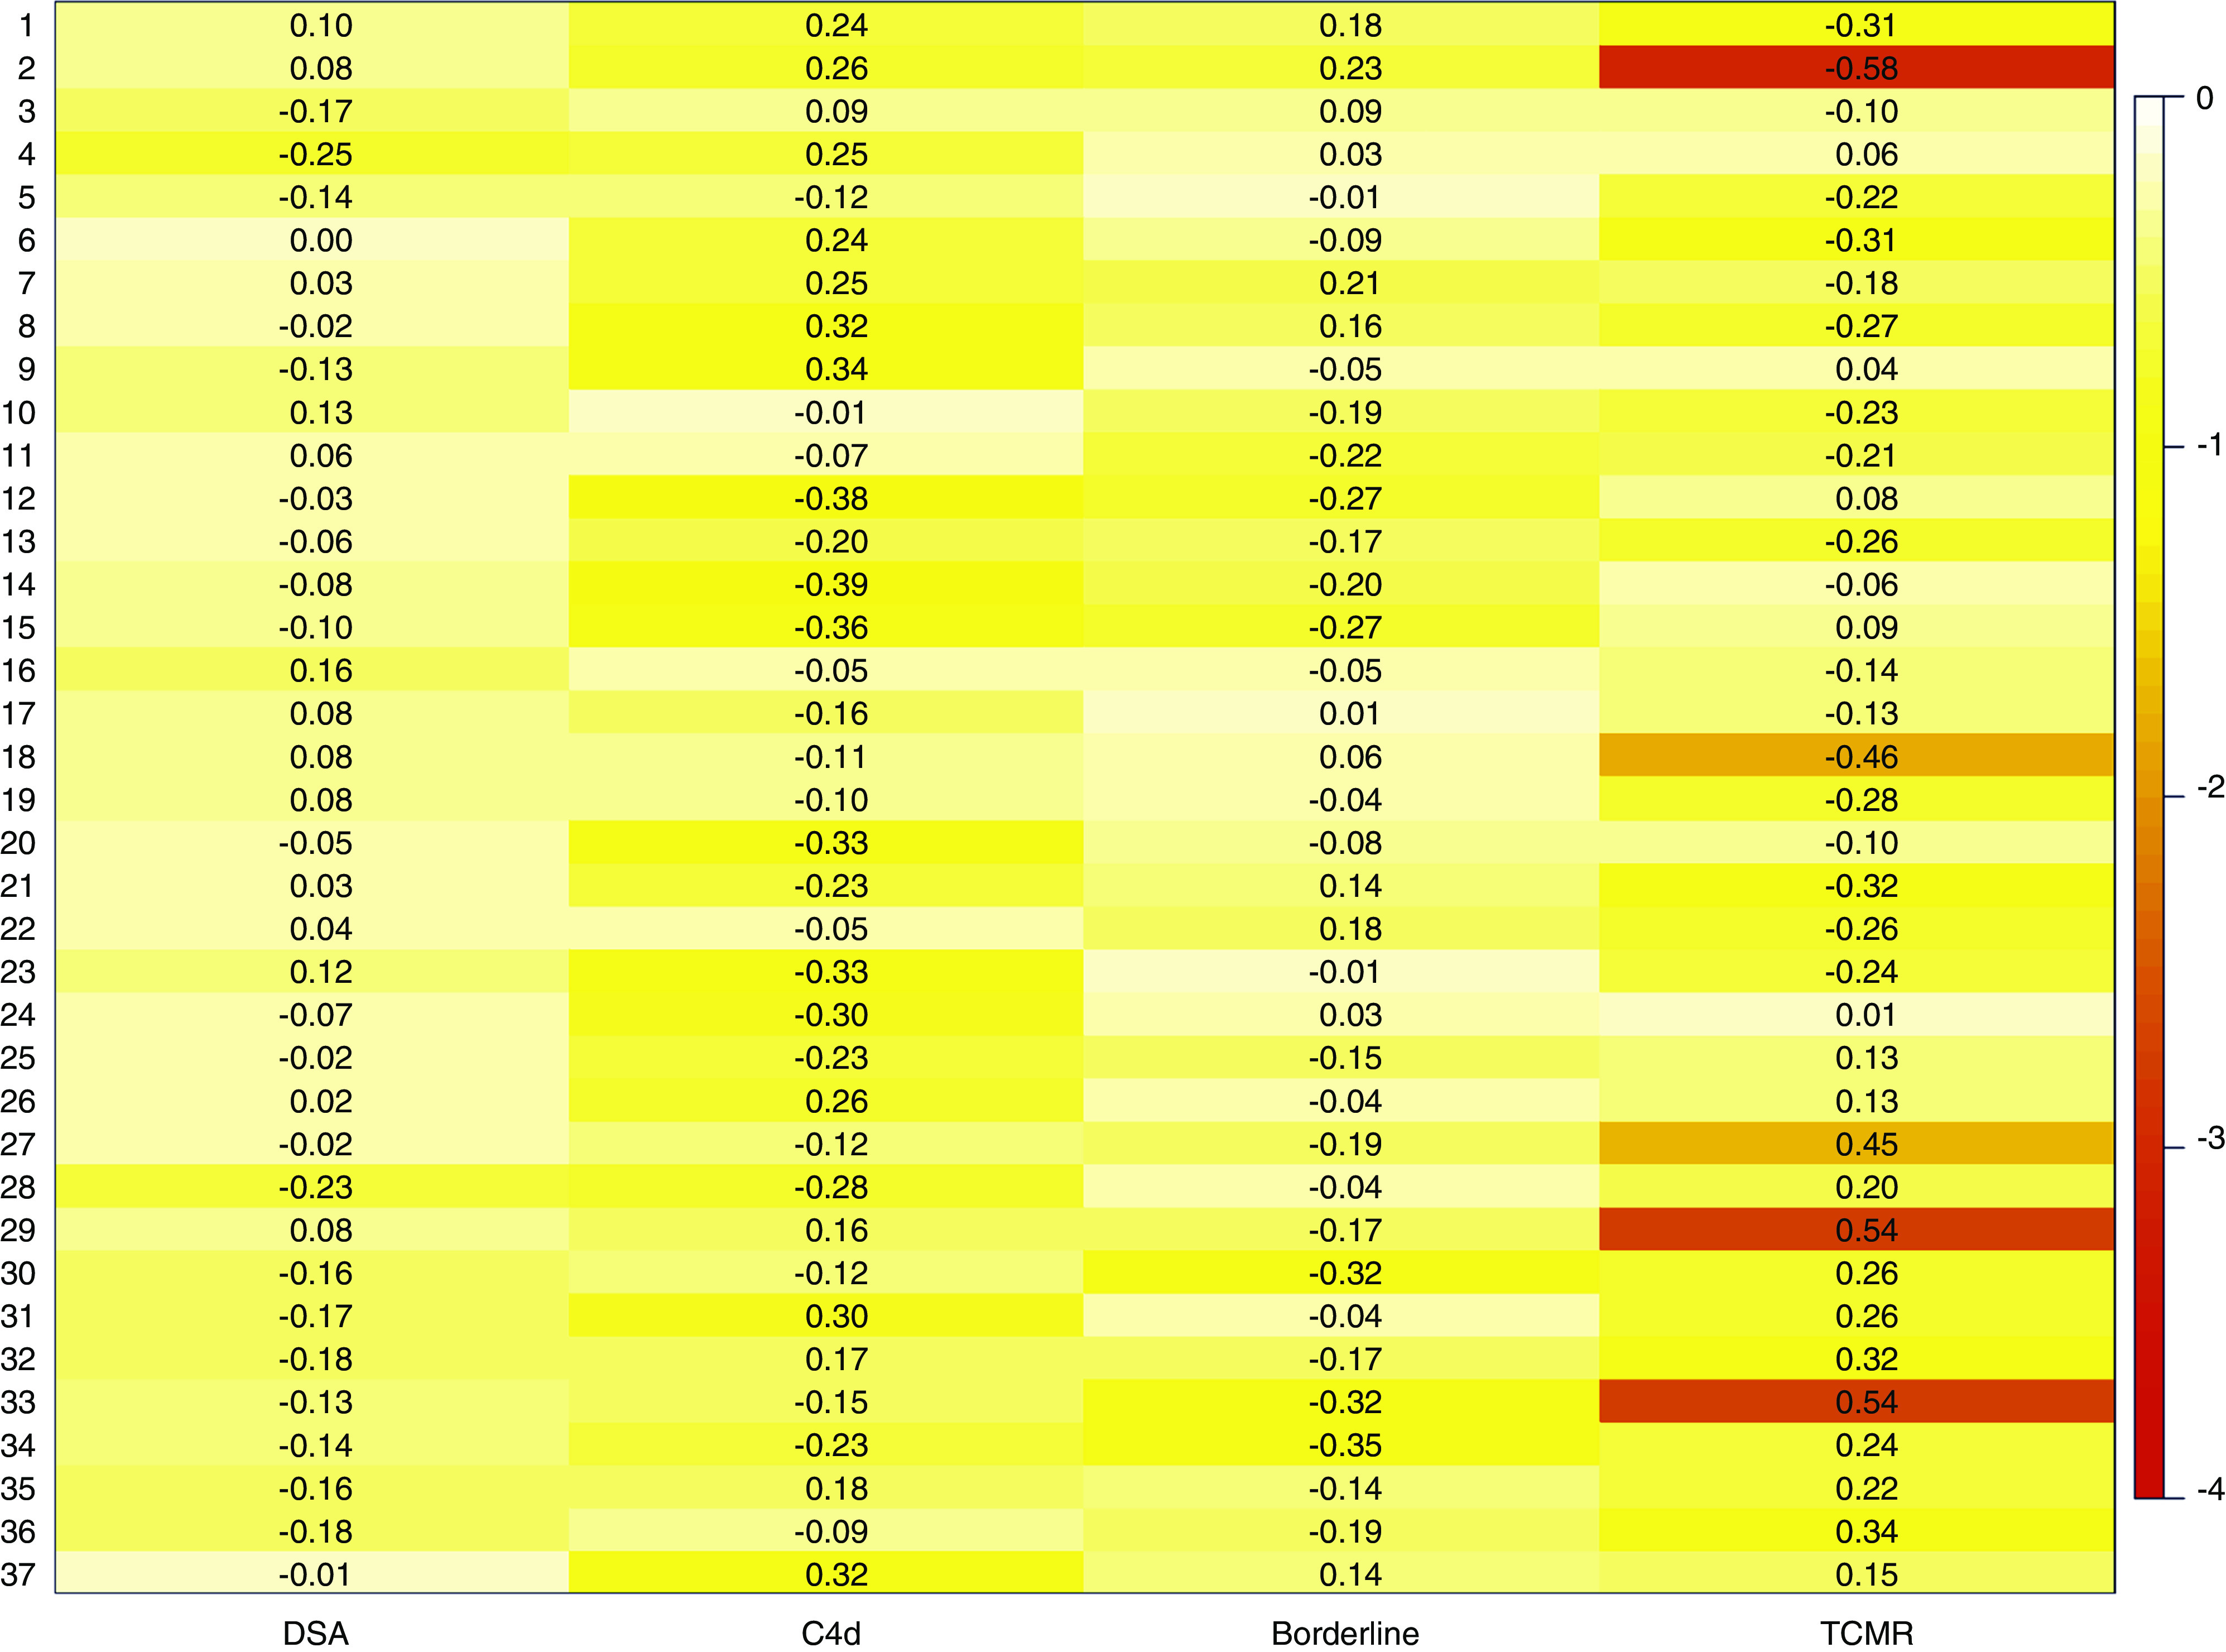
TCMR causes transcriptional variability within ABMRh (n=56). Heatmap represents the correlation between the 37 detected modules (y axis) and different traits of interest (x axis). Color represent log10 P values after FDR adjustment, numbers represent strength of the association (biweight midcorrelation coefficient). HLA-DSA status, C4d score, and borderline rejection did not significantly correlate with modules within ABMRh, in contrast to TCMR.
Graft Survival after ABMRh Diagnosis
We next assessed whether our finding that HLA-DSA status did not influence the molecular picture of ABMRh was also reflected by similarity in graft outcome between HLA-DSA–positive and –negative cases (Figure 7). In a univariate Cox proportional hazards analysis, HLA-DSA–positive ABMRh associated with a higher risk of graft failure than HLA-DSA–negative ABMRh (hazard ratio [HR], 5.39; 95% CI, 2.55 to 11.34, and HR, 2.57; 95% CI, 1.00 to 6.58, respectively), together with TCMR, whereas C4d score and borderline rejection did not (Table 3). De novo HLA-DSA conferred a higher risk of allograft failure than pretransplant HLA-DSA, compared with cases without HLA-DSA (HR, 5.60; 95% CI, 2.49 to 12.6, and HR, 2.48; 95% CI, 1.10 to 5.59, respectively). At the time of biopsy, both persisting and resolved HLA-DSA were positively associated with graft failure (HR, 3.75; 95% CI, 1.68 to 8.39, and HR, 3.93; 95% CI, 1.67 to 9.21, respectively). In a multivariate analysis, only HLA-DSA–positive ABMRh remained significant (HR, 7.24; 95% CI, 3.04 to 17.20), whereas HLA-DSA–negative ABMRh lost effect on graft outcome (HR, 2.33; 95% CI, 0.85 to 6.33). In a multivariate analysis of ABMRh, HLA-DSA, biopsy timing, total cortical inflammation, and chronic lesions, we found that ABMRh and HLA-DSA remained independent predictors of failure, along with total inflammation, interstitial fibrosis and tubular atrophy grade and transplant glomerulopathy (Supplemental Table 5).
Figure 7.
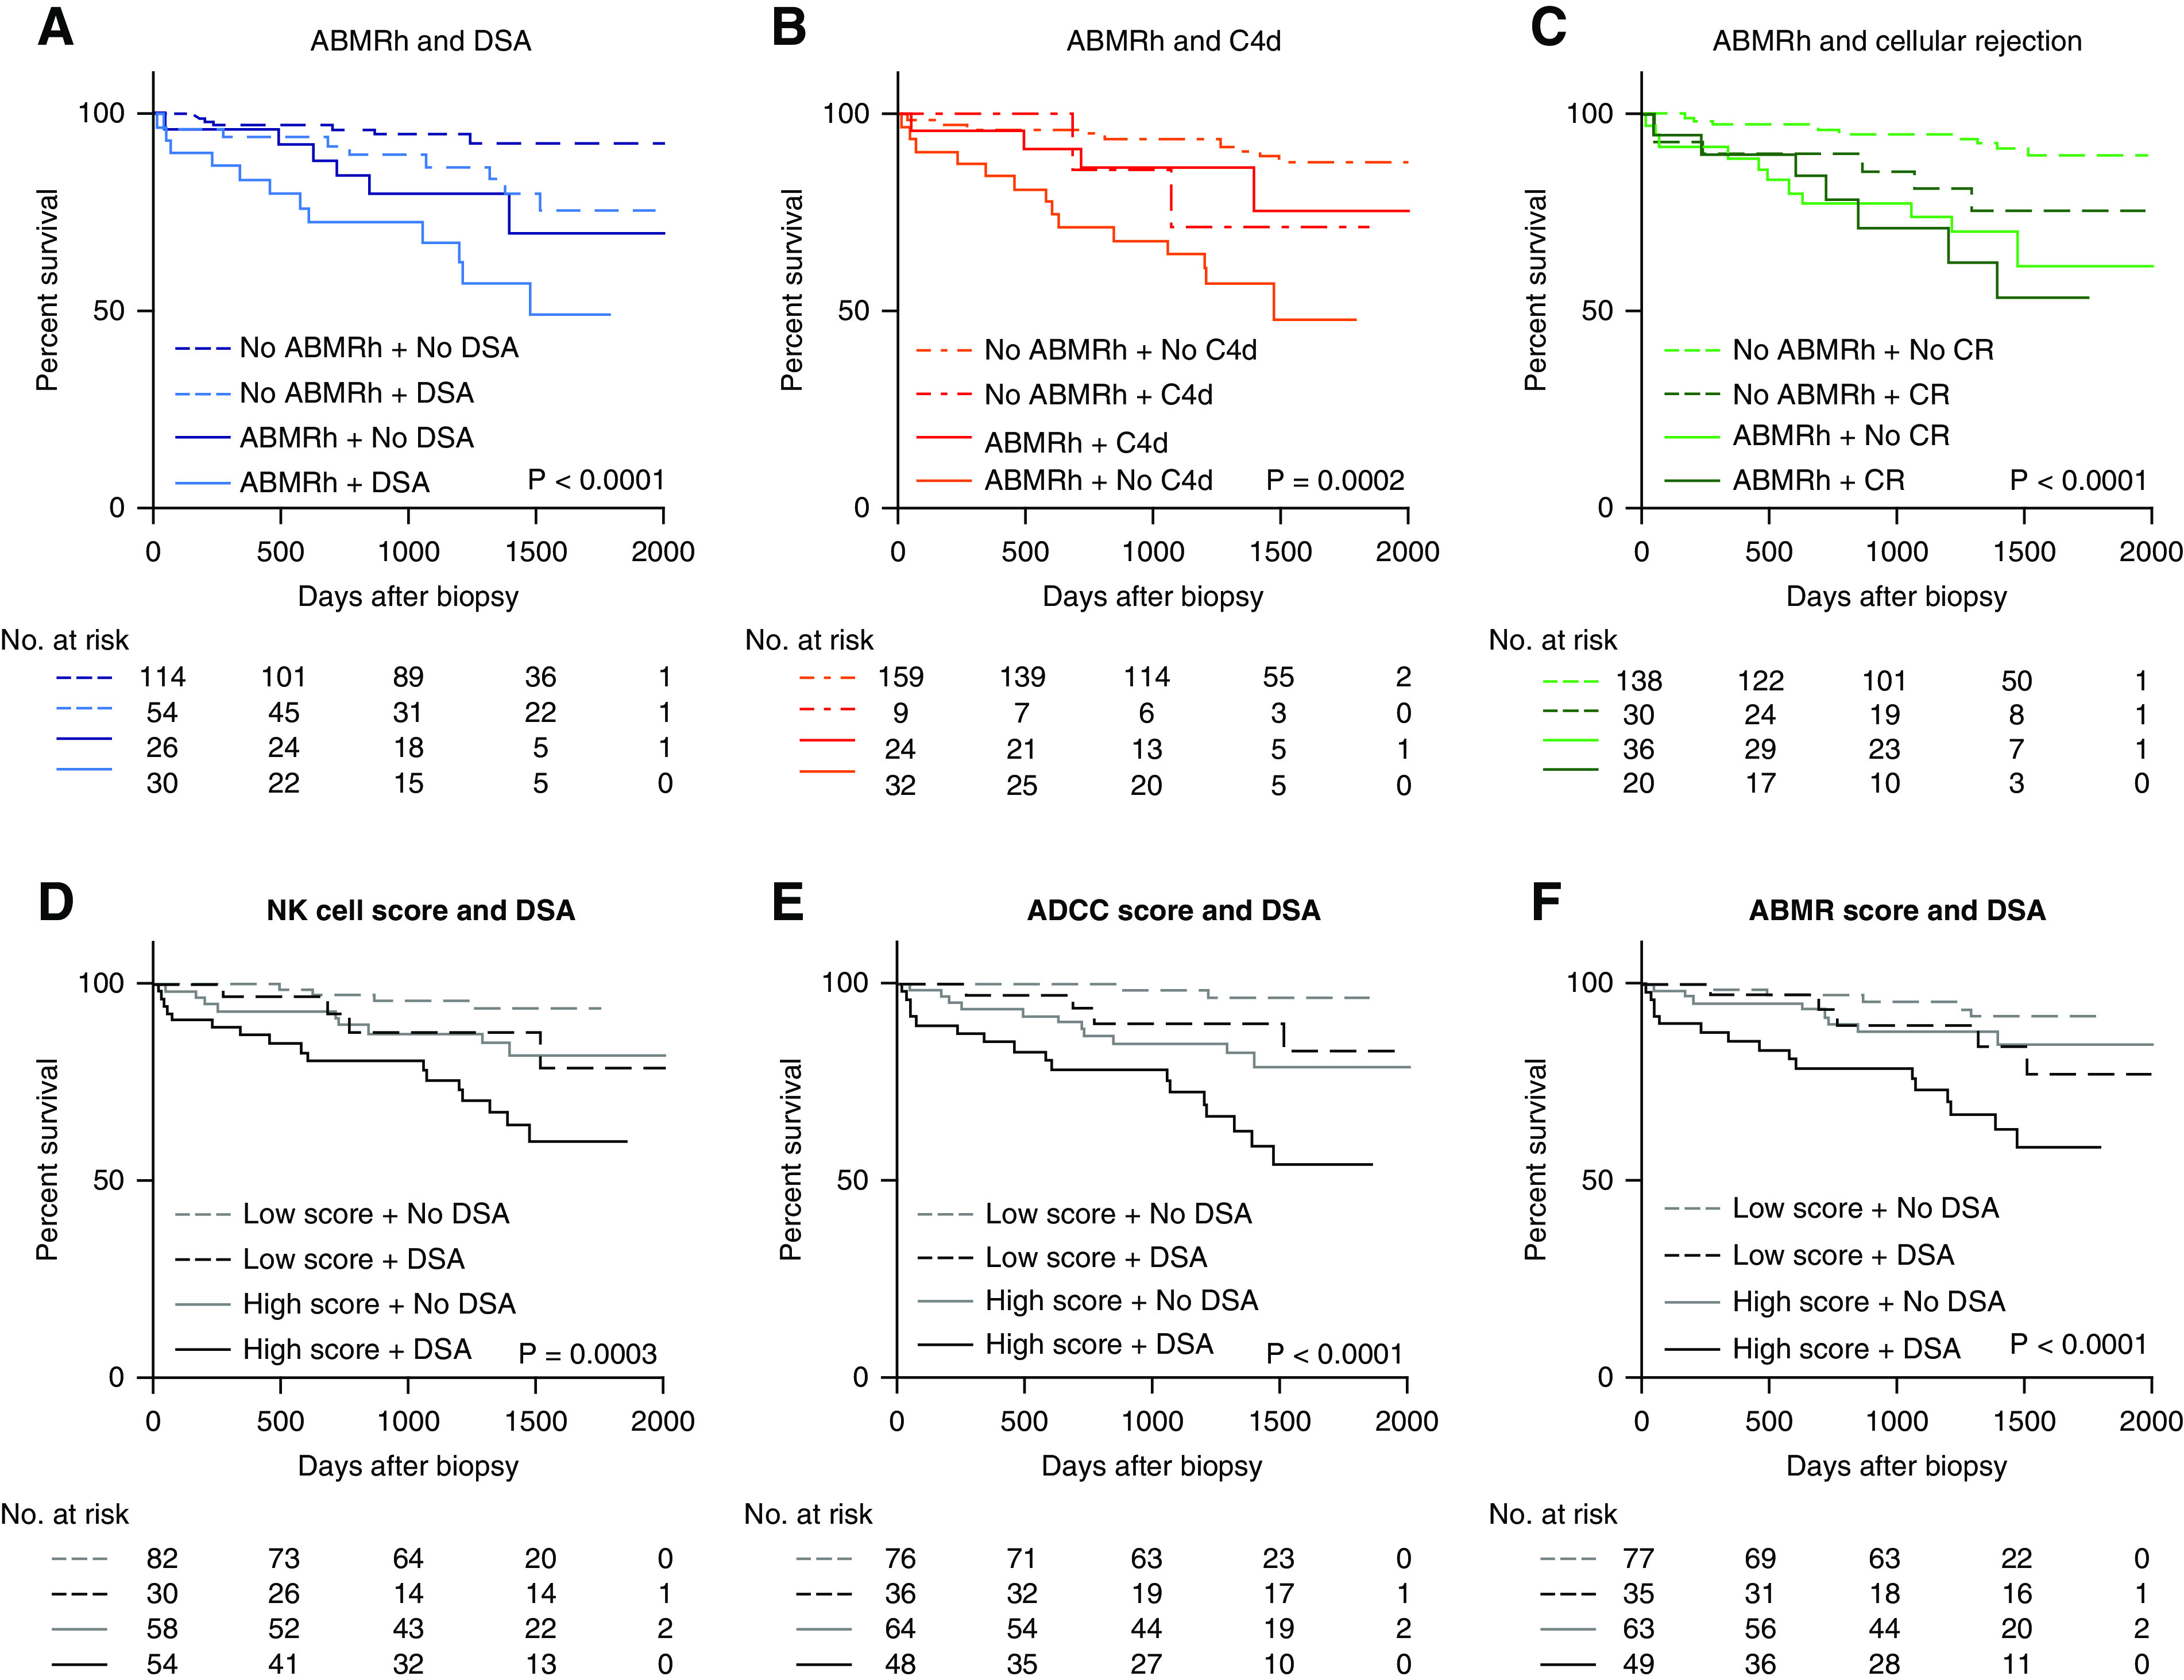
HLA-DSA status associates with worse allograft outcome after ABMRh diagnosis. (A–C) Kaplan–Meier curves of death-censored allograft survival based on ABMR histology with HLA-DSA, C4d positivity, or cellular rejection. C4d positivity is defined as a C4d score >0 by immunohistochemistry, or C4d >1 by immunofluorescence. Cellular rejection denotes borderline or TCMR. (D–F) Survival analysis based on average expression of selected gene sets and HLA-DSA. High molecular scores were defined as above the median value in the entire cohort.
Table 3.
Cox proportional hazards analysis of allograft failure (n=224)
| Factor | No. of Patients | No. of Events | Univariate Analysis | Multivariate Analysis | ||
|---|---|---|---|---|---|---|
| Hazard Ratio (95% CI) | P Value | Hazard Ratio (95% CI) | P Value | |||
| HLA-DSA ABMRh | ||||||
| No ABMRh | 168 | 16 | 1 | 1 | ||
| HLA-DSA–negative ABMRh | 26 | 6 | 2.57 (1.00 to 6.58) | 0.05a | 2.33 (0.85 to 6.33) | 0.10 |
| HLA-DSA–positive ABMRh | 30 | 12 | 5.39 (2.55 to 11.43) | <0.001a | 7.24 (3.04 to 17.20) | <0.001a |
| C4d score | 224 | 34 | 1.08 (0.74 to 1.57) | 0.69 | 0.68 (0.43 to 1.06) | 0.09 |
| Cellular rejection | ||||||
| None | 174 | 21 | 1 | 1 | ||
| Borderline | 26 | 5 | 1.72 (0.65 to 4.56) | 0.28 | 1.76 (0.66 to 4.68) | 0.26 |
| TCMR | 24 | 8 | 3.27 (1.45 to 7.39) | 0.004a | 2.09 (0.88 to 4.99) | 0.10 |
Indicates significance P values for difference between groups.
A molecular score based on the mean expression of NK cell–, ADCC-, or ABMR-associated transcripts univariately associated with graft outcome (Figure 7, D-F). ABMRh lost its prognostic significance when combined with molecular scores for ADCC and ABMR in a multivariate model (Supplemental Table 6).
Discussion
DSAs are considered pivotal in the pathogenesis of MVI of kidney allografts, but often remain undetectable in serum of patients with the histology of ABMR. In this study, we demonstrated that there are major transcriptomic alterations in biopsy specimens with ABMRh that involve pathways related to NK cell activation, crosstalk between innate and adaptive immunity, T helper cell activation, and IFN-γ signaling cascades. ABMRh was related to a specific immune cell infiltrate, hallmarked mainly by NK cells, monocytes/macrophages, and CD8+ T cells. The transcriptional picture of ABMRh was highly similar to the molecular landscapes that have been published by others in association with ABMR, which supports the robustness and relevance of ABMRh as a distinct phenotype.18,29,30 Taking into account patient HLA-DSA status, there were no transcriptomic differences between cases with and without detectable HLA-DSAs. In addition, no leukocyte subtype, estimated by CIBERSORT, could differentiate between HLA-DSA–positive and HLA-DSA–negative ABMRh groups. Although the accuracy of the CIBERSORT algorithm for intrarenal immune cell infiltration has not been validated yet, this was confirmed in an independent cohort with leukocyte subset infiltration quantified using computerized analysis of immunohistochemical staining. Despite the similar histomolecular characteristics and treatment numbers after diagnosis, the outcome of HLA-DSA–positive ABMRh was significantly worse than HLA-DSA–negative ABMRh. This suggests the outcome of ABMRh is determined by its underlying cause rather than by its histomolecular presentation.
The strength of this study lies in the deep integration of transcriptomics with extensive histologic and serologic phenotyping. To our knowledge, this is the first molecular analysis of ABMRh that studies the effect of HLA-DSA status on the biopsy specimen transcriptome. Importantly, our findings were confirmed in the GSE36059 data set described by the Edmonton group, where HLA-DSA–negative ABMRh had a similar transcriptional picture as HLA-DSA–positive ABMRh.18
The histomolecular similarity of ABMRh biopsy specimens with and without HLA-DSA could be explained by common pathophysiology. It is plausible that enrichment of similar genes in HLA-DSA–negative ABMRh biopsy specimens implies the involvement of an undetected humoral etiology. Indeed, ADCC-associated genes also correlate with severity of humoral lesions in patients who are HLA-DSA negative. The immunogenicity of genetic mismatches at non-HLA loci was supported by the higher incidence of non-HLA antibodies in mismatched patients.31,32 Moreover, non-HLA antibodies have been related to endothelial cell activation, MVI, and graft survival.13,14,33 Alternatively, HLA-DSAs may remain undetected in serum in cases of intragraft absorption or antibody production within intragraft tertiary lymphoid aggregates.34,35 In addition, the indirect pathway of allorecognition, pivotal for B cell differentiation into antibody-producing plasma cells, allows for generation of memory B cells capable of an enhanced immune response upon secondary antigen presentation even when HLA-DSAs have disappeared from the circulation.9,36–39 Nevertheless, in this study, circulating HLA-DSAs associated with worse allograft survival, confirming previously reported findings.8 It could be that non-HLA DSAs, noncirculating anti-HLA antibodies, or memory B cells are less pathogenic than circulating anti-HLA antibodies and associate with better outcomes.
To explain these differences in terms of allograft outcome, we speculate that the temporal dynamics of HLA-DSA–negative ABMRh are of relevance. Previously, our research group has shown that HLA-DSA–negative ABMRh associates with lower ABMRh recurrence and incidence of transplant glomerulopathy on sequential allograft biopsy specimens than HLA-DSA–positive ABMRh.8 The more time-constrained nature of HLA-DSA–negative ABMRh appears to cause less subsequent chronic allograft damage, and could therefore promote better outcomes. Also in this study, these chronic lesions conferred a worse outcome, concordant with this hypothesis. Future transcriptional studies could investigate this temporal aspect by longitudinal follow-up of ABMRh cases.
The differences between HLA-DSA–positive and –negative cases in ABMRh recurrence suggest that the underlying stimulus of DSA-negative ABMRh is more transient or weaker than detectable HLA-DSA. Aside from undetected humoral causes, the ABMRh phenotype could be induced by other phenomena. NK cells have been demonstrated to be essential in the pathogenesis of ABMR, but their activity can also be affected by nonhumoral stimuli.23,26,27,40–44 It was recently demonstrated that recipient NK cells, in the absence of donor HLA I–mediated stimulation of their inhibitory killer cell Ig-like receptors (i.e., “missing self”), can induce endothelial cell damage, leading to chronic vascular rejection and accelerated graft loss.16 Although some NK cell transcripts differ based on the underlying stimulus, the transcriptional profile of activated NK cells by induced self, missing self, or ADCC shows significant overlap.45 Therefore, inferring etiology of NK cell activation from expressional data may not be straightforward. We hypothesize that transient NK cell stimuli can induce similar histomolecular changes as ADCC-induced damage but render less long-term harm to the allograft given their time-constrained nature. Indeed, delayed graft function after transplantation is linked with an increased risk of allograft rejection,46 and tended to precede HLA-DSA–negative ABMRh biopsy specimens more often in this cohort.
Our findings are of relevance for classification of allograft biopsies. In the revised 2017 Banff criteria for ABMR, C4d deposition was added to HLA-DSA as an alternative third criterion. However, because neither DSA nor C4d associate with transcriptional heterogeneity within ABMRh, this study does not provide a molecular basis for the third criterion as it is currently defined. Moreover, if C4d is positive in the absence of HLA-DSA, automatic attribution to ABMR might not be appropriate in terms of allograft prognostication given the better outcome. Therefore, it seems important to avoid overinterpretation of causality based on the histologic and molecular profiles. In the absence of detectable antibodies, it might be considered to avoid starting aggressive and toxic treatment aiming at reducing antibody levels in the hope to improve outcome. The molecular signals of ABMRh do not seem to help in this aspect of clinical decision making.
Despite imperfect guidance in therapeutic decisions, our study suggests that molecular assessment of biopsy specimens can contribute to their interpretation. By interrogation of specific gene lists, ten ABMRh biopsies with a lower molecular score were consistently isolated. These ABMRh outliers had similar HLA-DSA positivity and C4d deposition as other ABMRh biopsy specimens, albeit with less MVI, less concomitant tubulointerstitial inflammation, and a leukocyte infiltration pattern resembling biopsies without ABMRh. ABMRh is a dichotomous classification which does not reflect the whole spectrum of lesions present in the biopsies. Using t-SNE informed by expression data for selective gene sets, we identified molecular heterogeneity that goes beyond separation of outliers from the main group, and better reflects the total sum of ABMR lesions. The heterogeneity within ABMRh was addressed by WGCNA, a data-mining method designed to disentangle biologic networks, which identified 37 genetic modules. Crucially, only concomitant TCMR associated with specific modules and could thus account for intragroup transcriptional variability, whereas HLA-DSA did not. This further strengthens the finding that HLA-DSA–positive and HLA-DSA–negative ABMRh cases have a high degree of transcriptional similarity.
This study has several limitations. To optimize the definition of HLA-DSA–negative ABMRh, we allocated cases with resolved HLA-DSA at the timing of biopsy to the HLA-DSA–positive group. A contemporary definition of HLA-DSA status could be more reflective of ongoing processes, although this did not influence results in our sensitivity analysis. We did not assess non-HLA antibodies in our cohort, and we had no information about consecutive allograft histology. Moreover, definition of ABMR histology in this study relies on the current Banff 2017 classification.10 Because the diagnostic criteria for rejection after kidney transplantation are a topic of active discussion, our reference standard of histology is imperfect. Relying on MVI as a more direct reflection of the histologic lesions without interpretation also did not change our conclusions. Finally, this study represents a selection of biopsy specimens, and does not represent real-life disease prevalence. Although this would not affect our conclusions, including more intermediate cases with incomplete phenotypes or overlapping phenotypes could provide additional insights in the heterogeneity within cases of ABMRh.
In conclusion, we demonstrate that ABMRh corresponds to a distinct transcriptional profile, irrespective of patient HLA-DSA status. Our data suggest that outcome after ABMRh is determined by the underlying stimulus, which is not reflected in the molecular picture. Future studies are warranted to address whether the general transcriptional signature of ABMRh derives from common humoral etiology or represents a final common pathway that can be initiated by humoral and nonhumoral factors. In ABMRh cases, therapeutic decisions should not be based solely on the histologic and molecular presentation, but all efforts should go to identifying and targeting the underlying stimulus.
Disclosures
All authors have nothing to disclose.
Funding
The BIOMARGIN study is funded by FP7 Health (Seventh Framework Programme of the European Commission), in the HEALTH.2012.1.4-1 theme of “innovative approaches to solid organ transplantation,” grant agreement no. 305499. The ROCKET study is funded by the ERAcoSysMed network via the H2020 Societal Challenges funding framework, grant reference number JTC2_29. This study is also funded by KU Leuven C3 internal grant number C32/17/049. J. Callemeyn is supported by a Fonds Wetenschappelijk Onderzoek (FWO; Research Foundation Flanders) fellowship grant 1196119N. M. Naesens and B. Sprangers are senior clinical investigators of FWO, grants 1844019N and 1842919N. P.P. Halloran reports grants from Novartis, during the conduct of the study.
Supplementary Material
Acknowledgments
We thank the clinical centers of the BIOMARGIN and ROCKET consortia, the clinicians and surgeons, nursing staff, and the patients.
Dr. Dany Anglicheau, Dr. Marie Essig, Dr. Wilfried Gwinner, Dr. Pierre Marquet, and Dr. Maarten Naesens designed the study; Dr. Ingrid Arijs, Dr. Jasper Callemeyn, Dr. Maarten Naesens, Dr. Olivier Thaunat, and Dr. Lieven Thorrez performed data analysis and interpretation; Dr. Dany Anglicheau, Dr. Henriette de Loor, Dr. Marie Essig, Dr. Wilfried Gwinner, Dr. Dirk Kuypers, Dr. Evelyne Lerut, Dr. Maarten Naesens, Dr. Frans Schuit, and Dr. Leentji Van Lommel were involved in data and sample collection for the BIOMARGIN cohort, sample extraction, quality control, and in the microarray experiments; Dr. Alice Koenig, Dr. Vannary Meas-Yedid, Dr. Jean-Christophe Olivo-Marin, and Dr. Olivier Thaunat collected and analyzed the computerized imaging data; Dr. Jessica Chang and Dr. Philip P. Halloran provided data for the external microarray cohort. The manuscript was written by Dr. Jasper Callemeyn and Dr. Maarten Naesens, and was revised by all coauthors. Dr. Marie Essig reports nonfinancial support from Astellas, grants from Gilead, other from Medincell, and nonfinancial support from Nipro, outside the submitted work. Dr. Philip P. Halloran reports personal fees from Astellas, Bristol-Meyers Squibb, and One Lambda, and other from Transcriptome Sciences Inc., outside the submitted work. Dr. Olivier Thaunat reports personal fees from Astellas, personal fees from BMS, personal fees from Novartis, and personal fees from Sandoz, outside the submitted work.
Footnotes
Published online ahead of print. Publication date available at www.jasn.org.
Supplemental Material
This article contains the following supplemental material online at http://jasn.asnjournals.org/lookup/suppl/doi:10.1681/ASN.2020030306/-/DCSupplemental.
Supplemental Table 1. Top 25 upregulated genes in ABMRh versus No ABMRh biopsies.
Supplemental Table 2. Top 25 upregulated canonical pathways in ABMRh versus No ABMRh biopsies.
Supplemental Table 3. Diagnostic accuracy of leukocyte infiltration for ABMRh subtypes.
Supplemental Table 4. Characteristics of ABMRh outliers.
Supplemental Table 5. Multivariate analysis of ABMRh, HLA-DSA, timing and chronic lesions.
Supplemental Table 6. Multivariate analysis of ABMRh, HLA-DSA and molecular scores.
Supplemental Figure 1. Differential gene expression analysis of ABMRh and microvascular inflammation with alternative grouping.
Supplemental Figure 2. Transcriptional profile of HLA-DSA negative ABMRh biopsies in the GSE36059 dataset.
Supplemental Figure 3. Leukocyte infiltration and histological lesions of ABMR in the entire population.
Supplemental Figure 4. Topological quantification of leukocyte subset infiltration by computer-assisted analysis of immunohistochemical stains in kidney allografts with microvascular inflammation.
Supplemental Figure 5. CIBERSORT estimated leukocyte infiltration in outlier ABMRh biopsies.
References
- 1.Coemans M, Süsal C, Döhler B, Anglicheau D, Giral M, Bestard O, et al.: Analyses of the short- and long-term graft survival after kidney transplantation in Europe between 1986 and 2015. Kidney Int 94: 964–973, 2018. [DOI] [PubMed] [Google Scholar]
- 2.Lamb KE, Lodhi S, Meier-Kriesche HU: Long-term renal allograft survival in the United States: A critical reappraisal. Am J Transplant 11: 450–462, 2011. [DOI] [PubMed] [Google Scholar]
- 3.Halloran PF: Immunosuppressive drugs for kidney transplantation. N Engl J Med 351: 2715–2729, 2004. [DOI] [PubMed] [Google Scholar]
- 4.Pouliquen E, Koenig A, Chen CC, Sicard A, Rabeyrin M, Morelon E, et al.: Recent advances in renal transplantation: antibody-mediated rejection takes center stage. F1000Prime Rep 7: 51, 2015. [DOI] [PMC free article] [PubMed] [Google Scholar]
- 5.Naesens M, Kuypers DRJ, De Vusser K, Evenepoel P, Claes K, Bammens B, et al.: The histology of kidney transplant failure: a long-term follow-up study. Transplantation 98: 427–435, 2014. [DOI] [PubMed] [Google Scholar]
- 6.Sellarés J, de Freitas DG, Mengel M, Reeve J, Einecke G, Sis B, et al.: Understanding the causes of kidney transplant failure: the dominant role of antibody-mediated rejection and nonadherence. Am J Transplant 12: 388–399, 2012. [DOI] [PubMed] [Google Scholar]
- 7.Racusen LC, Colvin RB, Solez K, Mihatsch MJ, Halloran PF, Campbell PM, et al.: Antibody-mediated rejection criteria - an addition to the Banff 97 classification of renal allograft rejection. Am J Transplant 3: 708–714, 2003. [DOI] [PubMed] [Google Scholar]
- 8.Senev A, Coemans M, Lerut E, Van Sandt V, Daniëls L, Kuypers D, et al.: Histological picture of antibody-mediated rejection without donor-specific anti-HLA antibodies: Clinical presentation and implications for outcome. Am J Transplant 19: 763–780, 2019. [DOI] [PubMed] [Google Scholar]
- 9.Luque S, Lúcia M, Melilli E, Lefaucheur C, Crespo M, Loupy A, et al.: Value of monitoring circulating donor-reactive memory B cells to characterize antibody-mediated rejection after kidney transplantation. Am J Transplant 19: 368–380, 2019. [DOI] [PubMed] [Google Scholar]
- 10.Haas M, Loupy A, Lefaucheur C, Roufosse C, Glotz D, Seron D, et al.: The Banff 2017 Kidney Meeting Report: Revised diagnostic criteria for chronic active T cell-mediated rejection, antibody-mediated rejection, and prospects for integrative endpoints for next-generation clinical trials. Am J Transplant 18: 293–307, 2018. [DOI] [PMC free article] [PubMed] [Google Scholar]
- 11.Worthington JE, McEwen A, McWilliam LJ, Picton ML, Martin S: Association between C4d staining in renal transplant biopsies, production of donor-specific HLA antibodies, and graft outcome. Transplantation 83: 398–403, 2007. [DOI] [PubMed] [Google Scholar]
- 12.Loupy A, Hill GS, Suberbielle C, Charron D, Anglicheau D, Zuber J, et al.: Significance of C4d Banff scores in early protocol biopsies of kidney transplant recipients with preformed donor-specific antibodies (DSA). Am J Transplant 11: 56–65, 2011. [DOI] [PubMed] [Google Scholar]
- 13.Delville M, Lamarthée B, Pagie S, See SB, Rabant M, Burger C, et al.: Early acute microvascular kidney transplant rejection in the absence of anti-HLA antibodies is associated with preformed IgG antibodies against diverse glomerular endothelial cell antigens. J Am Soc Nephrol 30: 692–709, 2019. [DOI] [PMC free article] [PubMed] [Google Scholar]
- 14.Dragun D, Müller DN, Bräsen JH, Fritsche L, Nieminen-Kelhä M, Dechend R, et al.: Angiotensin II type 1-receptor activating antibodies in renal-allograft rejection. N Engl J Med 352: 558–569, 2005. [DOI] [PubMed] [Google Scholar]
- 15.Hönger G, Cardinal H, Dieudé M, Buser A, Hösli I, Dragun D, et al.: Human pregnancy and generation of anti-angiotensin receptor and anti-perlecan antibodies. Transpl Int 27: 467–474, 2014. [DOI] [PubMed] [Google Scholar]
- 16.Koenig A, Chen CC, Marçais A, Barba T, Mathias V, Sicard A, et al.: Missing self triggers NK cell-mediated chronic vascular rejection of solid organ transplants. Nat Commun 10: 5350, 2019. [DOI] [PMC free article] [PubMed] [Google Scholar]
- 17.Sicard A, Meas-Yedid V, Rabeyrin M, Koenig A, Ducreux S, Dijoud F, et al.: Computer-assisted topological analysis of renal allograft inflammation adds to risk evaluation at diagnosis of humoral rejection. Kidney Int 92: 214–226, 2017. [DOI] [PubMed] [Google Scholar]
- 18.Sellarés J, Reeve J, Loupy A, Mengel M, Sis B, Skene A, et al.: Molecular diagnosis of antibody-mediated rejection in human kidney transplants. Am J Transplant 13: 971–983, 2013. [DOI] [PubMed] [Google Scholar]
- 19.Gentleman RC, Carey VJ, Bates DM, Bolstad B, Dettling M, Dudoit S, et al.: Bioconductor: open software development for computational biology and bioinformatics. Genome Biol 5: R80, 2004. [DOI] [PMC free article] [PubMed] [Google Scholar]
- 20.Irizarry RA, Hobbs B, Collin F, Beazer-Barclay YD, Antonellis KJ, Scherf U, et al.: Exploration, normalization, and summaries of high density oligonucleotide array probe level data. Biostatistics 4: 249–264, 2003. [DOI] [PubMed] [Google Scholar]
- 21.Ritchie ME, Phipson B, Wu D, Hu Y, Law CW, Shi W, et al.: Limma powers differential expression analyses for RNA-sequencing and microarray studies. Nucleic Acids Res 43: e47, 2015. [DOI] [PMC free article] [PubMed] [Google Scholar]
- 22.Newman AM, Liu CL, Green MR, Gentles AJ, Feng W, Xu Y, et al.: Robust enumeration of cell subsets from tissue expression profiles. Nat Methods 12: 453–457, 2015. [DOI] [PMC free article] [PubMed] [Google Scholar]
- 23.Yazdani S, Callemeyn J, Gazut S, Lerut E, de Loor H, Wevers M, et al.: Natural killer cell infiltration is discriminative for antibody-mediated rejection and predicts outcome after kidney transplantation. Kidney Int 95: 188–198, 2019. [DOI] [PubMed] [Google Scholar]
- 24.van der Maaten L, Geoffrey H: Visualizing data using t-SNE. J Mach Learn Res 9: 2579–2605, 2008 [Google Scholar]
- 25.Langfelder P, Horvath S: WGCNA: an R package for weighted correlation network analysis. BMC Bioinformatics 9: 559, 2008. [DOI] [PMC free article] [PubMed] [Google Scholar]
- 26.Hidalgo LG, Sis B, Sellares J, Campbell PM, Mengel M, Einecke G, et al.: NK cell transcripts and NK cells in kidney biopsies from patients with donor-specific antibodies: evidence for NK cell involvement in antibody-mediated rejection. Am J Transplant 10: 1812–1822, 2010. [DOI] [PubMed] [Google Scholar]
- 27.Parkes MD, Halloran PF, Hidalgo LG: Evidence for CD16a-mediated NK cell stimulation in antibody-mediated kidney transplant rejection. Transplantation 101: e102–e111, 2017. [DOI] [PMC free article] [PubMed] [Google Scholar]
- 28.Loupy A, Lefaucheur C: Antibody-mediated rejection of solid-organ allografts. N Engl J Med 379: 1150–1160, 2018. [DOI] [PubMed] [Google Scholar]
- 29.Halloran PF, Pereira AB, Chang J, Matas A, Picton M, De Freitas D, et al.: Microarray diagnosis of antibody-mediated rejection in kidney transplant biopsies: an international prospective study (INTERCOM). Am J Transplant 13: 2865–2874, 2013. [DOI] [PubMed] [Google Scholar]
- 30.Venner JM, Hidalgo LG, Famulski KS, Chang J, Halloran PF: The molecular landscape of antibody-mediated kidney transplant rejection: evidence for NK involvement through CD16a Fc receptors. Am J Transplant 15: 1336–1348, 2015. [DOI] [PubMed] [Google Scholar]
- 31.Reindl-Schwaighofer R, Heinzel A, Kainz A, van Setten J, Jelencsics K, Hu K, et al. iGeneTRAiN consortium : Contribution of non-HLA incompatibility between donor and recipient to kidney allograft survival: genome-wide analysis in a prospective cohort. Lancet 393: 910–917, 2019. [DOI] [PubMed] [Google Scholar]
- 32.Steers NJ, Li Y, Drace Z, D’Addario JA, Fischman C, Liu L, et al.: Genomic mismatch at LIMS1 locus and kidney allograft rejection. N Engl J Med 380: 1918–1928, 2019. [DOI] [PMC free article] [PubMed] [Google Scholar]
- 33.Lefaucheur C, Viglietti D, Bouatou Y, Philippe A, Pievani D, Aubert O, et al.: Non-HLA agonistic anti-angiotensin II type 1 receptor antibodies induce a distinctive phenotype of antibody-mediated rejection in kidney transplant recipients. Kidney Int 96: 189–201, 2019. [DOI] [PubMed] [Google Scholar]
- 34.Thaunat O, Patey N, Caligiuri G, Gautreau C, Mamani-Matsuda M, Mekki Y, et al.: Chronic rejection triggers the development of an aggressive intragraft immune response through recapitulation of lymphoid organogenesis. J Immunol 185: 717–728, 2010. [DOI] [PubMed] [Google Scholar]
- 35.Kerjaschki D, Regele HM, Moosberger I, Nagy-Bojarski K, Watschinger B, Soleiman A, et al.: Lymphatic neoangiogenesis in human kidney transplants is associated with immunologically active lymphocytic infiltrates. J Am Soc Nephrol 15: 603–612, 2004. [DOI] [PubMed] [Google Scholar]
- 36.Karahan GE, Krop J, Wehmeier C, de Vaal YJH, Langerak-Langerak J, Roelen DL, et al.: An easy and sensitive method to profile the antibody specificities of HLA-specific memory b cells. Transplantation 103: 716–723, 2019. [DOI] [PMC free article] [PubMed] [Google Scholar]
- 37.Bradley JA, Mowat AMI, Bolton EM: Processed MHC class I alloantigen as the stimulus for CD4+ T-cell dependent antibody-mediated graft rejection. Immunol Today 13: 434–438, 1992. [DOI] [PubMed] [Google Scholar]
- 38.Steele DJR, Laufer TM, Smiley ST, Ando Y, Grusby MJ, Glimcher LH, et al.: Two levels of help for B cell alloantibody production. J Exp Med 183: 699–703, 1996. [DOI] [PMC free article] [PubMed] [Google Scholar]
- 39.Lúcia M, Luque S, Crespo E, Melilli E, Cruzado JM, Martorell J, et al.: Preformed circulating HLA-specific memory B cells predict high risk of humoral rejection in kidney transplantation. Kidney Int 88: 874–887, 2015. [DOI] [PubMed] [Google Scholar]
- 40.Kohei N, Tanaka T, Tanabe K, Masumori N, Dvorina N, Valujskikh A, et al.: Natural killer cells play a critical role in mediating inflammation and graft failure during antibody-mediated rejection of kidney allografts. Kidney Int 89: 1293–1306, 2016. [DOI] [PMC free article] [PubMed] [Google Scholar]
- 41.Zhang Z, Huang X, Jiang J, Lau A, Yin Z, Liu W, et al.: Natural killer cells mediate long-term kidney allograft injury. Transplant 99: 916–924, 2015 [DOI] [PubMed] [Google Scholar]
- 42.Zhang Z-X, Wang S, Huang X, Min W-P, Sun H, Liu W, et al.: NK cells induce apoptosis in tubular epithelial cells and contribute to renal ischemia-reperfusion injury. J Immunol 181: 7489–7498, 2008. [DOI] [PubMed] [Google Scholar]
- 43.Stern M, Elsässer H, Hönger G, Steiger J, Schaub S, Hess C: The number of activating KIR genes inversely correlates with the rate of CMV infection/reactivation in kidney transplant recipients. Am J Transplant 8: 1312–1317, 2008. [DOI] [PubMed] [Google Scholar]
- 44.Lanier LL: Up on the tightrope: natural killer cell activation and inhibition. Nat Immunol 9: 495–502, 2008. [DOI] [PMC free article] [PubMed] [Google Scholar]
- 45.Costanzo MC, Kim D, Creegan M, Lal KG, Ake JA, Currier JR, et al.: Transcriptomic signatures of NK cells suggest impaired responsiveness in HIV-1 infection and increased activity post-vaccination. Nat Commun 9: 1212, 2018. [DOI] [PMC free article] [PubMed] [Google Scholar]
- 46.Wu WK, Famure O, Li Y, Kim SJ: Delayed graft function and the risk of acute rejection in the modern era of kidney transplantation. Kidney Int 88: 851–858, 2015. [DOI] [PubMed] [Google Scholar]
Associated Data
This section collects any data citations, data availability statements, or supplementary materials included in this article.