Significance Statement
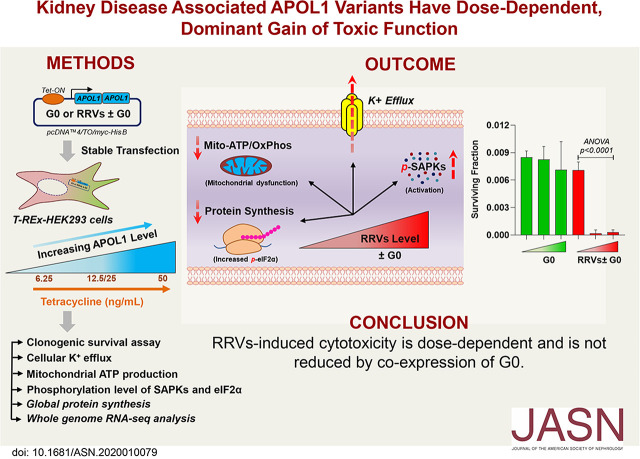
APOL1 alleles G1 and G2 are associated with high incidence and rapid progression of CKD in blacks of West African ancestry. The mechanism of APOL1 cytotoxicity is poorly understood, partly because cell-based models express variable amounts of APOL1 and yield contradictory results. Experiments using a stable human embryonic kidney cell line (HEK293) demonstrate that expression of G1 or G2 at relevant levels causes dose-dependent cytotoxicity, but the wild-type reference allele G0 does not. G0 does not reduce cytotoxicity of G1 or G2 APOL1. The mutant alleles therefore introduce a dominant toxic gain-of-function. Dose-dependent G1 or G2 cytotoxicity could explain incomplete penetrance of APOL1 nephropathy. Reducing expression of G1 or G2 could represent a therapeutic strategy for APOL1 nephropathy.
Keywords: APOL1, FSGS, African Americans, Gain of function mutation, CKD, Cytotoxicity
Visual Abstract
Abstract
Background
Two coding renal risk variants (RRVs) of the APOL1 gene (G1 and G2) are associated with large increases in CKD rates among populations of recent African descent, but the underlying molecular mechanisms are unknown. Mammalian cell culture models are widely used to study cytotoxicity of RRVs, but results have been contradictory. It remains unclear whether cytotoxicity is RRV-dependent or driven solely by variant-independent overexpression. It is also unknown whether expression of the reference APOL1 allele, the wild-type G0, could prevent cytotoxicity of RRVs.
Methods
We generated tetracycline-inducible APOL1 expression in human embryonic kidney HEK293 cells and examined the effects of increased expression of APOL1 (G0, G1, G2, G0G0, G0G1, or G0G2) on known cytotoxicity phenotypes, including reduced viability, increased swelling, potassium loss, aberrant protein phosphorylation, and dysregulated energy metabolism. Furthermore, whole-genome transcriptome analysis examined deregulated canonical pathways.
Results
At moderate expression, RRVs but not G0 caused cytotoxicity in a dose-dependent manner that coexpression of G0 did not reduce. RRVs also have dominant effects on canonical pathways relevant for the cellular stress response.
Conclusions
In HEK293 cells, RRVs exhibit a dominant toxic gain-of-function phenotype that worsens with increasing expression. These observations suggest that high steady-state levels of RRVs may underlie cellular injury in APOL1 nephropathy, and that interventions that reduce RRV expression in kidney compartments may mitigate APOL1 nephropathy.
Mechanisms by which two coding variants (G1, S342G/I384M and G2, del388N389Y) of the APOL1 gene contribute to the excess rate of nondiabetic ESKD in people of recent African descent1 are poorly understood. APOL1 G1 and G2, collectively referred to as renal risk variants (RRVs), are associated with idiopathic FSGS, HIV-associated nephropathy, and hypertension-associated ESKD.2,3 Clinical and histopathologic evidence point to podocyte injury as a central component of APOL1 nephropathy.4,5 Because of limited availability of human podocytes for research, investigators have relied on in vitro overexpression of APOL1 in mammalian cell lines to study mechanisms of APOL1 cytotoxicity. However, results from these cell-based overexpression models have been conflicting. We and other investigators demonstrated that overexpression of monoallelic G1 or G2 caused significant cytotoxic phenotypes in human embryonic kidney (HEK) cells and that G0 was either nontoxic or only marginally cytotoxic.6–11 In contrast, other investigators who used a similar HEK293 cell line reported that APOL1-induced cytotoxicity is driven primarily by degree of overexpression, independent of the variant expressed.12
In addition to determining whether cytotoxicity of APOL1 is variant- and/or dose-dependent, it is also unknown if cytotoxicity caused by RRVs in heterozygote states, such as G0G1 or G0G2, could be mitigated by G0. APOL1 nephropathy is widely associated with presence of two RRVs, yet in some individuals, single G1 or G2 alleles are sufficient to increase the risk of CKD.2,13–16 Effects of stoichiometrically expressed G0 on cytotoxicity of RRVs is unknown. Prior in vitro models focused only on effects of monoallelic G1 or G2 either in the complete absence of G0 or with partial, transient expression of G0.
On the basis of these open questions, the goal of this study is to investigate if inconsistent results from in vitro cell-based models of APOL1 is because of wide variability in the amounts of APOL1 expressed across various studies. Our hypothesis is that within relevant range of expression, only APOL1 RRVs will cause dose-dependent cytotoxicity. To test this hypothesis, we generated new tetracycline (tet)-inducible HEK293 T-REx cell lines in which incremental amounts of APOL1 expression is induced by incremental amounts of tet. This approach enables us to quantify cytotoxic phenotype caused by low, intermediate, and high expression of each APOL1 variants. We also generated tet-inducible biallelic APOL1 cells that express G0G0, G0G1, and G0G2, enabling us to gain unique insights into the potential role of the G0 protein in attenuating toxicity.
Methods
Generation of HEK293 Stable Cell Lines Expressing APOL1 Mono- or Biallelic Variants
Tet-regulated mammalian expression vector pcDNA4/TO/myc-His B (catalog number V103020; Life Technologies) was used to generate monoallelic (APOL1 G0-flag, APOL1 G1-flag, and APOL1 G2-flag) (Figure 1A) and biallelic (APOL1 G0-flag-APOL1 G0-HA, APOL1 G0-flag-APOL1 G1-HA, and APOL1 G0-flag-APOL1 G2-HA) plasmid constructs (Figure 2A). In brief, for monoallelic clones, three separate dsDNA oligos (G0-flag, G1-flag, and G2-flag) containing EcoR1 and XhoI restriction enzyme cutting sites [–EcoR1-attF-RBS-KOZAC-APOL1(G0/G1/G2)-flag-XhoI-] were synthesized by Integrated DNA Technologies. Oligos and pcDNA4/TO/myc-His B vector were double-digested separately using EcoR1 (R3101S; NEB) and XhoI (R0146S; NfEB) restriction enzymes. After ligation using T4 DNA rapid ligation kit (NEB), the ligated products were transformed into Escherichia coli DH5α competent cells (Sigma). Monoallelic plasmids were extracted from the positive clones using Qiagen Plasmid Maxi-Prep kit (Qiagen). For the biallelic clones, three separate double-stranded DNA oligos (G0-HA, G1-HA, and G2-HA) containing restriction enzyme cutting sites (-EcoR1-XhoI-2A-APOL1 (G0/G1/G2)-HA-TAA—attR-SacII-) were synthesized by Integrated DNA Technologies. Oligos and pcDNA4/TO/myc-His B vector were double-digested separately with EcoR1 (R3101S; NEB) and SacII (R0157S; NEB) restriction enzymes. Ligation, transformation, and plasmid extraction was done as described above. Next, these plasmids containing either G0-HA or G1-HA or G2-HA and the monoallelic G0-flag oligo [-EcoR1-attF-RBS-KOZAC-APOL1 (G0)-flag-XhoI-] were double-digested separately with EcoR1 (R3101S; NEB) and XhoI (R0146S; NEB) restriction enzymes and ligated. G0-flag was inserted upstream of each APOL1-HA construct to generate biallelic plasmid constructs (APOL1 G0-flag-APOL1 G0-HA, APOL1 G0-flag-APOL1 G1-HA, and APOL1 G0-flag-APOL1 G2-HA). Both mono-and biallelic plasmids were transfected into T-REx-293 cells (Thermo Fisher Scientific) and multiple clones were selected from each variant after Zeocin selection (0.4 mg/ml). Cells were validated to be free of Mycoplasma contamination. For each cell line, APOL1 expression level was checked after 8 hours of Tet induction (50 ng/ml). From each variant, five to eight clones with low and similar levels of APOL1 protein level were selected for functional studies. Biallelic clones with G0G0 and G0G1 genotypes expressed equal amounts of G0 and/or G1 proteins. Surprisingly, levels of G0 protein were always lower than G2 protein in clones with G0G2 genotype despite having equal endowment of G0 and G2 genes (Figure 2, B–D). T-REx-293 cell lines were maintained under 5% CO2, at 37°C in DMEM supplemented with 10% (vol/vol) FBS (S10350H, tet-free; Atlanta Biologicals). 0.2 mg/ml zeocin (ant-zn-1; InvivoGen), 2 µg/ml blasticidin (ant-bl-1; InvivoGen), and 1% antibiotic-antimycotic solution (30–004-CI; Corning).
Figure 1.
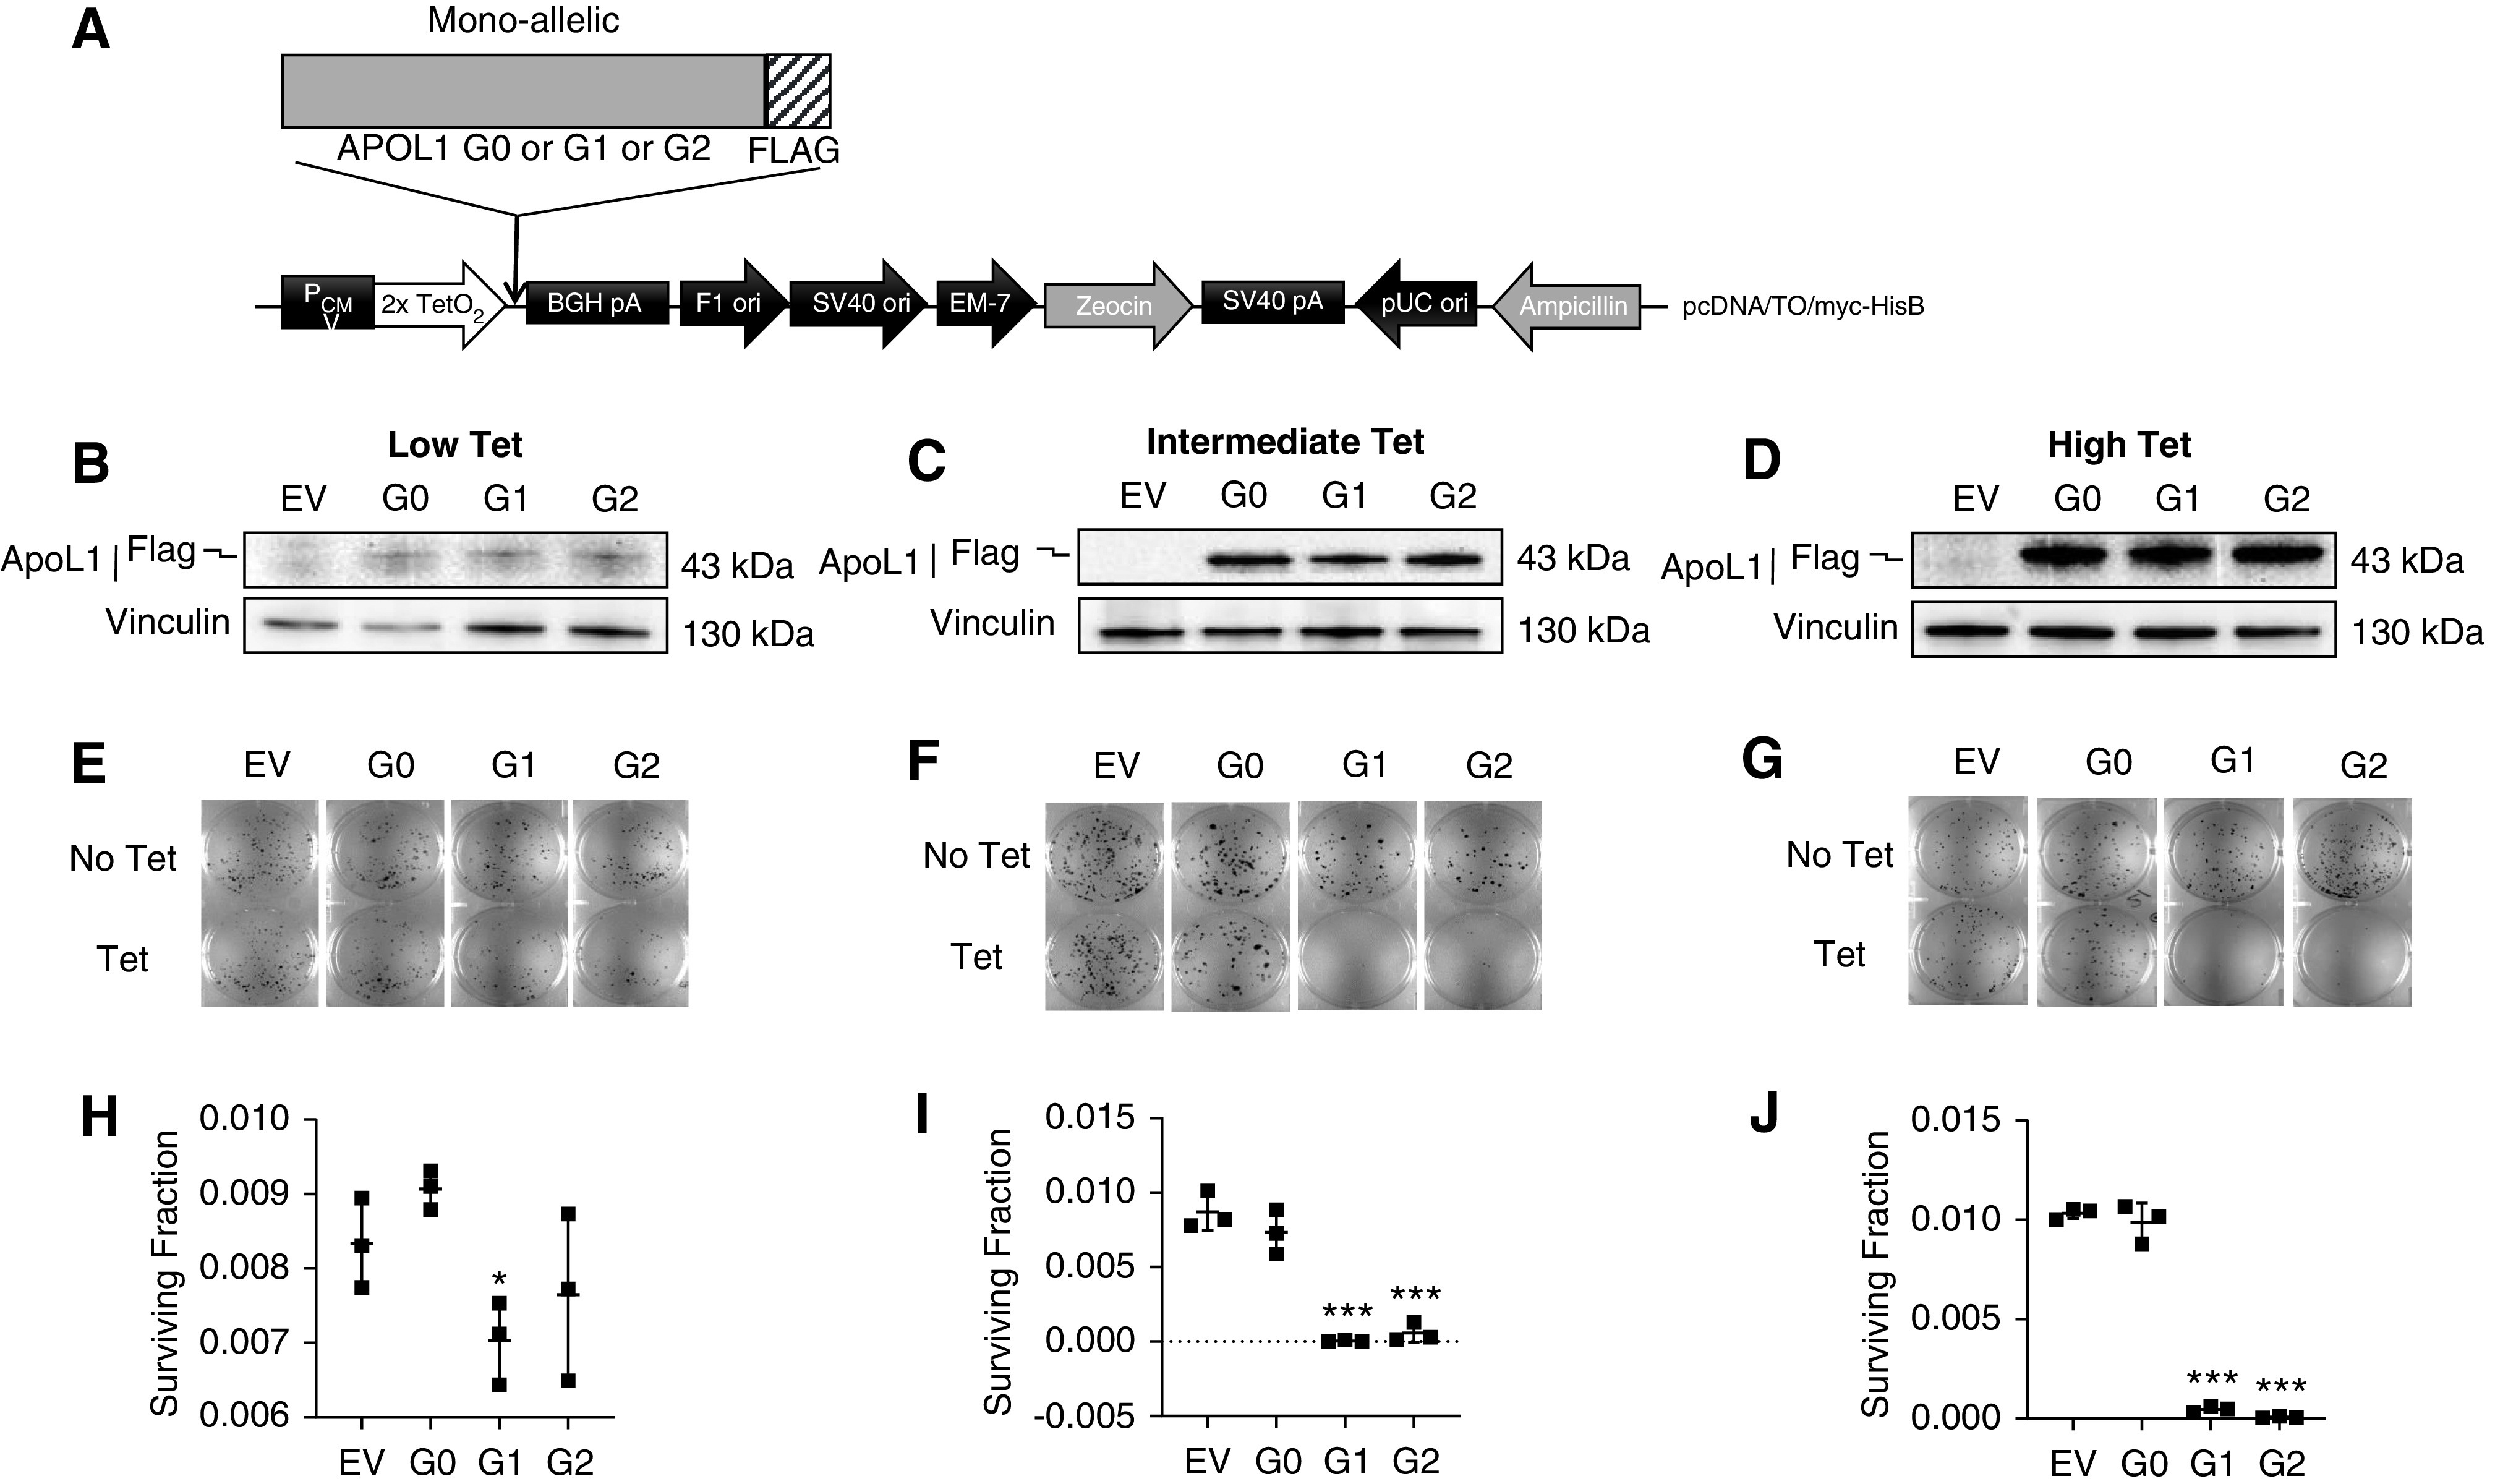
APOL1-mediated cytotoxicity is both variant- and dose-dependent. (A) Schematic representation of plasmid DNA map of tetracycline-inducible APOL1 (monoallelic, G0 or G1 or G2) expression vector stably transfected into T-REx-293 cell line. (B–D) Western blot analysis of APOL1 protein levels in monoallelic T-REx-293 clones after 8 hours of tet induction using low (6.25 ng/ml), intermediate (12.5 or 25 ng/ml), or high (50 ng/ml) tet. (E–G) Clonogenic survival assay. After 9–14 days of tet induction, cell colonies were fixed with 100% ice-cold methanol and stained with 0.5% crystal violet. Colony counting was done using Image J software. (H–J) Survival fractions were calculated (refer to Methods) and dot plots were prepared using GraphPad Prism8. Statistical significances were calculated by comparing G0 with RRVs (G1 or G2). Error bar represents SD (*P<0.01; ***P<0.001).
Figure 2.
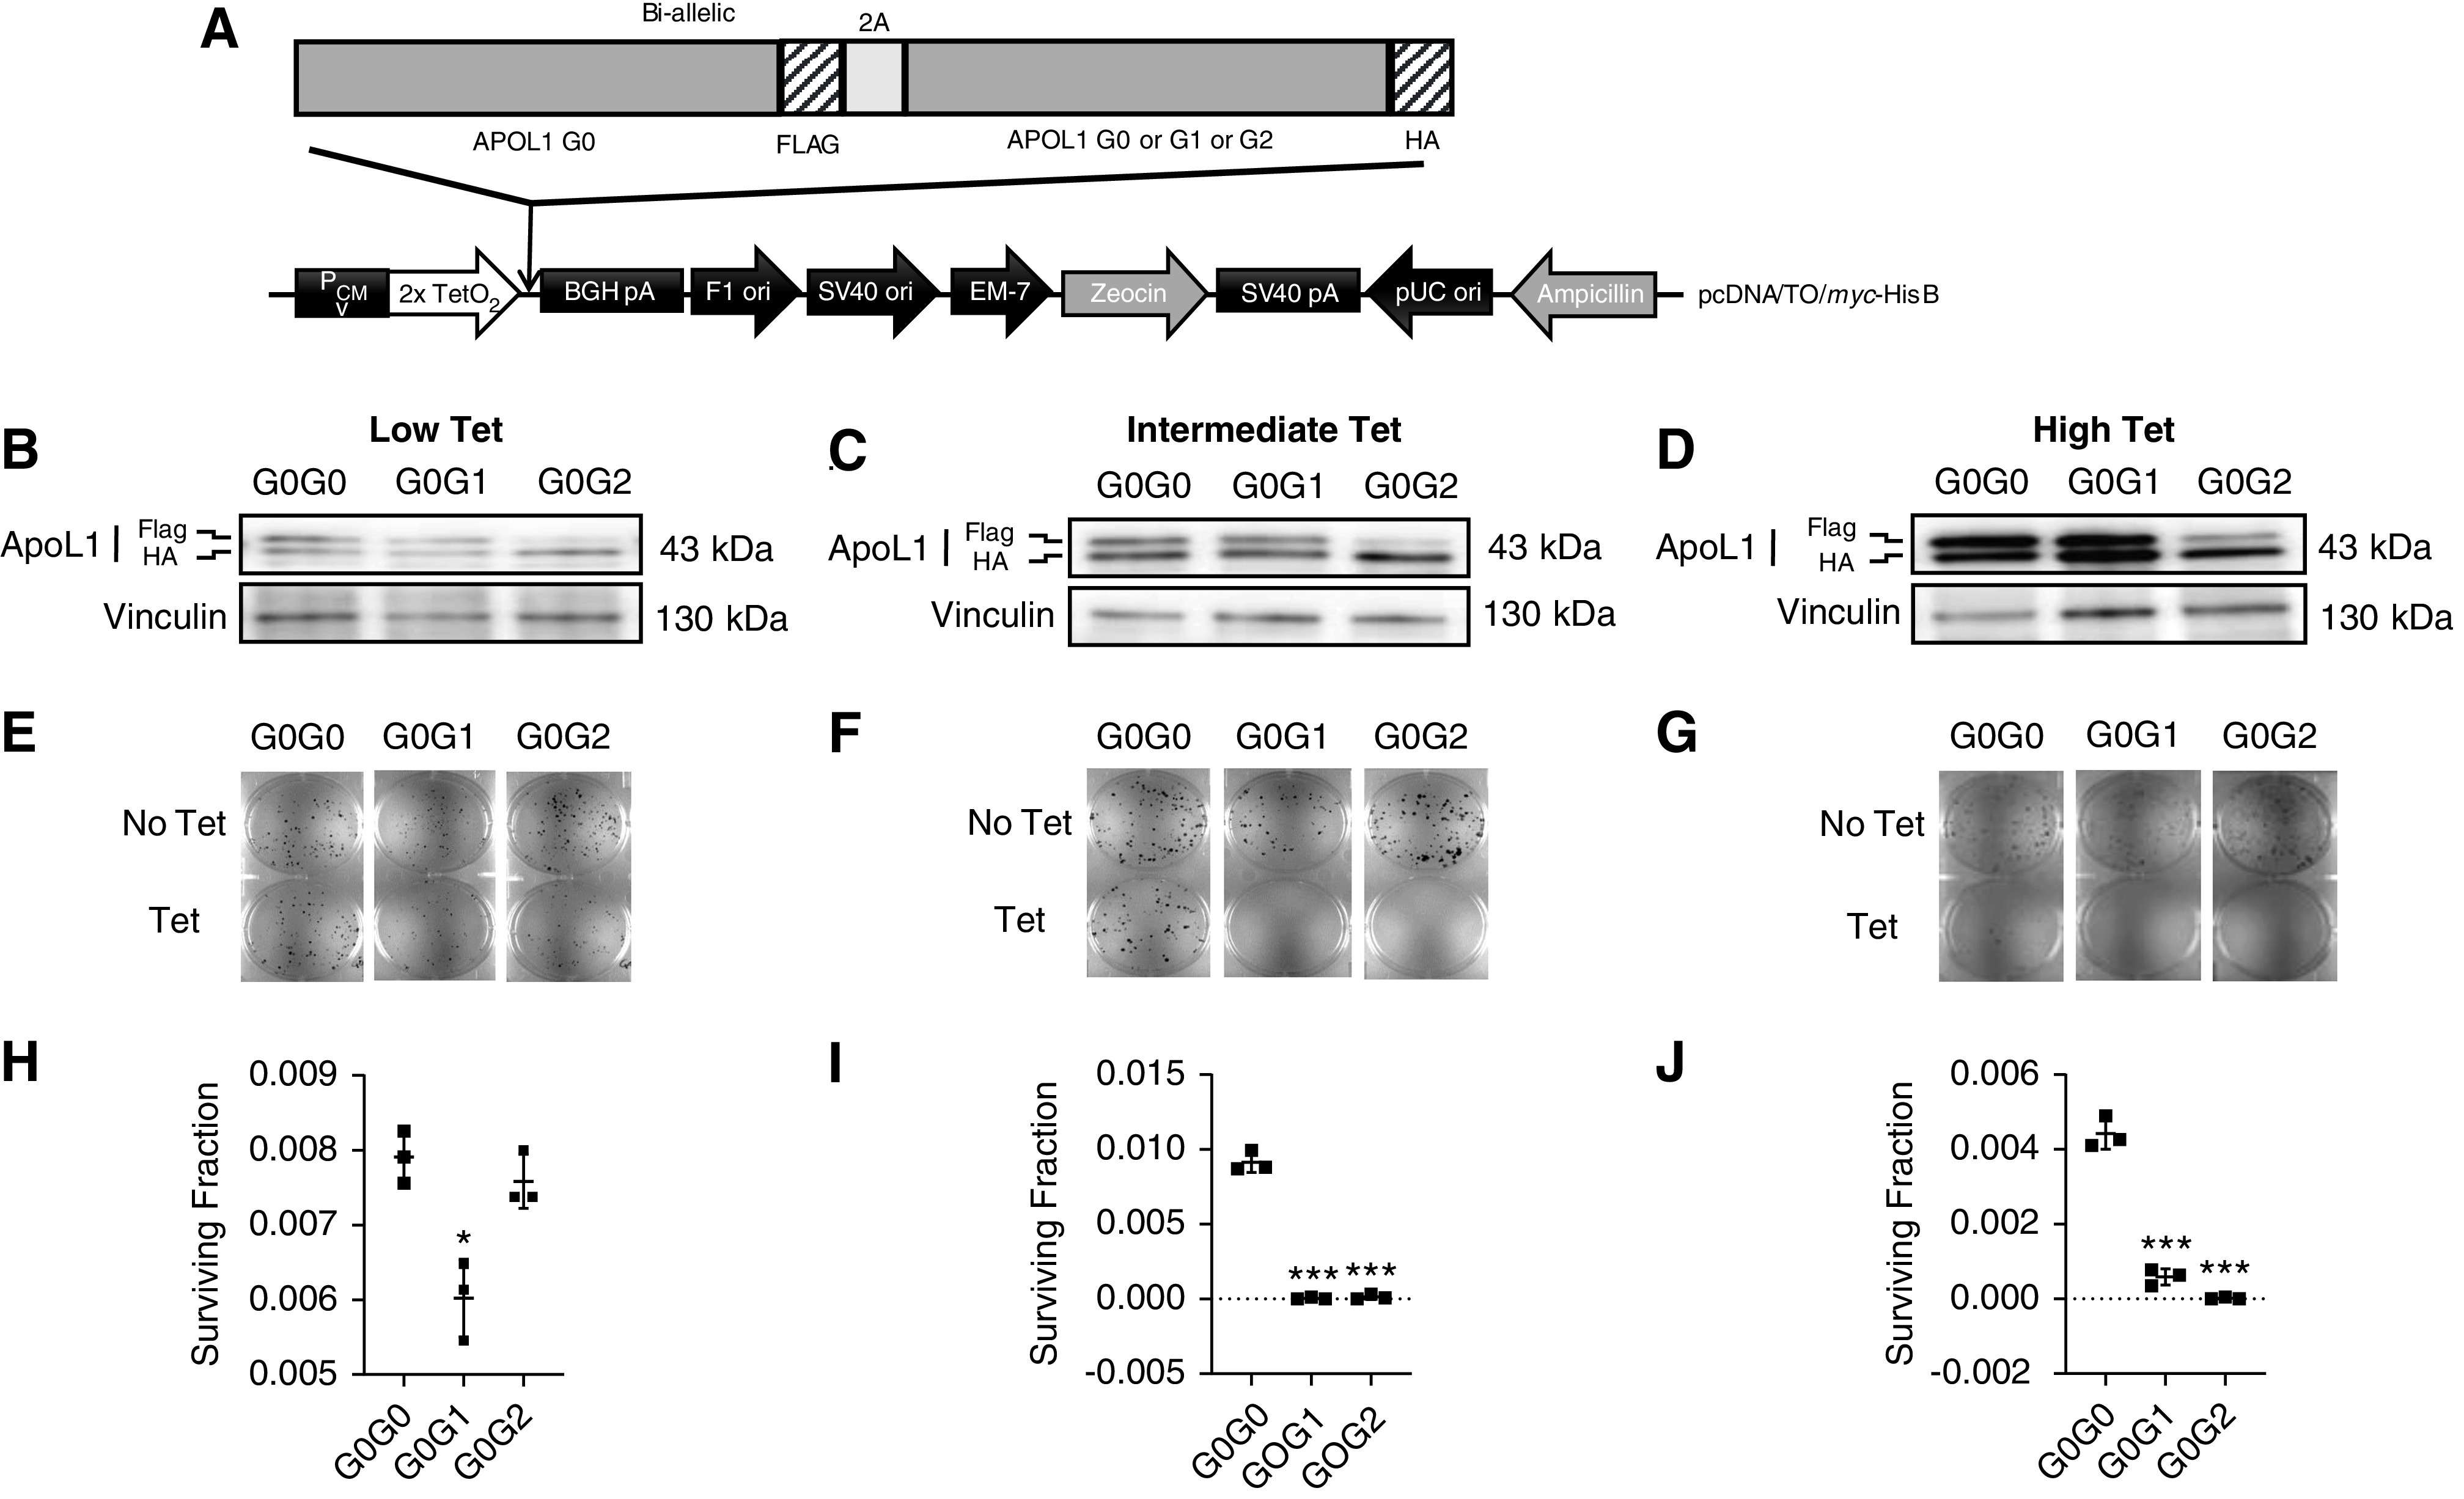
RRV-induced loss of cell viability is dominant toxic gain-of-function. (A) Schematic representation of plasmid DNA map of tetracycline-inducible APOL1 (biallelic, G0G0 or G0G1 or G0G2) expression vector stably transfected into T-REx-293 cell line. (B–D) Western blot analysis of APOL1 protein levels in monoallelic T-REx-293 clones after 8 hours of tet induction using low (6.25 ng/ml), intermediate (12.5 or 25 ng/ml), or high (50 ng/ml) tet. (E–G) Clonogenic survival assay. After 9–14 days of tet induction, cell colonies were fixed with 100% ice-cold methanol and stained with 0.5% crystal violet. Colony counting was done using Image J software. (H–J) Survival fractions were calculated (refer to Methods) and dot plots were prepared using GraphPad Prism8. Statistical significances were calculated by comparing G0G0 with either G0G1 or G0G2. Error bar represents SD (*P<0.01; ***P<0.001).
Clonogenic Survival Assay
Clonogenic survival assays were performed to estimate the level of cellular cytotoxicity in T-REx-293 clones expressing APOL1 variants. Briefly, cells containing mono- and biallelic APOL1 were plated on six-well culture dish (400 cells per well) and allowed to attach for 18–24 hours before adding tet (low, 6.25 ng/ml; intermediate, 12.5 or 25 ng/ml; and high, 50 ng/ml). For each cell line, there were three wells with tet induction and three wells with no treatment (control). Media were changed every 24 hours and cells were maintained for 9–14 days until visible colonies showed up in the control. After washing with ice-cold PBS (1×), cells were fixed with 100% ice-cold methanol (1 ml/well) for 10 minutes on ice. Next, we added 0.5% crystal violet (1 ml/well) dissolved in 25% methanol for 10 minutes at room temperature. After the wells were thoroughly rinsed, the plates were air dried and images were captured with Bio-Rad Universal Hood II Gel Doc System. Colonies were counted using ImageJ software. Plating efficiency (PE) and surviving fractions were calculated as follows: PE=(number of colonies formed/number of cells seeded)×100; Surviving fractions =(number of colonies formed after treatment)/(number of cells seeded×PE).
Cellular Swelling Assay and Live-Cell Time-Lapse Imaging
T-REx-293 cells were plated on 24-well culture plates (50,000 cells/well) and allowed to attach for 18–24 hours. Cells were treated with different doses of tet (low, 6.25 ng/ml; intermediate, 12.5 or 25 ng/ml; and high, 50 ng/ml). After 8 hours of tet treatment, cell plasma membrane was stained red using CytoPainter Cell Plasma Membrane Staining Kit (ab219942, deep red fluorescence; Abcam) and cytoplasm was stained green using CytoPainter Live Cell Labeling Kit (ab187967, green fluorescence; Abcam) according to the manufacturer instruction (https://www.abcam.com/cell-plasma-membrane-staining-kit-deep-red-fluorescence-cytopainter-ab219942.html). Live-cell imaging was done using Keyence All-in-One Fluorescence Microscope BZ-X800E and images were processed in Keyence BZ-X800 analyzer software. In another set of plates, time-lapse live-cell imaging were done in Keyence chamber at 37°C with 5% CO2, starting from 7 to 24 hours of post-tet treatment without staining. Images were taken in every 1 hour interval in Keyence All-in-One Fluorescence Microscope BZ-X800E. All the Z-stack images from every hour were processed and videos were generated using Keyence BZ-X800 analyzer software.
Measurement of Intracellular K+ Levels
Icagen XRpro x-ray fluorescence (XRF) analysis was used to measure intracellular K+ levels as previously described.6 In brief, T-REx-293 cells expressing APOL1 variants were plated on 96-well plates (100,000 cells/well) and allowed overnight for attachment. APOL1 expression was induced using intermediate (12.5/25 ng/ml) and high (50 ng/ml) doses of tet for 8 hours. After induction, culture media was removed from the plates and cells were washed once quickly using 150 mM NaCl, 5 mM glucose,1 mM MgCl2, 2 mM CaCl2, 0.8 mM NaHPO4, 0.8 mM NaH2PO4, and 25 mM HEPES (pH 7.4). Samples were subsequently frozen and stored at −80°C until shipped to Icagen (Durham, NC) on dry ice. Intracellular K+ was measured in XRF by lysing the cells for 16 hours in 0.1 ml/well of an osmotic lysis buffer containing 2.5 mM Tris-HCl, 1 mM EDTA, and 0.1 mM Na2CrO4, at pH 7.4. After lysis, samples were transferred to 384-well XRpro XRF plates at 40 µl/well and dried. XRF spectra for photon energies from 1 to 20 KeV were acquired for each well using an instrument equipped with a silicon drift detector, 30 W Mo x-ray tube, and programmable stage, followed by spectrum curve fitting to provide element signals in terms of counts. We included 0.1 mM Cr in the lysis buffer to act as an internal quantitative standard and lysate signals were converted to K+ molar concentrations by comparison of K/Cr and XRF signal intensities to standard curves. Measurements were made for four to six replicates per treatment condition.
Measurement of Real-Time ATP Production Rate
Agilent Seahorse XFp Real-Time ATP Rate Assay Kit (kit 103591–100) was used to simultaneously measure both glycolytic and mitochondrial ATP production rate in live cells. Briefly, HEK293 cells were plated on Seahorse XFp Microplates (40,000 cells/well, 96-well plates) in DMEM with10% FBS (tet-free) and incubated over night at 37°C with 5% CO2. The next day, the culture media was replaced with fresh media containing low (6.25 ng/ml), intermediate (12.5/25 ng/ml), or high (50 ng/ml) doses of tet for 8 or 24 hours in two separate microplates. At the respective time points, cells were washed twice with prewarmed XF assay-modified DMEM medium (supplemented with 10 mM XF glucose, 1 mM XF pyruvate, 2 mM XF glutamine; pH 7.4) and placed in non-CO2 incubation at 37°C for 60 minutes to pre-equilibrate the cells with the assay medium. The medium was replaced with fresh, prewarmed medium before starting the XF assay and the ATP production rate were measured according to manufacturer’s instructions (https://www.agilent.com/en/products/cell-analysis/seahorse-xfp-consumables/kits-reagents-media/seahorse-xfp-real-time-atp-rate-assay-kit#support). Both glycolytic and mitochondrial ATP production rate were analyzed using Agilent Seahorse XF Real Time ATP Rate Assay Report Generator.
Whole-Genome RNA-Sequencing and Ingenuity Pathway Analysis
Next-generation RNA-sequencing were performed by Genewiz for seven T-REx-293 cell lines (EV, G0, G1, G2, G0G0, G0G1, and G0G2). The natural APOL1 genotype of HEK293 cell is G0G0, but this endogenous APOL1 is noncontributory because its basal expression is undetectable and is not induced by tet. Briefly, 1.5×10⁶ cells were plated on 10-cm cell culture plates and attachment allowed for 18–24 hours. For the expression of APOL1 variants, tet induction was done using intermediate tet dose (25 ng/ml for all cell lines except monoallelic G1 and G2, which were induced with 12.5 ng/ml) for 8 hours. After tet induction, cells were pelleted and shipped to Genewiz on dry ice. RNA-sequencing library preparation and sequencing were performed in Illumina HiSeq4000 following multiple steps, including mRNA enrichment using Oligo-d(T) beads, mRNA fragmentation and random priming, cDNA synthesis, end repair, 5′ phosphorylation and dA-tailing, adaptor ligation, and PCR enrichment and sequencing. Sequence reads were trimmed to remove possible adapter sequences and nucleotides with poor quality using Trimmomatic v.0.36. The trimmed reads were mapped to Homo sapiens GRCh38 reference genome available on ENSEMBL using the STAR aligner v.2.5.2b. Unique gene hit counts were calculated using Subread package v.1.5.2. After extraction of gene hit counts, the gene hit counts table was used for downstream differential expression analysis. Comparative gene expression profiles between different groups were performed using DESeq2. The Wald test was used to generate P values and log2 fold changes. P value <0.05 and absolute log2 fold >1 were called as differentially expressed genes (DEGs) for the comparisons. Ingenuity pathway analysis software (Qiagen) was used to identify and analyze top canonical signaling pathways altered in-between different groups.
Western Blotting
T-REx-293 clones were induced with different tet doses for 8 hours, and then washed with PBS followed by cell lysis using 1× cell lysis buffer (10×, #9803; Cell Signaling Technology). Cell lysates were sonicated and protein lysates were collected after centrifugation at 10,000 rpm for 10 minutes at 4°C. Samples were boiled for 5 minutes at 100°C in 1× sample buffer containing β-mercaptoethanol, and 20–30 µg protein samples were resolved using precast gels (Bio-Rad). Separated proteins were transferred from gel to PVDF membrane using Trans-Blot Turbo Transfer System (Bio-Rad). Membrane blocking was done using 5% (wt/vol) nonfat milk (M0842; LabScientific) in 1× TBST (IBB-181; Boston BioProducts) and primary antibodies were incubated overnight at 4°C. The following primary antibodies were used: anti-APOL1 (mouse, #66124–1-Ig; Proteintech); anti-vinculin (mouse, #V9131; Sigma-Aldrich); anti–phospho-eIF2α (Ser51) (rabbit mAb #3398; Cell Signaling Technology); anti-eIF2α (rabbit, #9722; Cell Signaling Technology); anti–phospho-p38 MAPK (Thr180/Tyr182) (rabbit mAb #4511; Cell Signaling Technology); anti–phospho-SAPK/JNK (Thr183/Tyr185) (rabbit mAb #4668; Cell Signaling Technology); anti–β-actin (mouse, sc-130300; Santa Cruz Biotechnology). Company-recommended dilutions were used for all the antibodies. HRP-conjugated secondary antibodies (anti-mouse IgG, HRP-linked antibody #7076, anti-rabbit IgG, HRP-linked antibody #7074; Cell Signaling Technology) were used for 60 minutes at room temperature. The membranes were developed using SuperSignal West Dura Extended Duration Substrate (#34075; Thermo Fisher Scientific) and imaging was done in FluorChem E (ProteinSimple). Densitometric analysis was performed using AlphaView SA software (ProteinSimple).
Puromycin Incorporation Assay
Surface sensing of translation, a nonradioactive method to monitor protein synthesis, was used to measure the rate of protein synthesis.17 T-REx-293 clones were induced with different tet doses (no tet; intermediate tet, 12.5 or 25 ng/ml; and high tet, 50 ng/ml) for 8 hours and then incubated 10 minutes with puromycin (10 μg/ml). Cells were washed with PBS followed by cell lysis using 1× cell lysis buffer (10×, #9803) and immunoblotting was done as discussed above, using anti-puromycin antibody Alexa Fluor 488 (MABE343; Sigma) and anti–β-actin (mouse, sc-130300).
Duolink In Situ Proximity Ligation Assay
To determine the interaction between APOL1 variants, Duolink in situ proximity ligation assay (PLA) was performed according to manufacturer’s protocol (Duolink In Situ Red Starter Kit Mouse/Rabbit; Sigma-Aldrich). The assay mechanism is on the basis of the binding of a pair of PLA probes (Anti-Rabbit PLUS and Anti-Mouse MINUS) to specific primary antibodies (one in rabbit and another in mouse). If two proteins interact with each other or they are closer than 40 nm, the PLA probes ligate and form a circle DNA template for rolling-circle amplification with red fluorescence signals. In brief, T-REx HEK 293 biallelic clones were plated on eight-well chamber slides (10,000 cells/well; Thermo Fisher Scientific) and allowed to attach for 18–24 hours. After tet induction for 8 hours with intermediate (12.5/25 ng/ml) and high dose (50 ng/ml), cells were rinsed three times with PBS and fixed in 4% paraformaldehyde for 10 minutes. Permeabilization was done using 0.5% Triton X-100 for 5 minutes. All the steps, including blocking, primary antibody binding, PLA probing, ligation, and amplification steps, were performed in a humidity chamber. Primary antibodies (5 µg/ml, anti-Flag rabbit, #F7425; Sigma-Aldrich and 1 µg/ml, anti-HA mouse, #H3663; Sigma-Aldrich) were incubated for overnight at 4°C. Final images were taken in Keyence All-in-One Fluorescence Microscope BZ-X800E and the images were processed in Keyence BZ-X800 analyzer software.
Statistical Analyses
Statistical significance for the normally distributed data were done using t test in GraphPad Prism 8 by comparing means of two groups, such as empty vector (EV) versus G0, EV versus G1, or G0G0 versus G0G1, etc. Data mean and SD from at least three independent measurement were estimated (if not otherwise indicated).
Results
Monoallelic APOL1 Cause Variant- and Dose-Dependent Loss of Cell Viability
We sought to determine if cytotoxicity associated with overexpressed APOL1 is variant-dependent, dose-dependent, or both. After determining concentrations of tet that induced similar expression of APOL1 protein across T-REx clones (Figure 1, Supplemental Figure 1), we treated cells with low (6.25 ng/ml), intermediate (12.5 or 25 ng/ml), or high (50 ng/ml) doses of tet for 9–14 days and then measured cell viability by clonogenic survival assay. A significant loss in cell viability were observed only with intermediate and high expression of RRVs, whereas comparable levels of G0 had no effect (1, E–J). Notably, lowest expression of G1 also caused marginal toxicity whereas G2 did not (Figure 1, E and H). Together these results support the conclusion that at moderate expression levels, only monoallelic RRVs cause cytotoxicity, and that cytotoxicity is dose-dependent.
RRV-Induced Loss of Cell Viability Is Not Reduced by G0
Cytotoxicity of RRVs is consistent with toxic gain-of function. We hypothesized that if this toxic gain-of function is a dominant trait, then it will not be reduced by G0 coexpression. To investigated if G0 blocks RRV-induced loss of cell viability. We found a significant loss of cell viability with intermediate and high expression levels of G0G1 and G0G2, whereas intermediate level of G0G0 had no effect (Figure 2). Low expression of G0G1 also caused a small but significant loss of cell viability (Figure 2, E and H). As discussed in the Methods section, despite equality at DNA level, more G2 protein was expressed relative to G0 protein in G0G2 clones. This phenomenon, which is under active investigation, limits interpretation of results from G0G2 cell lines (Figure 2, B–D). High expression of G0G0 modestly reduced cell viability not seen with intermediate expression of G0G0 (Figure 2). Because naturally occurring G0G0 genotype is not associated with clinical disease, we surmised that high expression of G0G0 in the current model represents supraphysiologic expression. Together, these results support the conclusion that cytotoxicity of RRVs is a dose-dependent, dominant (at least for G1) toxic gain-of- function.
RRV-Induced Cellular Swelling Is Not Reduced by G0
Given the dominant (at least for G1) dose-dependent effect of RRVs on cell viability, we asked if RRVs also alter other cellular manifestations of APOL1 cytotoxicity. We6 and other investigators8,9,18 previously reported that cellular swelling is an early manifestation of RRV-induced cytotoxicity and precedes loss of cell viability. Here, also we found that intermediate and high expression of G1 or G2, but not G0, caused significant cell swelling as indicated by cell areas >150 µm2 (Figure 3A, Supplemental Figure 2). Low expression of G0, G1, or G2 did not cause cellular swelling (data not shown). These results are consistent with cellular swelling being both RRV-dependent and dose-dependent. Similar to results from monoallelic cell lines, intermediate and high expression of G0G1 or G0G2, but not G0G0, caused significant cell swelling (Figure 3B, Supplemental Figure 2). Results from static live-cell imaging were corroborated by time-lapse live-cell imaging (Supplemental Videos 1–6). Together, these results strongly support the conclusion that cellular swelling is RRV-dependent, dose-dependent, and dominant (at least for G1).
Figure 3.
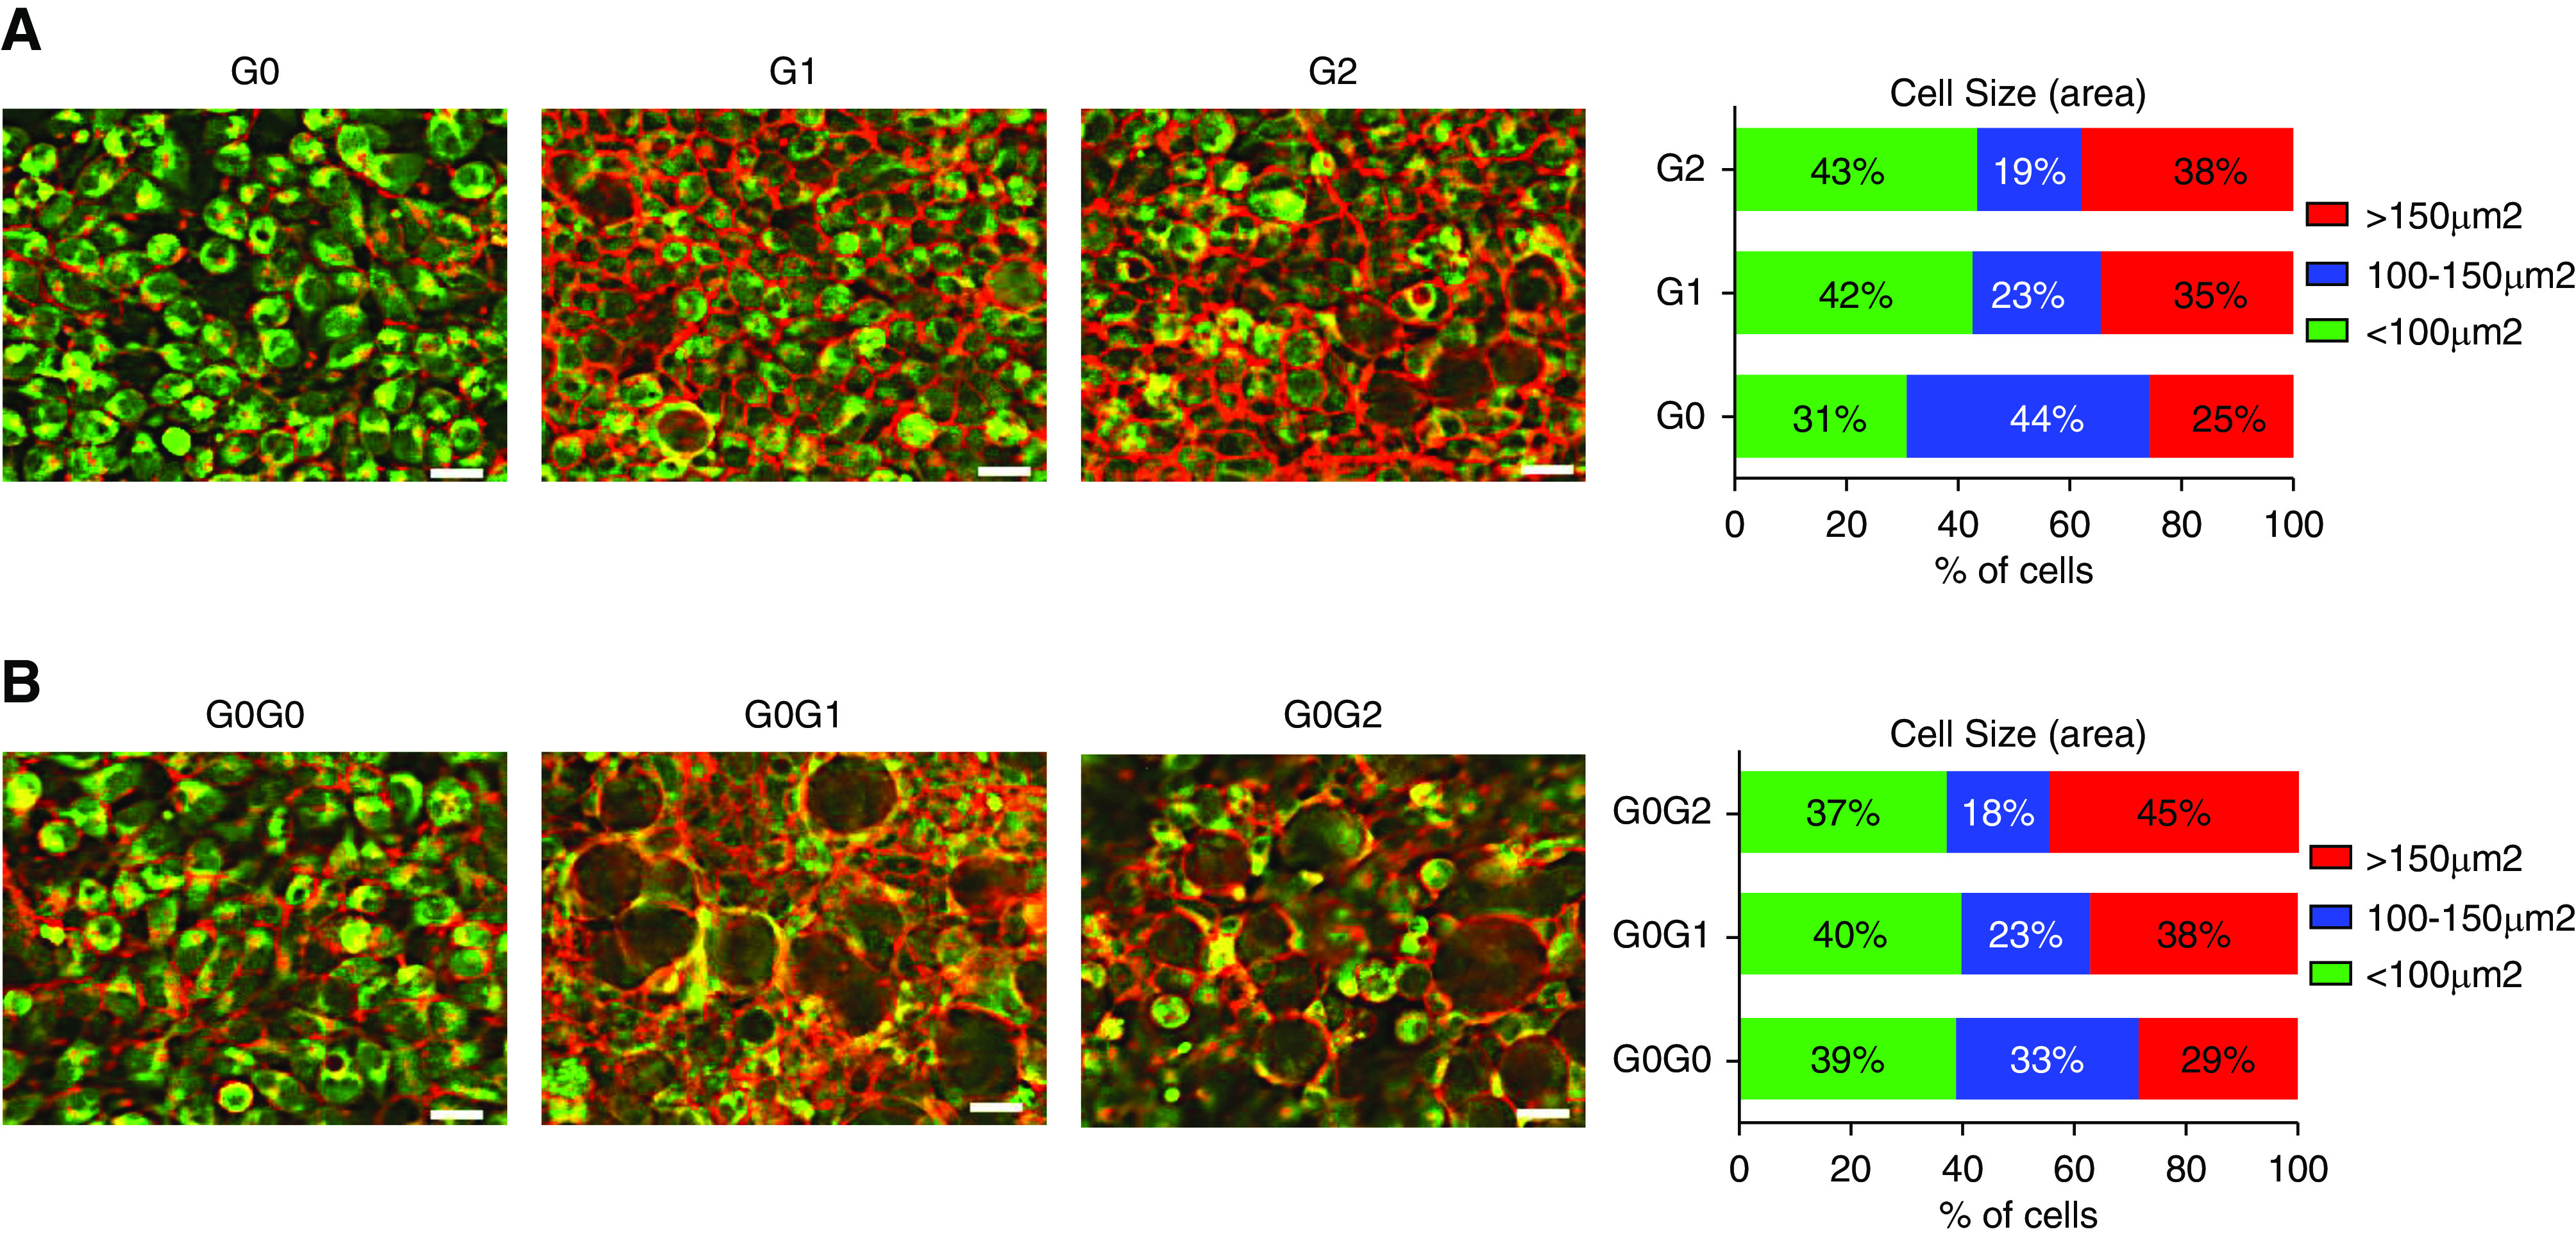
Coexpression of APOL1 G0 does not protect against RRV-induced cellular swelling. (A and B) T-REx-293 cells were treated with intermediate tet dose (12.5 or 25 ng/ml) for 8 hours and stained with red fluorescence for plasma membrane (ab219942) and green fluorescence for cytoplasm (ab187967) according to manufacturer’s instruction. Live-cell imaging was done using Keyence microscope (scale bar, 20 μm). Different cell sizes were counted using the BZ-X800 analyzer software and plotted in GraphPad Prism8 software.
RRV-Induced Potassium Efflux or Activation of Stress-Activated Protein Kinases Is Not Reduced by G0
Previously, we reported that expression of RRVs in HEK cells resulted in cellular loss of potassium followed by induction of stress-activated protein kinases (SAPKs) p38 and JNK.6 Other investigators have confirmed these findings.18 We interpreted these intracellular events as part of the mechanisms that mediate RRV-induced cytotoxicity. However, a recent report suggested that these manifestations may be artifacts of APOL1 overexpression without variant-dependent differences.12 Here, we seek to clarify the contribution of APOL1 variants and dose to potassium efflux and aberrant activation of SAPKs. We found that 8 hours of intermediate and high expression of RRVs, but not of G0, resulted in significant loss of cellular potassium (Figure 4, A and B). Intermediate coexpression of G0 appears to blunt potassium loss in G0G1. At 8 hours, G0G0 did not cause potassium loss. However, 24 hours of high expression of G0G0 increased potassium loss (Figure 4B). At 8 hours, high expression of G1, G2, G0G1, or G0G2 increased phosphorylation of SAPK (Figure 4, C and D, Supplemental Figure 3). Taken together, these results demonstrate that RRV-induced potassium loss and SAPKs phosphorylation are also dominant traits.
Figure 4.
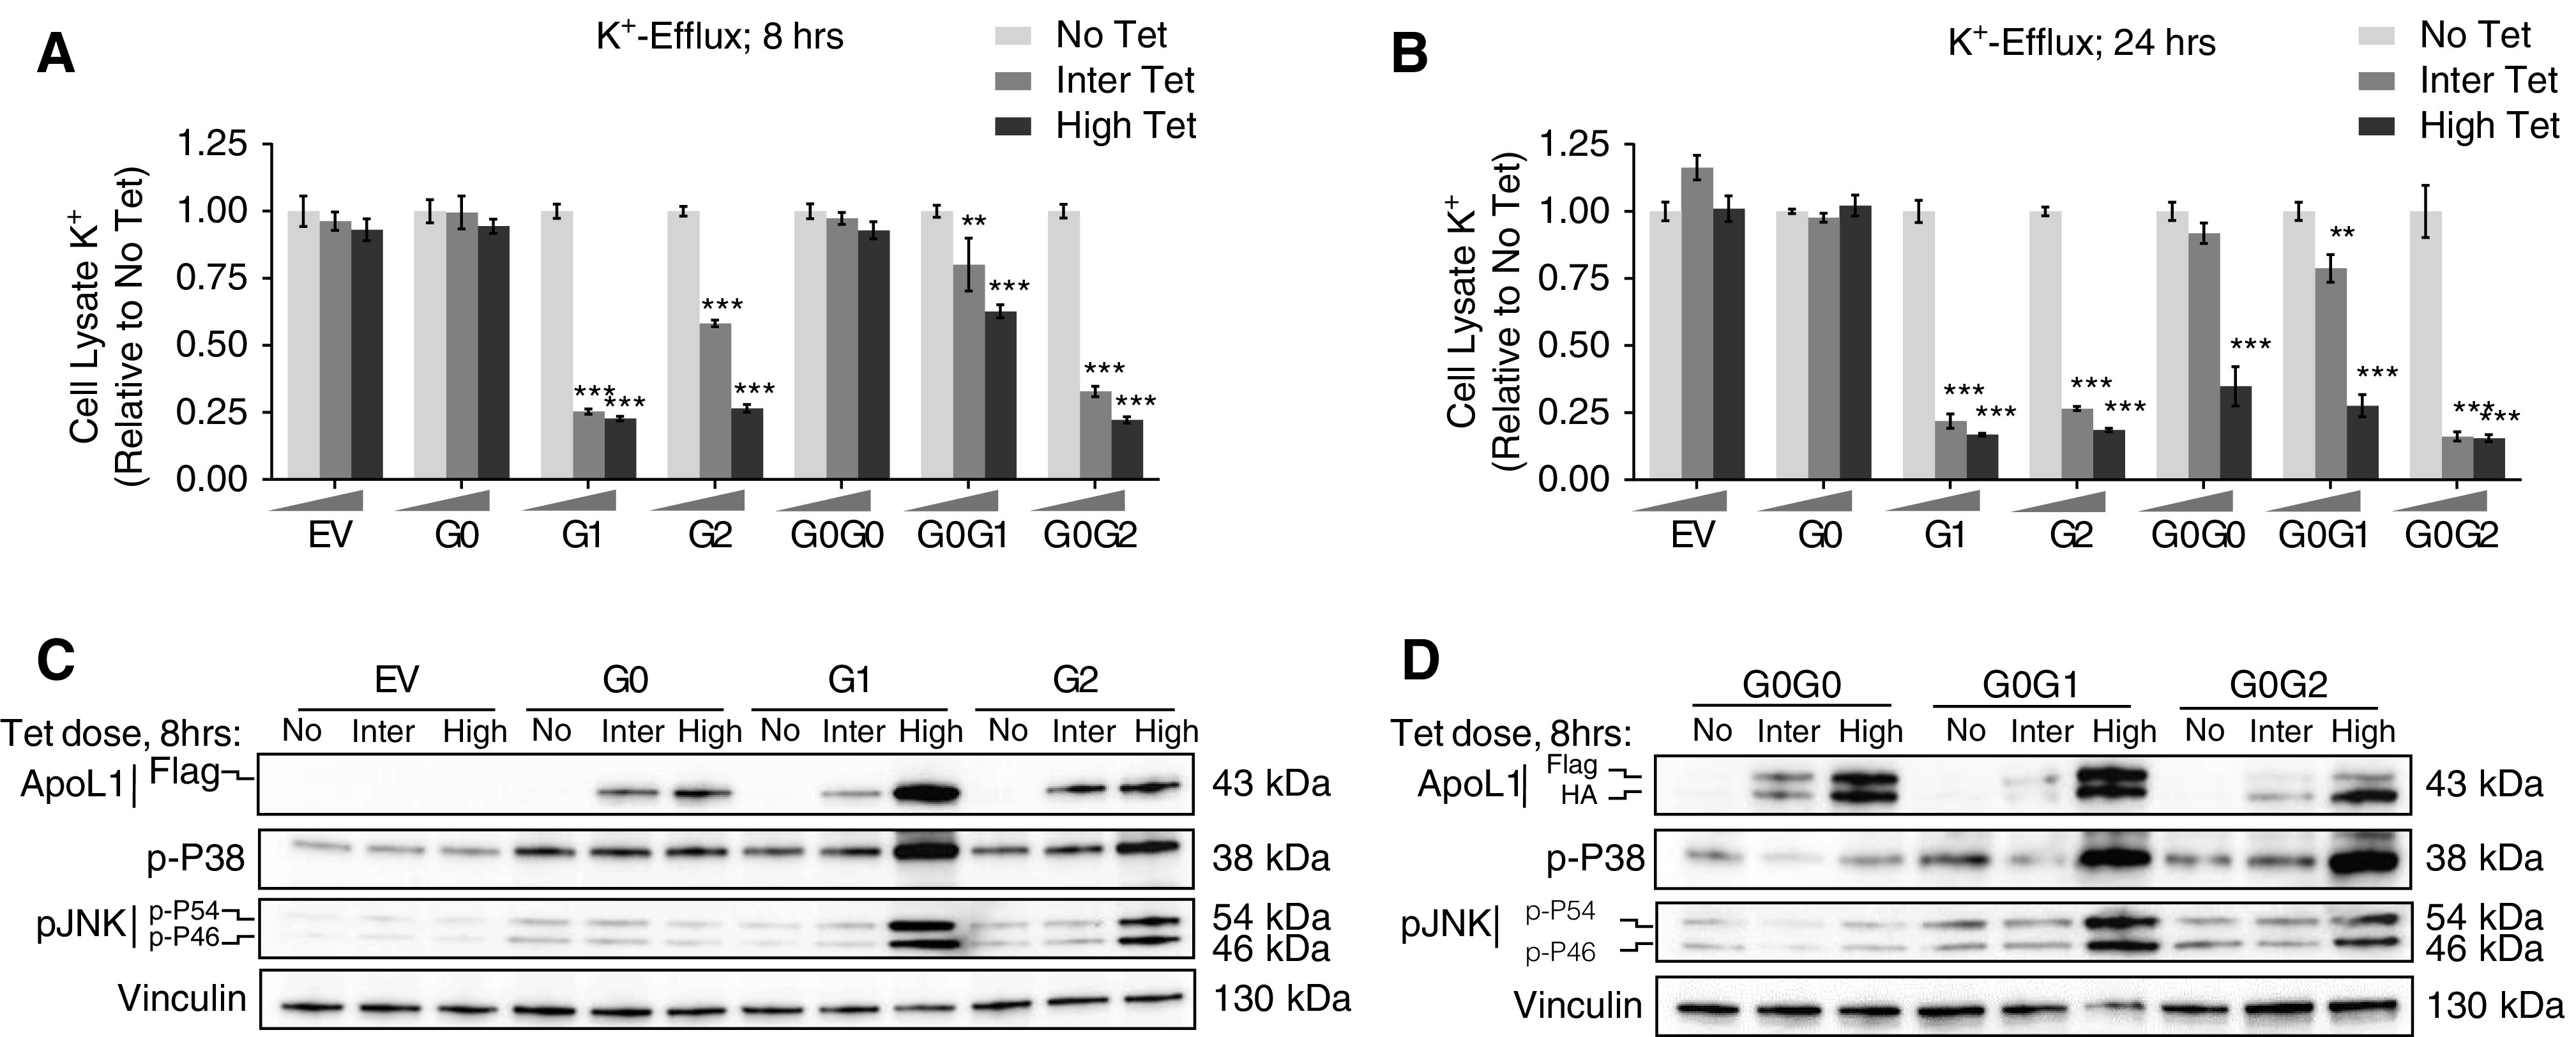
RRV-induced K+ efflux and activation of SAPKs are not blocked by G0. (A and B) T-REx-293 cells were treated with either high (50 ng/ml) or intermediate tet dose (12.5 or 25 ng/ml) or no tet for 8 and 24 hours. Intracellular K+ level was measured in XRpro XRF instrument using an internal quantitative standard. Average signal of four to six replicates per treatment conditions for both monoallelic and biallelic clones were used to represent final estimation. Bar diagrams were prepared using GraphPad Prism8. Statistical significances were calculated by comparing “No Tet” group with either “Inter Tet” or “High Tet”. Error bar represents SD. **P<0.001; ***P<0.001. (C and D) Western blot analysis of APOL1 protein level, phosphorylation level of P38 and JNK (p-P54 and p-P46) in cell lysates extracted from T-REx-293 monoallelic and biallelic clones after 8 hours of tet induction: no treatment, intermediate (12.5/25 ng/ml), or high (50 ng/ml) tetdose.
Whole-Genome Transcriptome Analysis Shows Variant-Dependent, Dominant Gain-of-Signaling Function
To begin to gain insight into variant-dependent effects of APOL1 expression on cell function and survival, we performed comprehensive transcriptomic analyses of T-REx clones using intermediate tet dose. Differential gene expression in all six cell lines relative to EV control is summarized in Supplemental Figure 4 and Supplemental Table 1. Relative to EV control, an average of 17,000 genes were differentially expressed in each of the six cell lines. A majority of these transcripts (14,698) are common to G0, G1, or G2. Figure 5A summarizes the DEGs across the six groups. We found that G1 or G2 expression caused more significant (P<0.05 and log2 fold change >1) changes in transcript levels relative to EV controls than did G0 (599, 469, and 98, respectively; Supplemental Figure 4, Supplemental Table 1). Similarly, there were more significant DEGs in G0G1 (471) or G0G2 (521) than in G0G0 (288)-expressing cells (Supplemental Figure 4, Supplemental Table 1). These results suggest that expression of RRVs induced broader changes in transcriptomic profile than did G0 in this cell system.
Figure 5.
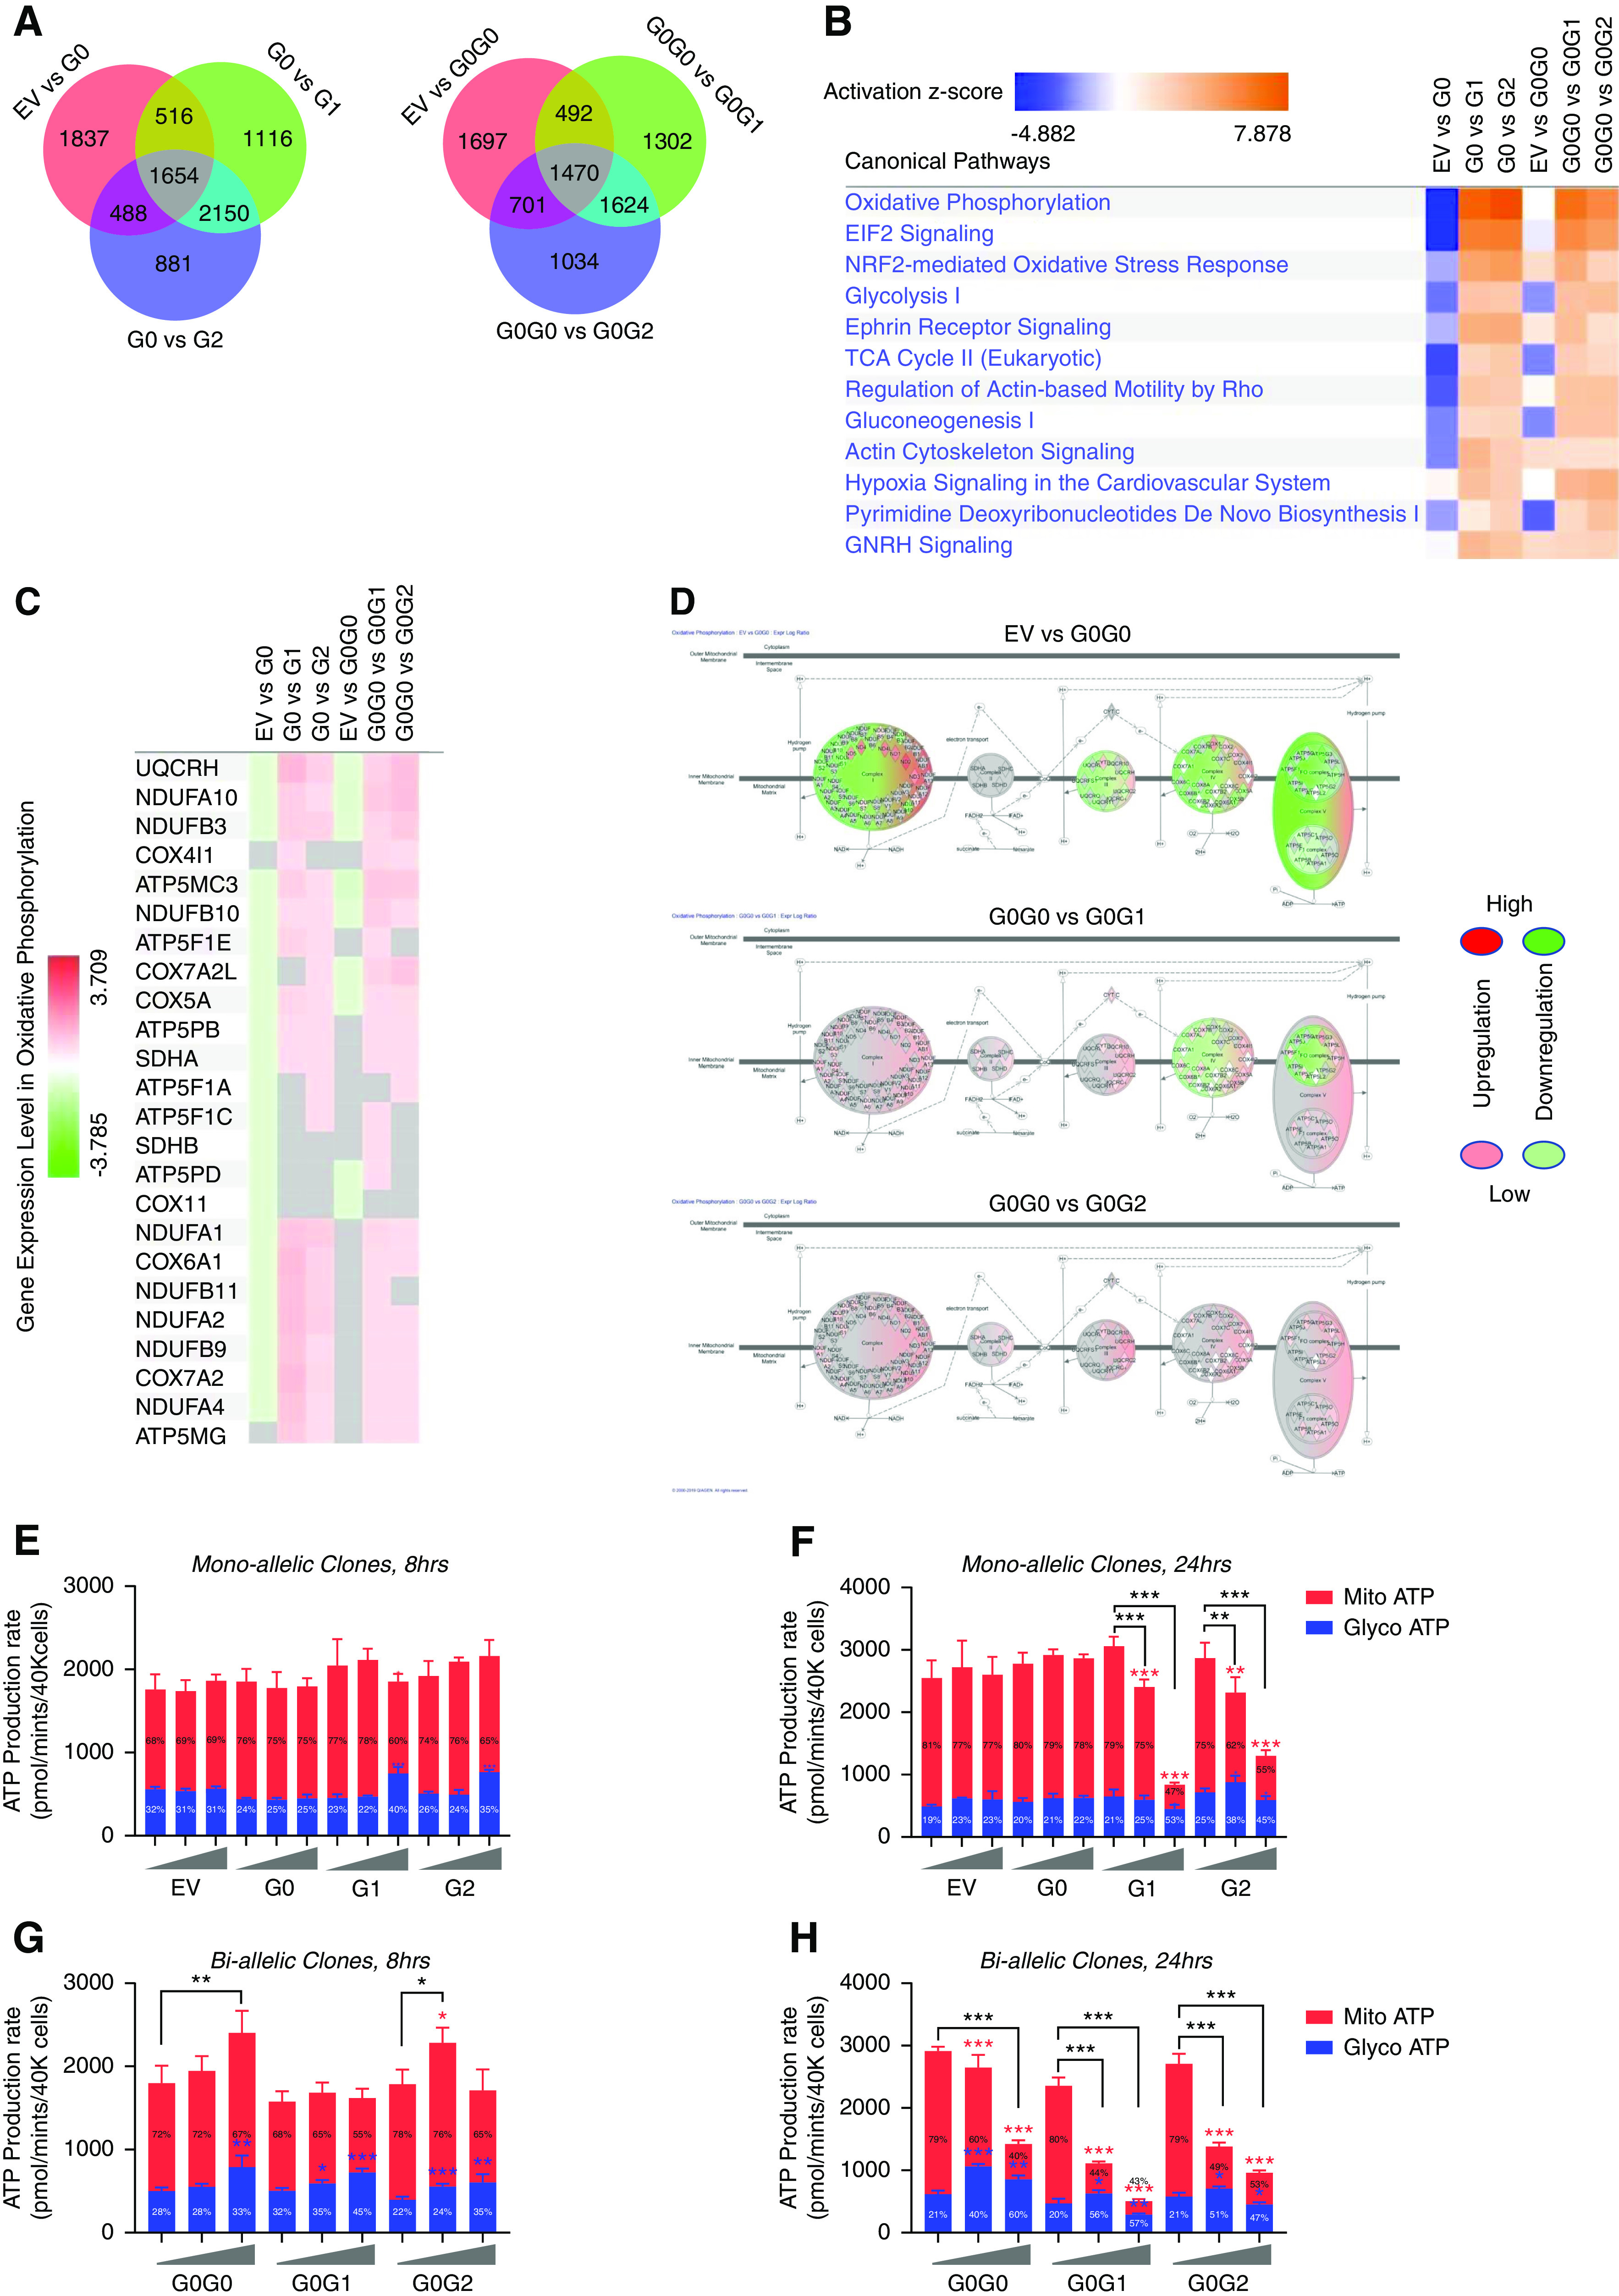
APOL1 variants alter canonical signaling pathways including energy metabolism. Next-generation RNA-sequencing was performed for the T-REx-293 clones after 8 hours of tet induction with intermediate tet dose (12.5 or 25 ng/ml). Ingenuity pathway analysis software (Qiagen) was used to identify and analyze top canonical signaling pathways altered in-between different groups. (A) Venn diagram showing numbers of DEGs identified between different groups. (B) Heatmap showing activation of top canonical signaling pathways in T-REx-293 clones expressing RRVs of APOL1. z-scores infer the activation state of predicted signaling pathways. Higher z-score (deeper orange) denotes higher activation and lower z-score (deeper blue) denotes higher inhibition of signaling pathways. (C) Heatmap showing upregulation of genes associated with mitochondrial oxidative phosphorylation in T-REx-293 cells expressing APOL1 RRVs. (D) Graphic representation of five complexes of oxidative phosphorylation pathway, showing distinct pattern of gene expression profile among biallelic T-REx-293 cells. Glyco and Mito ATP production rate were measured after (E and G) 8 hours and (F and H) 24 hours of tet induction, using Agilent Seahorse XFp Real-Time ATP Rate Assay Kit (kit 103591–100). Low (6.25 ng/ml), intermediate (12.5 or 25 ng/ml), or high (50 ng/ml) tet dose were used. Average signal of four replicates per treatment conditions were used to represent final estimation. *P<0.05; **P<0.01; ***P<0.001. Blue asterisks are used for Glyco ATP, red asterisks are used for Mito ATP, and black asterisks are used for total ATP (glycol ATP + Mito ATP) comparisons between Low-Tet versus Inter-Tet and Low-Tet versus High-Tet groups. Percentage inside the bar represent percentage of total ATP generated from Glyco and Mito ATP for each condition.
Next, we performed pathway analysis to determine if RRVs alter specific cellular functions. Figure 5B shows the top 12 canonical pathways predicted to be most activated in RRV-expressing cells relative to G0 and EV control. It is notable that cellular bioenergetics pathways (mitochondrial oxidative phosphorylation, glycolysis, TCA cycle, and gluconeogenesis) are among the most highly altered by RRV overexpression. This result suggests that RRVs have a disproportionate effect on cellular energy biogenesis and/or on cellular processes that consume energy. Besides eukaryotic translation initiation factor 2 (eIF2) signaling19,20 and NRF2-mediated oxidative stress response21 pathways, which were previously implicated in pathogenesis of RRVs, this study also identified previously unrecognized signaling pathways like actin cytoskeleton signaling, which were affected in part through deregulation of the known podocyte LPS coreceptor CD14,22 GTPases and their effectors in RRV-expressing cells (Figure 5B, Supplemental Figures 5–9). Similar pattern of predicted effects was also observed in biallelic RRVs (G0G1 and G0G2), indicating that these RRV-mediated signaling effects are dominant.
RRV-Induced Dysregulation of Energy Metabolism Is Not Reduced by G0
Our transcriptomic analysis revealed that 8 hours of RRV expression upregulate several components of mitochondrial oxidative phosphorylation and glycolytic ATP production (Figure 5, B–H, Supplemental Figure 9). These predicted changes at first appeared to contradict recent reports that RRVs reduce mitochondrial respiration rate.18,23,24 To investigate this more thoroughly, we examined the effects of mono- or biallelic APOL1 expression at 8 or 24 hours. As shown in Figure 5, E–H, RRVs have biphasic effect (acute, 8 hours versus late, 24 hours) on mitochondrial ATP production. Intermediate expression of monoallelic RRVs is associated with stable or increased mitochondrial ATP production (Mito ATP) at 8 hours but a significant decline at 24 hours (Figure 5, E and F). High expression of RRVs reduced Mito ATP at 8 hours, with an almost complete suppression at 24 hours (Figure 5, E–F). In contrast, expression of G1 or G2 increased the contribution from glycolytic ATP (Glyco ATP) both at 8 and 24 hours (Figure 5, E and F). These results suggest that transient induction and then suppression of Mito ATP in response to RRVs expression is likely compensated by sustained induction of Glyco ATP. The late collapse in Mito ATP likely represents dysregulation of mitochondrial ATP production, consistent with a recent report that RRVs caused cell death by inducing opening of the mitochondrial permeability transition pore, thereby impairing mitochondrial ATP production.24 Coexpression of G0 did not mitigate the effect of RRVs on Mito ATP (Figure 5H), consistent with a dominant effect of RRVs expression. Physiologic G0G0 expression did not alter Mito ATP, but supraphysiologic overexpression of G0G0 also altered Mito ATP (Figure 5, G and H).
RRV Increased eIF2α Phosphorylation and Reduced Global Protein Synthesis
In addition to bioenergetics pathways, transcriptome analysis also predicted RRV-dependent phosphorylation of eIF2 (Figures 5B and 6A) and confirmed by immunoblotting (Figure 6, B and C, Supplemental Figure 10), consistent with recent reports.7,20 Phosphorylation of eIF2α, a major regulator of protein synthesis, by upstream kinases prevents translation of global mRNAs, but selectively stimulates translation of certain mRNA including that of ATF4.25 Consistent with this finding, ATF4 protein is upregulated (data not shown) but global protein synthesis is reduced in RRV-expressing HEKs cells (Figure 6D). G0 had no effect on RRV-induced eIF2α phosphorylation (Figure 6C). Together, these results demonstrate that RRVs depress global translation by enhancing phosphorylation of eIF2α.
Figure 6.
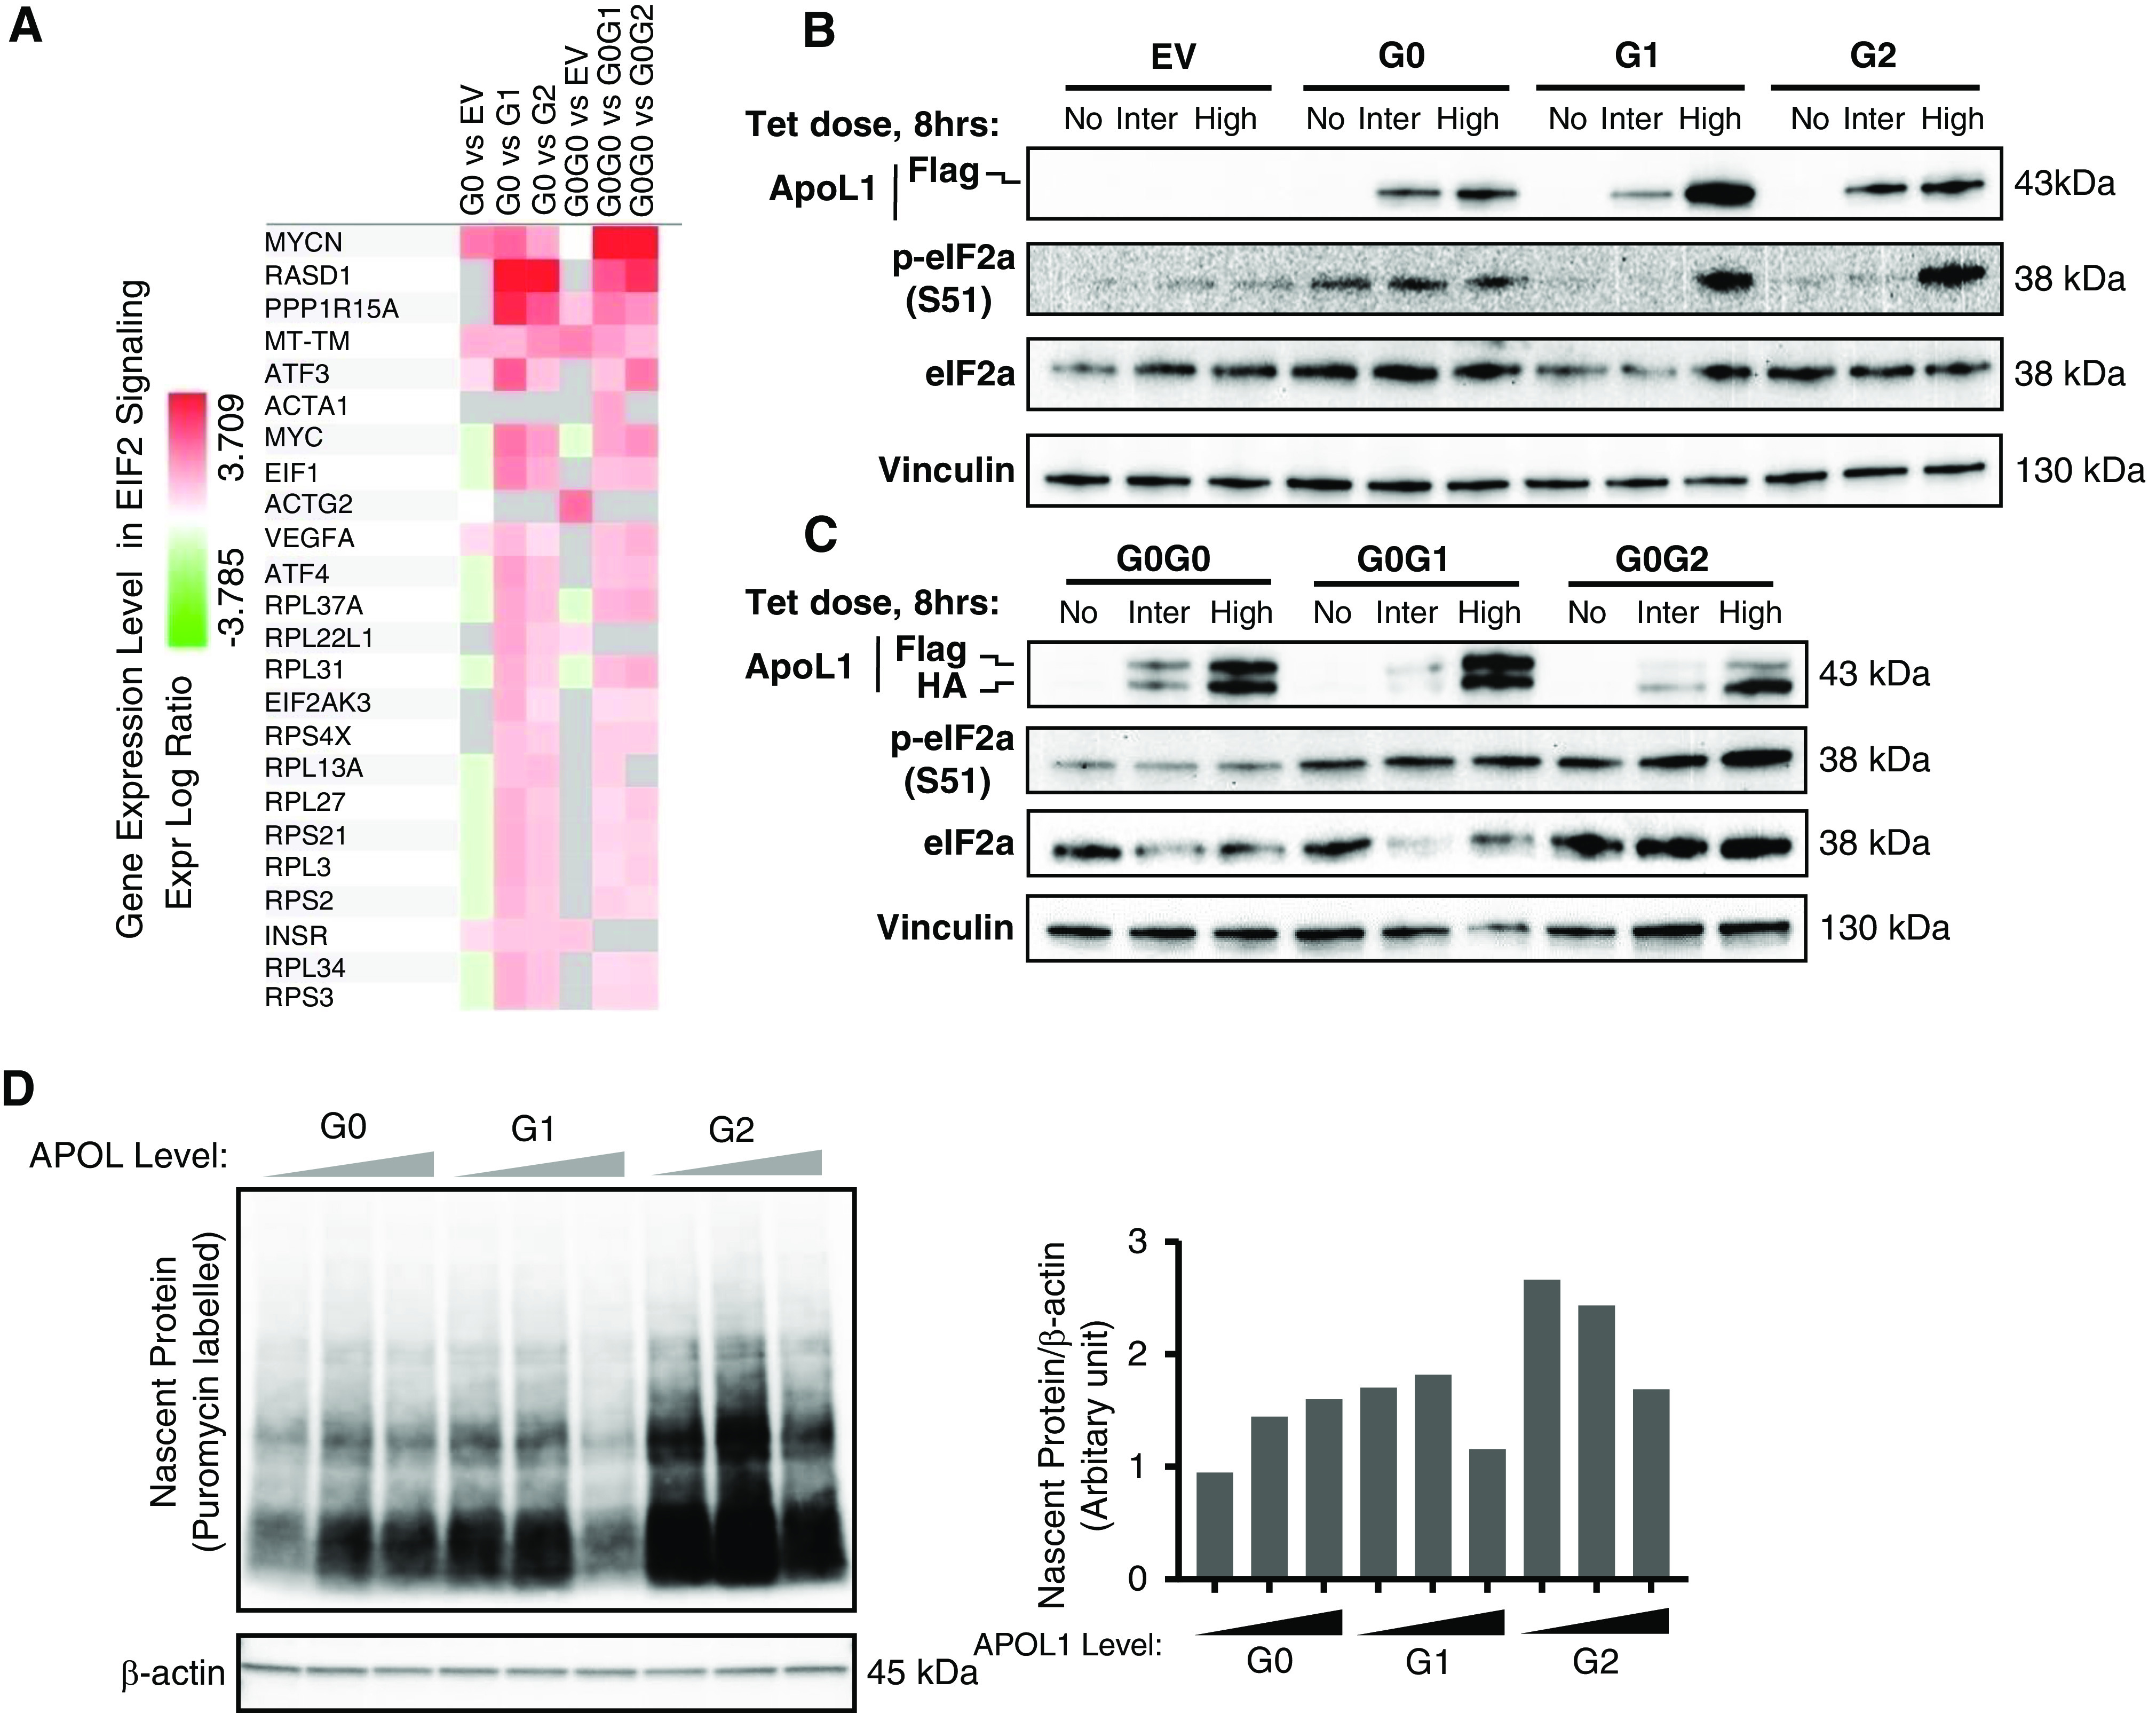
RRV-induced phosphorylation of eIF2α is not blocked by G0. (A) Heatmap showing deregulation of genes associated with EIF2 signaling pathway in T-REx-293 cells expressing APOL1 RRVs. Western blot analysis of phosphorylation level of eIF2α (S51) from cell lysates of T-REx-293 (B) monoallelic and (C) biallelic clones after 8 hours of tet induction: no treatment, intermediate (12.5 or 25 ng/ml), or high (50 ng/ml) tet dose]. (D) Measurement of protein synthesis rate. The incorporation of puromycin into newly synthesized proteins was detected by immunoblotting with anti-puromycin antibody. Bar diagram showing the level of nascent proteins (normalized with internal control, β-actin) in T-REx-293 cell expressing increasing level of APOL1 variants after 8 hours of tet induction (no treatment, intermediate [12.5/25 ng/ml], or high [50 ng/ml] tet dose) and 10 minutes of incubation with 10 μg/ml puromycin.
G0 Interacts Less with RRVs
It was recently reported that oligomers of RRVs may underlie their cytotoxicity.24 The dominant nature of RRVs cytotoxicity in this study suggests that G0 may be inefficient at preventing formation of RRVs oligomers. We hypothesized that in biallelic cells, G0-G1 or G0-G2 interactions will be less frequent than G0-G0 interactions. To test this hypothesis, we induced intermediate expression of G0-G0, G0-G1, and G0-G2 and measured interactions between each APOL1 protein variants using Duolink PLA. Despite similar expression of G0 and G1, there were more G0-G0 interactions than G0-G1 interactions (Figure 7). There were still fewer G0-G2 interactions, although this is in the setting of lower levels of G0 in G0G2 cell lines (Figure 2B). Concerns for excessive cytotoxicity precluded us from generating HEK cells with G1G1, G2G2, or G1G2. Together, these results suggest that G0 has higher propensity for self-interaction than it does for interacting with RRVs (at least for G1).
Figure 7.
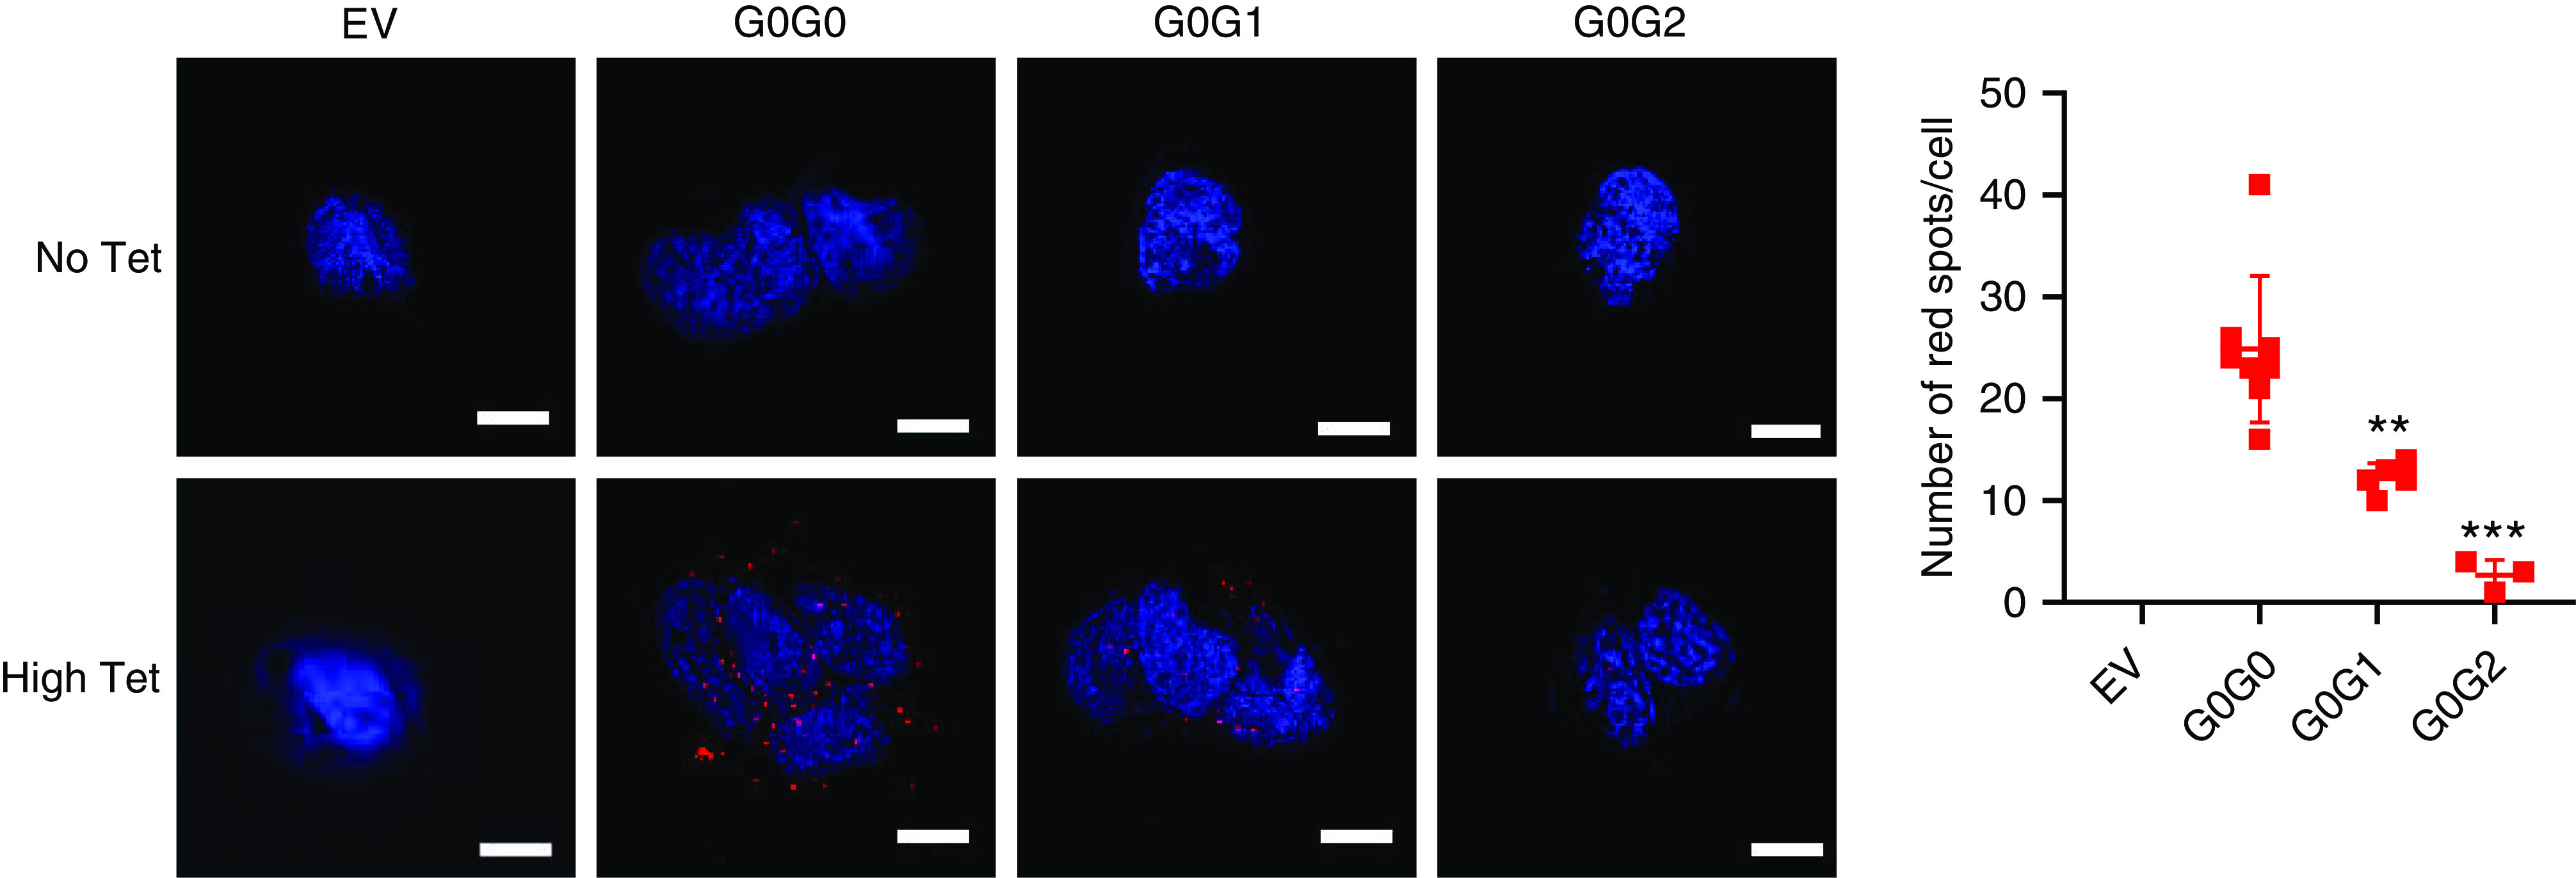
APOL1 G0 interacts less with RRVs. Duolink in situ PLA was performed in biallelic T-REx-293 cells after 8 hours of tet induction with high (50 ng/ml) tet dose. Images were taken in Keyence All-in-One Fluorescence Microscope BZ-X800E and the images were processed in Keyence BZ-X800 analyzer software. Scale bar, 20 μm. Dot plot was generated using average red spots count from three to eight randomly selected fields. Error bar represents SD. Two-tailed t test were performed for statistical analysis using GraphPad Prism8 (**P<0.01; ***P<0.001).
Discussion
Our data on novel mono- and biallelic APOL1-expressing HEK293 cell lines support the following key conclusions: (1) RRVs are much more potent cytotoxic agents than the G0 allele; (2) cytotoxicity was proportional to the amounts of RRVs expressed, and (3) cytotoxicity of RRVs was not inhibited by G0. These conclusions are on the basis of the following experimental evidence. First, we demonstrated that intermediate expression of RRVs, but not of G0 reduced cellular viability, increased cellular swelling and dysregulated cellular energy metabolism and reduced global mRNA translation. Next, we provided strong evidence that these manifestations of cytotoxicity are dependent on the amounts of RRVs expressed. Finally, we demonstrated that concomitant, stoichiometric coexpression of G0 at any dose did not reduce cytotoxicity of RRVs (Figures 1–6, Table 1). Collectively, this evidence strongly supports the conclusion that RRVs have dose-dependent and dominant effects on cell survival, whereas moderate expression of G0 is nontoxic.
Table 1.
Summary of cytotoxicity phenotypes induced by APOL1 variants
| APOL1 Allele | Decrease in Cell Viability (14 d) | Increase Cellular Swelling (8-24 h) | K+ Efflux (8 h) | SAPK Activation (8 h) | Mitochondrial Dysfunction (24 h) | Phosphorylation of eIF2a (8 h) | |||||||||
|---|---|---|---|---|---|---|---|---|---|---|---|---|---|---|---|
| Tet Dose | Low | Inter | High | Inter | High | Low | Inter | High | Inter | High | Low | Inter | High | Inter | High |
| G0 | — | — | — | — | — | — | — | — | — | — | — | — | — | — | — |
| G1 | + | +++ | +++ | ++ | +++ | — | +++ | +++ | — | +++ | — | + | +++ | — | ++ |
| G2 | — | +++ | +++ | ++ | +++ | — | +++ | +++ | — | +++ | — | + | +++ | — | ++ |
| G0G0 | — | — | + | — | — | — | — | + | — | — | — | + | +++ | — | — |
| G0G1 | + | +++ | +++ | ++ | +++ | — | ++ | +++ | — | +++ | — | ++ | +++ | + | ++ |
| G0G2 | — | +++ | +++ | ++ | +++ | — | +++ | +++ | — | +++ | — | ++ | +++ | + | ++ |
Low, Inter (intermediate), and High refer to low, intermediate and high expression of APOL1. –, absent; +, marginally present; ++, moderately present; +++, highly present.
Our results support prior reports that cytotoxicity of APOL1 in HEK cells is RRV-dependent,6,10,11 but is in contrast to recent report by O’Toole et al.12 that supraphysiologic overexpression drives APOL1 variant-independent cytotoxicity. One possible explanation for the differences in our results and conclusions by O’Toole et al may be how physiologic expression was defined in the studies. They defined physiologic APOL1 as that induced by low tet dose of 5–10 ng/ml, whereas supraphysiologic APOL1 was induced by 1000 ng/ml tet. Admittedly, it is unknown how in vitro expression of APOL1 relate to in vivo expression level in kidney cells. Therefore, it is difficult to accurately define physiologic in vitro expression levels. In our study, considering that G0 allele is unknown to be pathogenic, we considered relevant APOL1 expression range as expression levels corresponding to nontoxic G0 or G0G0. Consistent with this definition, relevant monoallelic APOL1 includes G0 and equivalent G1 or G2, induced by the three tet doses, including high dose. For biallelic APOL1, relevant expression includes G0G0 and equivalent G0G1 or G0G2 induced by low and intermediate doses of tet (Figures 1 and 2). Because high expression of G0G0 caused some cytotoxicity, we considered this expression level as supraphysiologic. It is highly likely that in the study by O’Toole et al. expression of G0 induced by 1000 ng/ml of tet was also supraphysiologic. Within relevant expression range, we found that cytotoxicity of APOL1 is indeed RRV-dependent, and that there is an expression threshold below which RRVs are nontoxic but above which their cytotoxicity is not prevented by G0 coexpression (Figure 8).
Figure 8.
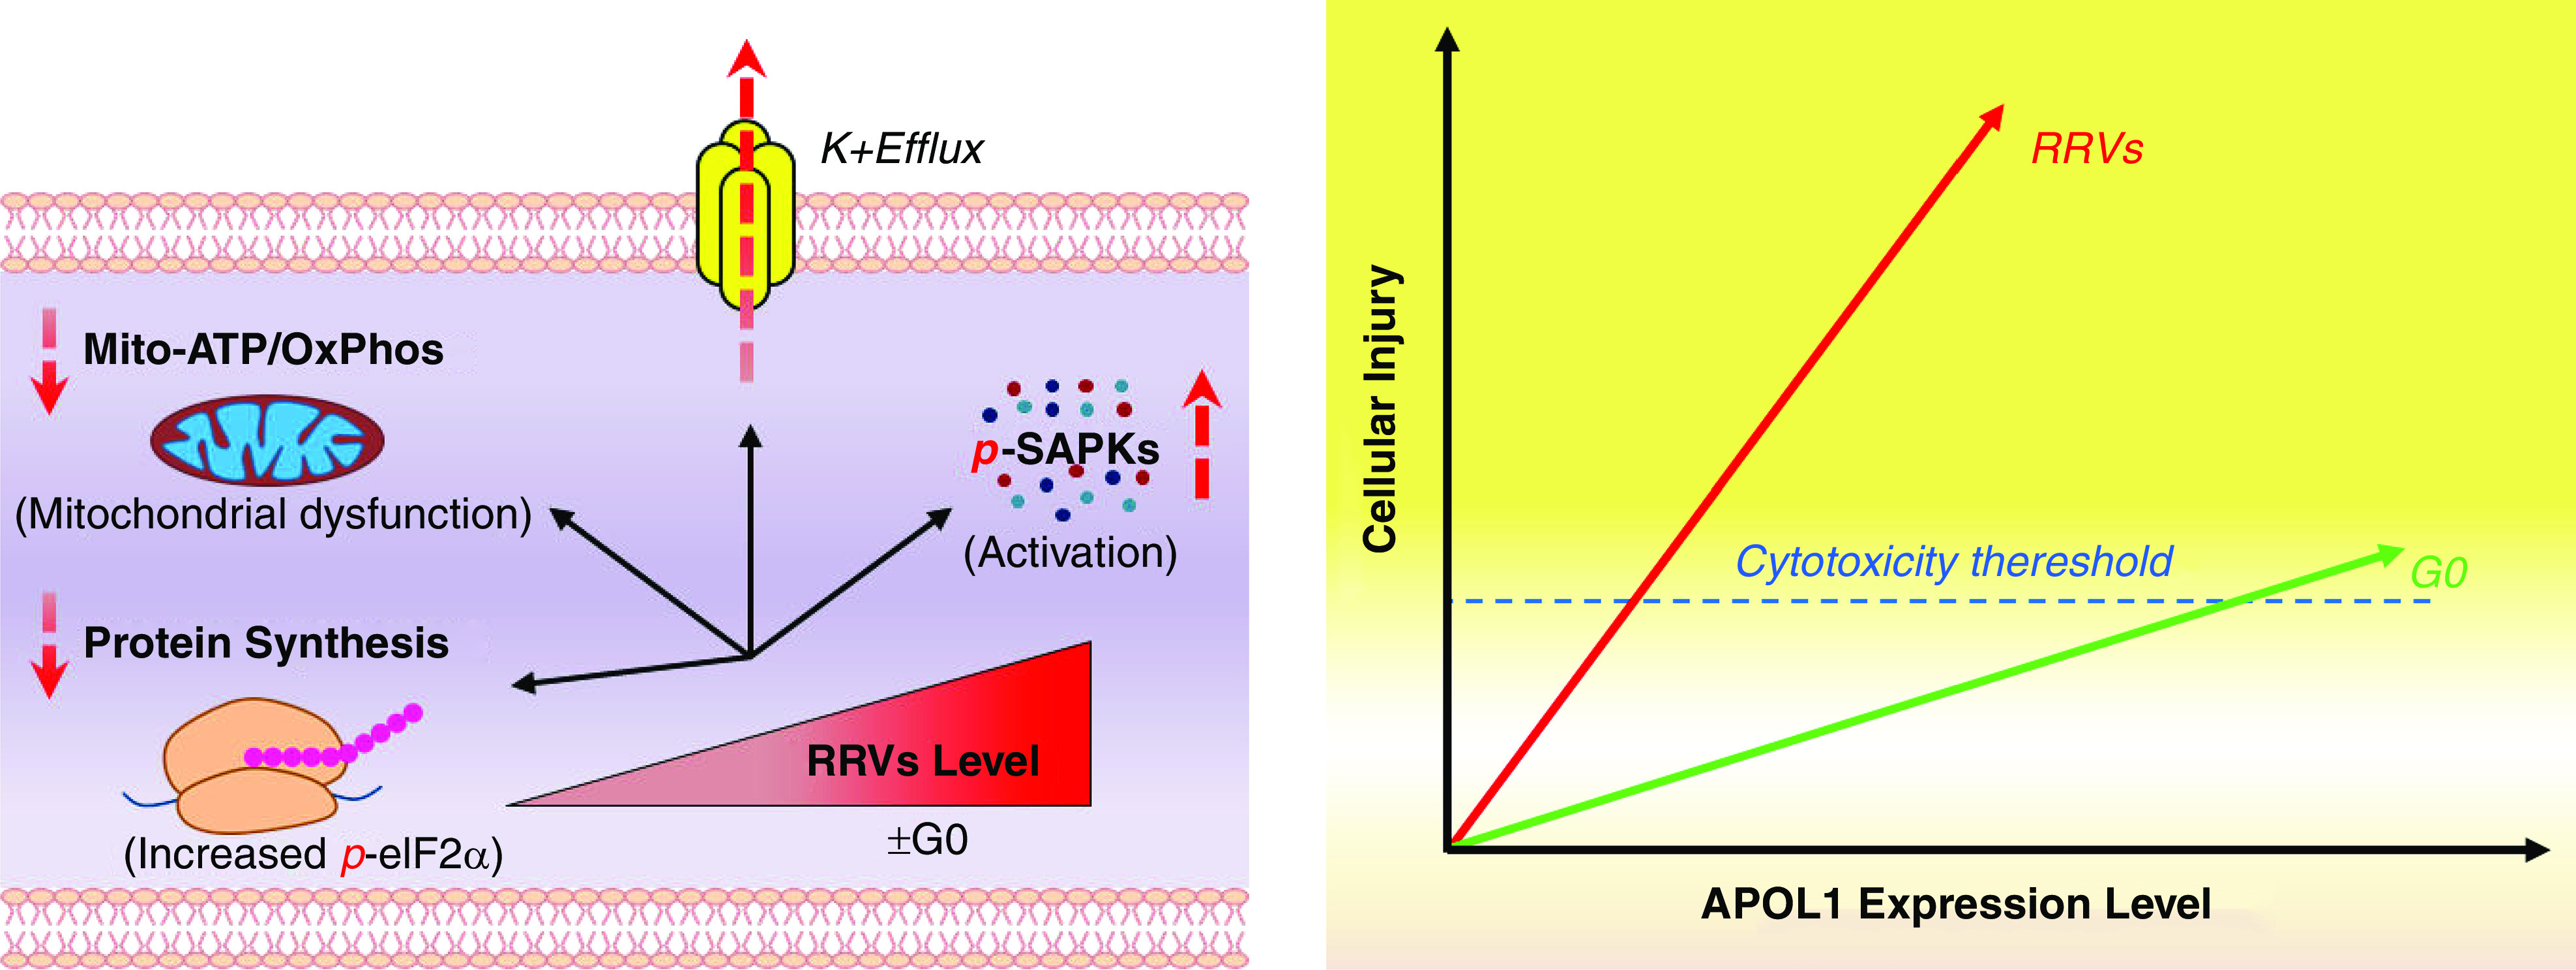
Cytotoxicity of APOL1 is dose- and variant-dependent.
Temporally, loss of cellular potassium is the earliest (8 hours) cytotoxic event triggered by intermediate expression of RRVs. We hypothesize that this loss of potassium likely increased cellular energy demand by increasing activity of Na+/K+-ATPase. It is plausible that the trend toward upregulated mitochondrial ATP production after 8 hours of intermediate expression of RRVs is in response to increased energy demand. However, after 24 hours, mitochondrial ATP production collapsed consistent with recent reports. By increasing energy demands and impairing mitochondrial energy production, RRVs ultimately precipitated a perfect storm of energy starvation.
Furthermore, whole-genome transcriptome analysis identified additional pathways dysregulated by RRVs. For example, NRF2-mediated oxidative stress was induced by intermediate expression of G1 or G2, but not by G0 (Figure 5B). This finding supports previous report that loss of GSTM1, a target of NRF2, is associated with rapid progression of APOL1-associated kidney disease.21 Transcriptome analysis also shows that Ephrin receptor signaling is differentially regulated by RRVs (Figure 5B). Together, these results not only support previous reports that RRVs cause mitochondrial dysfunction,9,18,24 increased potassium efflux, activation of SAPK,6,18 eIF2a signaling,7,20 and NRF2-mediated oxidative stress response.21 These pathways could contain targets for prevention/early intervention in APOL1 nephropathy.
Results from this cell-based study have implications for clinical APOL1 nephropathy. An estimated 15%–20% of carriers of high-risk APOL1 genotypes develop APOL1 nephropathy in their lifetime. The reason for this incomplete penetrance is unknown. Our finding that cytotoxicity of RRVs is dose-dependent raises the possibility that pathogenesis of APOL1 nephropathy may be determined by high steady-state expression of RRVs protein in podocytes of affected individuals. Cellular modifiers that promote high steady-state expression of RRVs in podocytes in the setting of disease triggers such as IFNs or HIV may increase likelihood of APOL1 nephropathy. Similarly, our observation that moderate expression of G0G1 or G0G2 caused cytotoxicity could help explain the elevated risk of APOL1 nephropathy in some carriers of one RRVs relative to carriers of G0G0.13,14,26
Our results also raise new questions. We observed that tet induced a lower level of G0 protein relative to G2 protein in G0G2-containing HEK293 cells. This raises the question of whether asymmetric expressions of G0 and G2 are also present in podocytes of blacks with APOL1 nephropathy. Recent report of RRV-induced, UBD-mediated proteosomal degradation11 raises the possibility of G2-induced degradation of G0 as a plausible mechanism. Furthermore, future studies should investigate the role of RRVs inhibition of globally protein synthesis in APOL1-induced podocytopathy.
A central limitation of our study is that it is on the basis of experiments in HEK293 cells in which APOL1 cDNA is expressed under an artificial tet-inducible promoter. How the levels of tet-induced APOL1 compare with levels induced by native promoter in podocytes by disease-causing conditions in unknown. Therefore, validation in human podocytes is required. Nevertheless, HEK293 cells have been useful for discovering fundamental attributes of APOL1 variants and for modeling APOL1 cytotoxicity. Given the wide use of HEK cells as a tool for studying APOL1 biology, our results, especially in regard to the relationship between dose and cytotoxicity, will be a useful reference to other investigators.
In summary, in this study, we discovered that within the relevant expression range, cytotoxicity was proportional to the amounts of RRVs expressed, and that the cytotoxicity was not inhibited by G0 in HEK293 cells. These discoveries shed new light of a specific role of RRVs to cause cellular injury and also suggest that interventions that reduce steady-state levels of RRVs in kidney compartments could be a viable therapeutic strategy for APOL1 nephropathy. In order to extend conclusions of this study to APOL1 nephropathy, future studies need to confirm if disease-relevant environment induces RRVs expression in podocytes of blacks with APOL1 nephropathy. Direct cytotoxic effects of RRVs in patient-derived podocytes also need to be tested. Finally, future studies should determine if G2 downregulates protein level of G0 in podocytes of blacks with APOL1 nephropathy.
Disclosures
M. Pollak is a coinventor of patents related to APOL1 diagnostics and therapeutics, owns equity in Apolo1Bio, and has received research funding from and consulted for Vertex. In addition, M. Pollak has a patent US 9,828,637 issued, a patent US 9,023355 issued, and a patent US 10,130,632 issued. All remaining authors have nothing to disclose.
Funding
This work was supported the Robert Wood Johnson Foundation Harold Amos Faculty Development Program grant 73313 (to O. Olabisi), National Institutes of Health Office of the DirectorNew Innovator Award DP2-DK124891-01 (to O. Olabisi), and Massachusetts General HospitalStart-Up Fund and Physician-Scientist Career Development Award grant 2015A051179 (to O. Olabisi).
Supplementary Material
Acknowledgments
We would like to thank Dr. Myles Wolf at Nephrology Division, Duke University; Dr. Christopher Newgard at Duke Molecular Physiology Institute; and Dr. Keith Norris at Nephrology Division, University of California, Los Angeles, for critical review and revision of the manuscript. We are also thankful for insightful discussion of our data by Drs. David Pepin and Patricia Donahoe (Pediatric Surgical Research Laboratory, Massachusetts General Hospital, Harvard Medical School).
Dr. Martin Pollak reports grants and personal fees from Vertex and Apolo1Bio, outside the submitted work,
Dr. Somenath Datta and Dr. Opeyemi A. Olabisi conceived the project, designed experiments, analyzed results, and wrote the manuscript. Dr. Rama Kataria designed and performed experiments and analyzed results. Dr. Jia-Yue Zhang designed experiments. Dr. Savannah Moore, Dr. Kaitlyn Petitpas, and Dr. Adam Mohamed performed experiments and analyzed results. Dr. Nathan Zahler measured cellular ions and analyzed results. Dr. Martin Pollak provided scientific insight and analysis, offered critical review, and edited the manuscript.
Footnotes
Published online ahead of print. Publication date available at www.jasn.org.
Supplemental Material
This article contains the following supplemental material online at http://jasn.asnjournals.org/lookup/suppl/doi:10.1681/ASN.2020010079/-/DCSupplemental.
Supplemental Figure 1. Optimization of tetracycline doses.
Supplemental Figure 2. Cellular swelling at high tet dose.
Supplemental Figure 3. (A) Densitometric analysis of Western blot data in Figure 4C. (B) Densitometric analysis of Western blot data in Figure 4D.
Supplemental Figure 4. Volcano plot of RNA-sequencing data.
Supplemental Figure 5. (A) Heatmap showing deregulation of genes associated with actin cytoskeleton signaling. (B) Graphic representation of actin cytoskeleton signaling pathway based on distinct patterns of gene expression profile.
Supplemental Figure 6. Heatmap showing deregulation of additional canonical signaling pathways.
Supplemental Figure 7. (A) Heatmap showing deregulation of genes associated with p38 MAPK signaling. (B) Graphic representation of p38 MAPK signaling pathway showing distinct pattern of gene expression profile.
Supplemental Figure 8. (A) Heatmap showing deregulation of genes associated with SAPK/JNK signaling. (B) Graphic representation of SAPK/JNK signaling pathway showing distinct pattern of gene expression profile.
Supplemental Figure 9. (A) Heatmap showing deregulation of genes associated with glycolytic pathway. (B) Graphic representation of glycolytic pathway, showing distinct pattern of gene expression of glycolytic enzymes.
Supplemental Figure 10. Estimation of p-eIF2α/total eIF2α ratio.
Supplemental Table 1. Summary of differential expression analysis.
Supplemental Videos 1–6. (1) Time-lapse imaging of G0-HEK293 treated with intermediate tet dose; (2): Time-lapse imaging of G1-HEK293 treated with intermediate tet dose; (3) Time-lapse imaging of G2-HEK293 treated with intermediate tet dose; (4) Time-lapse imaging of G0G0-HEK293 treated with intermediate tet dose; (5) Time-lapse imaging of G0G1-HEK293 treated with intermediate tet dose; (6) Time-lapse imaging of G0G2-HEK293 treated with intermediate tet dose.
References
- 1.Freedman BI, Langefeld CD, Lu L, Divers J, Comeau ME, Kopp JB, et al.: Differential effects of MYH9 and APOL1 risk variants on FRMD3 association with diabetic ESRD in african Americans. PLoS Genet 7: e1002150, 2011. [DOI] [PMC free article] [PubMed] [Google Scholar]
- 2.Genovese G, Friedman DJ, Ross MD, Lecordier L, Uzureau P, Freedman BI, et al.: Association of trypanolytic ApoL1 variants with kidney disease in African Americans. Science 329: 841–845, 2010. [DOI] [PMC free article] [PubMed] [Google Scholar]
- 3.Tzur S, Rosset S, Shemer R, Yudkovsky G, Selig S, Tarekegn A, et al.: Missense mutations in the APOL1 gene are highly associated with end stage kidney disease risk previously attributed to the MYH9 gene. Hum Genet 128: 345–350, 2010. [DOI] [PMC free article] [PubMed] [Google Scholar]
- 4.Olabisi O, Al-Romaih K, Henderson J, Tomar R, Drummond I, MacRae C, et al.: From man to fish: What can Zebrafish tell us about ApoL1 nephropathy? Clin Nephrol 86: 114–118, 2016. [DOI] [PubMed] [Google Scholar]
- 5.Beckerman P, Bi-Karchin J, Park AS, Qiu C, Dummer PD, Soomro I, et al.: Transgenic expression of human APOL1 risk variants in podocytes induces kidney disease in mice. Nat Med 23: 429–438, 2017. [DOI] [PMC free article] [PubMed] [Google Scholar]
- 6.Olabisi OA, Zhang JY, VerPlank L, Zahler N, DiBartolo S 3rd, Heneghan JF, et al.: APOL1 kidney disease risk variants cause cytotoxicity by depleting cellular potassium and inducing stress-activated protein kinases. Proc Natl Acad Sci U S A 113: 830–837, 2016. [DOI] [PMC free article] [PubMed] [Google Scholar]
- 7.Wen H, Kumar V, Lan X, Shoshtari SSM, Eng JM, Zhou X, et al.: APOL1 risk variants cause podocytes injury through enhancing endoplasmic reticulum stress. Biosci Rep 38: BSR20171713, 2018. 10.1042/BSR20171713 [DOI] [PMC free article] [PubMed] [Google Scholar]
- 8.Lan X, Jhaveri A, Cheng K, Wen H, Saleem MA, Mathieson PW, et al.: APOL1 risk variants enhance podocyte necrosis through compromising lysosomal membrane permeability. Am J Physiol Renal Physiol 307: F326–F336, 2014. [DOI] [PMC free article] [PubMed] [Google Scholar]
- 9.Ma L, Chou JW, Snipes JA, Bharadwaj MS, Craddock AL, Cheng D, et al.: APOL1 renal-risk variants induce mitochondrial dysfunction. J Am Soc Nephrol 28: 1093–1105, 2017. [DOI] [PMC free article] [PubMed] [Google Scholar]
- 10.Chun J, Zhang JY, Wilkins MS, Subramanian B, Riella C, Magraner JM, et al.: Recruitment of APOL1 kidney disease risk variants to lipid droplets attenuates cell toxicity. Proc Natl Acad Sci U S A 116: 3712–3721, 2019. [DOI] [PMC free article] [PubMed] [Google Scholar]
- 11.Zhang JY, Wang M, Tian L, Genovese G, Yan P, Wilson JG, et al.: UBD modifies APOL1-induced kidney disease risk. Proc Natl Acad Sci U S A 115: 3446–3451, 2018. [DOI] [PMC free article] [PubMed] [Google Scholar]
- 12.O’Toole JF, Schilling W, Kunze D, Madhavan SM, Konieczkowski M, Gu Y, et al.: ApoL1 overexpression drives variant-independent cytotoxicity. J Am Soc Nephrol 29: 869–879, 2018. [DOI] [PMC free article] [PubMed] [Google Scholar]
- 13.Kanji Z, Powe CE, Wenger JB, Huang C, Ankers E, Sullivan DA, et al.: Genetic variation in APOL1 associates with younger age at hemodialysis initiation. J Am Soc Nephrol 22: 2091–2097, 2011. [DOI] [PMC free article] [PubMed] [Google Scholar]
- 14.Tzur S, Rosset S, Skorecki K, Wasser WG: APOL1 allelic variants are associated with lower age of dialysis initiation and thereby increased dialysis vintage in African and Hispanic Americans with non-diabetic end-stage kidney disease. Nephrol Dial Transplant 27: 1498–1505, 2012. [DOI] [PubMed] [Google Scholar]
- 15.Kasembeli AN, Duarte R, Ramsay M, Mosiane P, Dickens C, Dix-Peek T, et al.: APOL1 risk variants are strongly associated with HIV-associated nephropathy in black South Africans. J Am Soc Nephrol 26: 2882–2890, 2015. [DOI] [PMC free article] [PubMed] [Google Scholar]
- 16.Kopp JB, Nelson GW, Sampath K, Johnson RC, Genovese G, An P, et al.: APOL1 genetic variants in focal segmental glomerulosclerosis and HIV-associated nephropathy. J Am Soc Nephrol 22: 2129–2137, 2011. [DOI] [PMC free article] [PubMed] [Google Scholar]
- 17.Schmidt EK, Clavarino G, Ceppi M, Pierre P: SUnSET, a nonradioactive method to monitor protein synthesis. Nat Methods 6: 275–277, 2009. [DOI] [PubMed] [Google Scholar]
- 18.Granado D, Müller D, Krausel V, Kruzel-Davila E, Schuberth C, Eschborn M, et al.: Intracellular APOL1 risk variants cause cytotoxicity accompanied by energy depletion. J Am Soc Nephrol 28: 3227–3238, 2017. [DOI] [PMC free article] [PubMed] [Google Scholar]
- 19.Jha A, Kumar V, Haque S, Ayasolla K, Saha S, et al. Xet al.: Alterations in plasma membrane ion channel structures stimulate NLRP3 inflammasomes activation in APOL1 risk milieu. FEBS J 287: 2000–2022, 2019 [DOI] [PMC free article] [PubMed] [Google Scholar]
- 20.Okamoto K, Rausch JW, Wakashin H, Fu Y, Chung JY, Dummer PD, et al.: APOL1 risk allele RNA contributes to renal toxicity by activating protein kinase R. Commun Biol 1: 188, 2018. [DOI] [PMC free article] [PubMed] [Google Scholar]
- 21.Bodonyi-Kovacs G, Ma JZ, Chang J, Lipkowitz MS, Kopp JB, Winkler CA, et al.: Combined effects of GSTM1 null allele and APOL1 renal risk alleles in CKD progression in the african American study of kidney disease and hypertension trial. J Am Soc Nephrol 27: 3140–3152, 2016. [DOI] [PMC free article] [PubMed] [Google Scholar]
- 22.Reiser J, von Gersdorff G, Loos M, Oh J, Asanuma K, Giardino L, et al.: Induction of B7-1 in podocytes is associated with nephrotic syndrome. J Clin Invest 113: 1390–1397, 2004. [DOI] [PMC free article] [PubMed] [Google Scholar]
- 23.Ma L, Langefeld CD, Comeau ME, Bonomo JA, Rocco MV, Burkart JM, et al.: APOL1 renal-risk genotypes associate with longer hemodialysis survival in prevalent nondiabetic African American patients with end-stage renal disease. Kidney Int 90: 389–395, 2016. [DOI] [PMC free article] [PubMed] [Google Scholar]
- 24.Shah SS, Lannon H, Dias L, Zhang JY, Alper SL, Pollak MR, et al.: APOL1 kidney risk variants induce cell death via mitochondrial translocation and opening of the mitochondrial permeability transition pore. J Am Soc Nephrol 30: 2355–2368, 2019. [DOI] [PMC free article] [PubMed] [Google Scholar]
- 25.Harding HP, Novoa I, Zhang Y, Zeng H, Wek R, Schapira M, et al.: Regulated translation initiation controls stress-induced gene expression in mammalian cells. Mol Cell 6: 1099–1108, 2000. [DOI] [PubMed] [Google Scholar]
- 26.Vajgel G, Lima SC, Santana DJS, Oliveira CBL, Costa DMN, Hicks PJ, et al.: Effect of a single apolipoprotein L1 gene nephropathy variant on the risk of advanced lupus nephritis in Brazilians [published online ahead of print Nov 15, 2019]. J Rheumatol [DOI] [PMC free article] [PubMed] [Google Scholar]
Associated Data
This section collects any data citations, data availability statements, or supplementary materials included in this article.


