

Abstract
Objectives:
To quantify and validate the effect of pixel size on a digital intraoral radiographic system according to International Electrotechnical Commission standards through physical and visual evaluations.
Methods:
The digital intraoral radiographic system used was the photostimulable phosphor imaging plate and scanner system. The system had three image capture modes: high-speed (HS), high-resolution (HR), and super high-resolution (SHR) with different pixels. The physical characteristics of the system were evaluated using presampled modulation transfer function (MTF) and the normalized noise power spectrum (NNPS). An aluminum (Al) step phantom with different depths of holes was used to acquire images under various exposure conditions. The average number of perceptible holes from all steps was plotted against each exposure dose. The results were compared to analyze the effects of pixel size on image quality of intraoral radiographs.
Results:
The MTF was slightly higher with SHR than with HR and HS. The NNPS with SHR showed about a 40% decrease in magnitude compared to HS. The total number of perceptible holes in the Al step phantom was higher with SHR than with HS and HR in all exposure conditions.
Conclusions:
The MTF and NNPS obtained with different pixel size could be quantified by physical evaluation, and the differences were visually validated with Al step phantom. The SHR mode has the potential to decrease the radiation dose without compromising the image quality.
Keywords: digital intraoral radiographic system, modulation transfer function, normalized noise power spectrum, photostimulable phosphor imaging plate, quality assurance and quality control
Introduction
Digital radiography systems have largely replaced conventional film-screens in medical and intraoral dental radiography. Currently, there are two types of digital intraoral radiography systems: the direct and the indirect system. The direct system uses a charge-coupled device (CCD) or a complementary metal oxide semi-conductor (CMOS) sensor.1 The indirect system consists of photostimulable phosphor (PSP) imaging plate (IP) and scanner system (PSP system).2–5 Compared to the CCD and CMOS, the PSP systems are widely used in general clinical practice as the geometry and imaging technique of IP is similar to that of conventional films.6–10 The pixel size is an important factor in determining the spatial resolution of PSP a system. Currently, the pixel size is approximately 0.02–0.06 mm in digital intraoral radiographic systems.7 Some PSP systems have several image capture modes to acquire images with different pixel sizes. Dentists and radiological technologists have to establish optimal conditions such as image capture mode and radiation dose for accurate diagnosis. The physical and visual quality evaluation of image is necessary for understanding the characteristics of each capture mode.11–13
The resolution and noise properties of digital radiographic systems have been evaluated by calculating the modulation transfer function (MTF)14,15 and the normalized noise power spectrum (NNPS).16,17 Various methods have been proposed to determine the film or digital radiographic system's MTF, on the basis of slit,18–24 edge,25–27 or bar pattern images.28,29 However, these reports have used different characteristics of dental X-ray units, test devices, and acquisition conditions (X-ray tube voltage, X-ray spectral quality, and filtration of X-ray), that may affect the MTFs. Therefore, the comparison of these results is not easy. Similar discrepancies have been detected in calculating the NNPS of digital intraoral radiographic systems.
In 2015, the International Electrotechnical Commission (IEC) published a report30 (No. 62220-1-1) to standardize a method for the detective quantum efficiency measurement to facilitate comparisons between different manufacturers and/or systems. The quality of the X-ray beam “RQA” is defined by the IEC No. 62220-1-1 and 61267.30,31 The RQA beam quality was developed to simulate the radiation beam exiting a patient. The IEC has recommended a standard method to measure the presampled MTF of digital radiographic systems using an edge test device. The NNPS is determined through the two-dimensional (2D) fast Fourier transform algorithm to describe noise characteristics. To our knowledge, no study based on IEC standard has been conducted to measure physical image quality of PSP system that can acquire images with different pixel sizes.
The objectives of the present study were to quantify and validate the effect of pixel size on digital intraoral radiographic image quality by physical and visual evaluations, according to IEC standard.
Methods and materials
Equipment
PSP system (CS7600 CR, Carestream Health Inc, Rochester, NY) and IP (Smart Plate, Carestream Health Inc, Rochester, NY) (size: 41 × 31 mm) were used. This system has three image capture modes: high-speed (HS), high-resolution (HR), and super high-resolution (SHR). The features of the three image capture modes are shown in Table 1. A general radiographic system combining an X-ray generator (KXO-50R, Canon Medical Systems Corporation, Tochigi, Japan) with an X-ray tube (DRX-3724HC, Canon Medical Systems Corporation, Tochigi, Japan) was used for physical evaluation of the PSP system according to IEC standard, and a dental X-ray unit (ALULA-TW, Asahi Roentgen Ind. Co., Ltd, Kyoto, Japan) was used to obtain images for visual evaluation. The IP sealed in opaque plastic covers was used and the interval time to insert IP into the PSP system was fixed at 10 s after exposure, to avoid image degradation from ambient light exposure or trapped electrons decay.32 The exposure dose on the detector was measured by calibrated X-ray measurement system (Model No. Radcal 9095 radiation monitor, Radcal 6 cc ionization chamber, Radcal Corporation, Monrovia, CA). The general image analysis software (ImageJ (NIH, Bethesda, MD)) was used to analyze all images.
Table 1.
Overview of three image capture modes of the system
| Image capture mode | Raw data matrix size | Pixel size (mm) |
Scan time (s) |
|---|---|---|---|
| HS | 530 × 689 | 0.059 | 7 |
| HR | 941 × 1223 | 0.033 | 16 |
| SHR | 1652 × 2147 | 0.019 | 30 |
HR, high-resolution; HS, high-speed; SHR, super high-resolution.
Physical evaluation
An X-ray beam quality of RQA3 with a general radiographic system (additional filtration 10.0 mm Al, half-value layer 4.0 mm, as defined by IEC 61267)31 was used to evaluate MTF and NNPS. The source image receptor distance (SID) was fixed at 100 cm for all experiments. The digital characteristic curve, presampled MTF, and NNPS among three image capture modes were measured and compared.
The time-scale method33,34 that changes the exposure time while maintaining fixed tube voltage (the X-ray beam quality) and tube current is used to control X-ray intensities for measuring the digital characteristic curve. In all measurements, the exposure doses were measured with the detector. A linear relationship between the displayed exposure time of the X-ray generator and the relative exposure dose was confirmed before measurement. The exposure times were changed to 0.04–0.80 s with fixed X-ray quality RQA3 and the tube current of 100 mA, and uniform exposure images (high dose range) were obtained. Since the IP used in this study has a wide dynamic range, the relative exposure dose range obtained by data measurement is narrow, and it is possible that the whole dynamic range cannot be measured. Therefore, the uniform exposure images (low dose range) were obtained; the SID was changed to 150 cm and the exposure time was changed to 0.04–0.71 s with the same parameter. A region of interest (ROI) of 300 × 300 pixels was set at the center of each image, and the average pixel values were calculated from each ROI. The digital characteristic curves of the entire dynamic range of IP were obtained by combining the ranges of the high- and low-dose curves. The digital characteristic curves were obtained by averaging the three independent measurements.
The edge method with 1.0 mm thick tungsten edge device was used for the measurement of the presampled MTF of the RAW image.30 The exposure conditions were based upon the radiation dose required to achieve 70–80% of the maximum pixel value for each image capture mode.35 The tungsten edge device was placed on the IP surface and tilted at about 2.5° angle (Figure 1). Measurement of the presampled MTF strongly depends on the relationship between the direction of the edge device on the IP and the scanning direction of the laser-beam in the PSP system.36,37 Therefore, the two MTFs were calculated according to different arrangements of the edge and IP (Figure 1); the horizontal and vertical directions correspond to a laser-beam scanning direction and a subscanning (perpendicular to the laser-beam scanning) direction, respectively. The extrapolation technique for the line spread function (LSF) is an effective method for reducing the fluctuation of the MTF due to the truncation error.14,16,17 However, it is difficult to determine the starting point of extrapolation in the LSF due to the noise, especially in the edge method. Thus, MTFs were obtained without extrapolation in this study. The MTFs were derived by averaging the three independent measurements.
Figure 1.

The arrangement of edge devices used in this study. The ROIs (gray dot square area) indicate the regions for measurement of the presampled MTF, and the arrow indicates the scanning direction of the laser-beam. MTF, modulation transferfunction; ROI, region of interest
Over four million pixels were used to calculate the NNPSs to minimize the effect of statistical fluctuations.31 This implies that the number of images required depend on the pixel size of each image capture mode. The NNPSs are calculated dividing the portion of the uniformly exposed area of acquisition images into square areas. Each ROI is 256 × 256 pixels in size, overlapping 128 pixels in both the horizontal and the vertical directions. These ROIs of the NNPS images were detrended by fitting and subtracting a 2D second‐order polynomial to the original acquired image data. The NNPSs were calculated by the 2D fast Fourier transform of the ROIs30 and the resulting 2D NNPSs from each ROI were averaged. One‐dimensional NNPSs, horizontal and vertical, were calculated by averaging the central ±7 lines of the 2D NNPS, omitting the zero‐frequency axes, along with the horizontal and vertical directions. The exposure dose on the detector was varied from 0.43 mGy up to 1.33 mGy with the SID of 100 cm. Six exposure doses (0.43, 0.54, 0.64, 0.86, 1.08, and 1.33 mGy) were used with the SID of 100 cm. These doses were set to match six exposure time settings (0.08, 0.10, 0.12, 0.16, 0.20, and 0.25 s) of intraoral imaging under clinical conditions (the SID of 30 cm, tube voltage of 70 kV, and tube current of 7 mA) with the dental radiographic unit.
Visual evaluation
The self-made step phantom was used for visual evaluation, and its overview is shown in Figure 2. The Al step phantom consisted of 12 steps, and the thickness interval of each step was 1.0 mm. In each step, seven holes of 1.0 mm diameter were drilled in depths, sequentially increasing from 0.05 to 0.35 mm.38,39 The step phantom was covered by acrylic plates, and the thicknesses of the front and back acrylic plates were 10 and 2.0 mm, respectively. The acrylic plates simulated the perioral soft tissue. The dental X-ray unit operated at a tube voltage of 70 kVp, tube current of 7 mA, and used four different exposure times (0.08–0.16 s) in three image capture modes to obtain Al step phantom images. The SID was set to 30 cm to simulate clinical conditions. The PSP system used in this study had three image processing modes for output image: (1) to optimize the display of periodontal tissues (Perio mode), (2) to optimize the contrast in the entire image for endodontics (Endo mode), (3) and to optimize the contrast at the dentin–enamel junction (DEJ mode). The Endo mode used in routine clinical practice was selected as an image processing mode for the output image. Three images under one condition, a total of 36 images were acquired.
Figure 2.

An overview of the self-made step phantom for observer performance. (a) Front side of the aluminum step phantom. (b) Behind the aluminum step phantom with holes of increasing depths. (c) Acrylic blocks enclosing the aluminum step phantom. (d) Lateral view shows aluminum block placed in the acrylic box.
Seven observers (two oral and maxillofacial radiologists with 3 and 10 years’ experience interpreting digital images, respectively, and five radiological technologists with 3–18 years of clinical experience) recorded the detectable holes in all randomly displayed images. The number of holes each observer could perceive with a 50% confidence level was checked in each step. All viewing was performed under subdued and uniform lighting conditions. A two-megapixel medical color liquid-crystal display (LCD) (Radiforce RX210, Eizo Corporation, Ishikawa, Japan) was used. The LCD was calibrated to the grayscale standard display function by using a quality-control software (RadiCS, Eizo Corporation, Ishikawa, Japan) and a near-range luminance meter (RadiCS UX1 Sensor, Eizo Corporation, Ishikawa, Japan). The native resolution size of this LCD in pixels was 1200 × 1600 (horizontal: vertical = 3: 4). The enlarged display mode used in clinical practice that maintained the aspect ratio of the enlarged image was used. In this study, the images acquired by each image capture mode (HS, HR, and SHR) displayed that the vertical and horizontal were enlarged 2.3, 1.3, and 0.75 times, respectively. The observers were allowed to change the brightness and/or contrast on the LCD. However, no other image processing or enhancement tools of LCD function were used. Before the actual observation study, each observer viewed five images to get familiar with the phantom images on X-rays (pre-training) and to learn adjustment of the brightness or contrast of the LCD. The images used in the training session remained different from those used in the actual observer study.
The average numbers of perceptible holes in each experimental condition were compared by analysis of variance. Post-hoc comparisons were performed with Bonferroni's method. A statistical significance was defined at p-values < 0.017 (0.05/3). Moreover, the average total numbers of perceptible holes for all observers in each image capture mode were also compared in the same way.
Results
Figure 3 shows the relationship between the selected exposure time in the X-ray generator and the relative exposure dose. Figure 4 shows the digital characteristic curves that indicate the relationships between the exposure dose and the pixel value for RAW images with all image capture modes. They demonstrate the linear relationships between the exposure dose and the pixel value over a wide range of exposure doses (coefficient of determination, R2 >0.999). The absolute value of inclination GHS (−56.10) of the digital characteristic curves of HS was larger than that of inclination GHR (−47.89) or GSHR (−33.74) of the digital characteristic curves of HR or SHR (Figure 4). In the HS and HR image capture modes, the exposure at which the pixel values saturated was about 60 and 70% lower than the SHR (Figure 4).
Figure 3.

The relationship between the selected exposure time in the X-ray generator and the relative exposure dose.
Figure 4.

Comparison of digital characteristic curves of RAW images of each image capture mode.
The MTFs in the horizontal and vertical directions calculated by each image capture mode are shown in Figure 5, and Table 2 shows the spatial resolution values at 10% MTF measured for these images. The MTFs in the vertical direction for all image capture modes were higher than those in the horizontal direction, and the 10% MTFs showed similar trends. The presampled MTF of the SHR was slightly higher than that of the other image capture modes in the horizontal direction, at frequencies greater than five cycles/mm. On the other hand, there was practically no difference for presampled MTFs in the vertical directions of each image capture mode.
Figure 5.
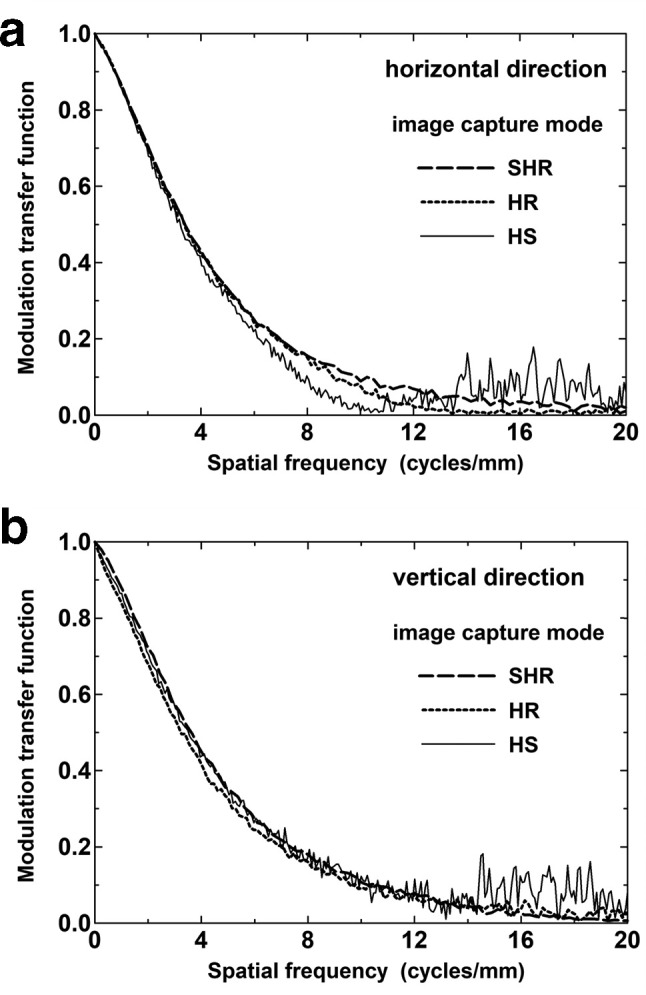
Comparison of the presampled MTFs for (a) horizontal and (b) vertical directions in each capture mode. The directions correspond to those in Figure 1. MTF, modulation transferfunction
Table 2.
The values of spatial resolution at 10% MTF for the vertical and horizontal direction with each image capture mode
| Image capture modes | Horizontal direction | Vertical direction |
|---|---|---|
| HS | 7.60 | 9.77 |
| HR | 9.09 | 9.90 |
| SHR | 10.01 | 10.25 |
HR, high-resolution;HS, high-speed; MTF, modulation transfer function ; SHR, super high-resolution.
The pixel value used for the measurement of the NNPS was calculated by subtracting each pixel value from a maximum pixel value (65,536 levels, 16-bits) because the pixel values were inversely proportional to the exposure doses. The NNPSs of SHR under various exposure doses are shown in Figure 6. As the exposure dose increased, the NNPS decreased rapidly in the horizontal direction at more than about 12 cycles/mm compared to the vertical direction. These trends were also confirmed in all image capture modes. Figure 7 shows the NNPSs of each image capture mode in the horizontal and vertical direction under the same exposure dose, (A) 0.43 mGy and (B) 0.86 mGy. Figure 7 (C) shows NNPSs with HS and HR at 0.86 mGy, and SHR at 0.43 mGy, respectively. The NNPS at four cycles/mm with SHR was about 40% or 20% lower than that those with HS or HR, respectively, under the same exposure dose (Figure 7 (A), (B)). These trends were also confirmed in both directions. Moreover, the NNPS with SHR at 0.43 mGy was lower than that with HS and HR at 0.86 mGy (Figure 7 (C)). Because there were similar trends for NNPSs with exposure dose of 0.54 and 0.65 mGy, they are not shown in Figure 7.
Figure 6.

NNPSs for SHR at several exposures in (a) the horizontal and (b) vertical directions under various exposure doses. NNPS, normalized noisepower spectrum; SHR, super high-resolution.
Figure 7.

NNPSs of each image capture mode in the horizontal and vertical direction under various exposure conditions. The exposure doses were (a) 0.43 mGy and (b) 0.86 mGy. Figure (c) was shown NNPSs with HS and HR at 0.86 mGy, and SHR at 0.43 mGy. NNPS, normalized noise power spectrum; HS, high-speed; HR, high-resolution; SHR, super high-resolution.
Figure 8 shows the average total number of perceptible holes from all steps plotted against exposure doses for each capture mode by the seven observers. The error bars in the graph represent the standard deviation across observer. The points and error bars in the figure were slightly shifted on the x-axis due to overlapping and wide standard deviations at each exposure dose. The total number of perceptible holes in SHR was higher than that of HS and HR in each exposure dose. In the post-hoc test with Bonferroni‘s method, there was a statistically significant difference between HS and SHR in exposure dose of 0.43 mGy (p-value < 0.0001). However, no significant difference was found (p-value > 0.017) at other combinations in all exposure conditions.
Figure 8.

Total numbers of perceptible holes at several exposure doses for each image capture mode. The error bars in the graph indicate the standard deviation. The points and error bars in this figure were slightly shifted on the x-axis because they overlapped, to a great extent, at the point of HR. HR, high-resolution
Figure 9 shows the average total numbers of perceptible holes in observer study for each image capture mode. The number of perceived holes obtained with SHR was significantly higher than that with HS (p-value < 0.017). However, no significant difference was found (p-value > 0.017) between HS and HR, and HR and SHR.
Figure 9.

Average total numbers of perceptible holes at observers for each image capture mode. The error bars in the graph indicate the standard deviation. In the post-hoc test with Bonferroni‘s method, the number of perceived holes obtained with SHR was significantly higher than that with HS (p-value < 0.017). HS, high-speed; SHR, superhigh-resolution.
Discussion
This study examined the effect of the pixel sizes on image quality in the PSP system by physical and visual evaluations.
The characteristic curve, which is the relationship between the exposure doses of the RAW images and the pixel values, showed a noticeable difference in each image capture mode. The reason for this difference may be associated with the size of ROI to obtain average pixel values in each image capture mode. In this study, the same size of ROI (300 × 300 pixels) was set in each image capture mode. As the pixel size decreases, the intensity of photostimulated luminescence in unit pixels of IP also decreases. Another reason may be related to the change in the spot diameter of the laser-beam during IP reading in the PSP system due to the difference in image capture mode. As the pixel size decreases, the spot diameter of the laser-beam and the laser intensity decreases. The intensity of photostimulated luminescence change depends on laser intensity. Therefore, the amount of luminescence per unit exposure dose changes in each image capture mode. As a result, the digital characteristic curves of the RAW images in each image capture mode shows a different trend.
The presampled MTF in the horizontal direction was slightly lower than that in the vertical direction for each image capture mode (Figure 5). Previous studies36,37,40,41 have reported that the presampled MTF in the horizontal direction (laser-beam scanning direction) for the PSP system strongly depends on the readout direction of the edge profile. The dominant factors related to the resolution characteristics of the PSP system are as follows: the diameter of the laser-beam spot, diffusion of the laser-beam in the plate, afterglow of photostimulated luminescence, and the frequency characteristic of the logarithmic amplifier.42 The afterglow of photostimulated, luminescence and the frequency characteristic of the logarithmic amplifier would affect resolution characteristics in the horizontal direction only. The afterglow is caused by the lagging of photostimulated luminescence and will increase the effective sampling aperture size in the horizontal direction. The scan time of IP in each image capture mode is different, and the scan time of HS and HR are less than one-quarter and half of SHR (Table 1). The afterglow is closely associated with scan time. Therefore, the HS would be strongly influenced by the afterglow of photostimulated luminescence compared with other image capture modes. As a result, MTFs were different for each image capture mode and each direction.
The NNPS of all image capture modes decreases as spatial frequency increases (Figures 6 and 7). Moreover, the NNPSs in the horizontal direction of HR and SHR image capture modes decreased rapidly at high spatial frequencies due to the low-pass filter for suppressing the interference pattern of the aliasing error (Figure 7). The NNPSs depended on image capture mode, that is, the pixel size. Dobbins III et al43 and Lazzari et al44 reported similar results in their assessment of digital imaging systems and concluded that the MTF/noise ratio could be enhanced by decreasing the pixel size. In accordance with this theory, the NNPSs in our results decreased as the pixel size decreased.
The image quality of each image capture mode and exposure dose could be quantified using the perceptible numbers of holes in the self-made step Al phantom. The detector of the PSP systems used in this study had a wide dynamic range. However, objective criteria for gray scale to determine the optimum performance have not been reported. Therefore, the observers were allowed to change the brightness or contrast on the high-resolution monitor (two-megapixels) and observation time was not controlled.
The total number of perceptible holes at several exposure doses showed no significant differences among each image capture mode. However, the score with SHR was higher than that with HS and HR. These observations suggest that the visibility of the holes is related to the change of MTF and NNPS due to differences in pixel size. The NNPS with SHR was about 75% lower than that with HS under the same exposure dose. Moreover, the NNPS with SHR at 0.43 mGy was lower than that with HS at 0.86 mGy. Thus, the SHR may have the potential to reduce the exposure dose more compared to the HS, without increasing noise. Our results suggest that the small pixel size is useful for obtaining maximum diagnostic accuracy (especially for the detection of small lesions).
For indicating actual changes in the clinical images, the sample image of the molar region of a dry human mandible phantom using each image capture mode are presented in Figure 10. These are enlarged for the three evaluation structures. Moreover, an expanded part of the alveolar bone proper and the alveolar process surrounded by dot square was displayed. Exposure conditions of the dental X-ray unit were set at a of tube voltage of 70 kV, tube current of 7 mA, and exposure time of 0.16 s (exposure doses: 0.86 mGy) based on usual clinical practice. The visibility of the pulp cavity was enhanced by SHR compared to HS (line arrows). Furthermore, the distal tooth root canal could be clearly observed with SHR (dotted line arrows). The visibility of the trabecular pattern in the alveolar bone proper and the alveolar process with SHR was better than that with HS (dot square). Because the presampled MTFs in each image capture mode showed only slight differences, the differences in the visibility may be mainly due to low NNPS in the SHR. In the present study, these effects were confirmed by using anthropomorphic phantom with dry human mandible simulating the tissues in the human body. Thus, similar results would be expected in actual clinical conditions. We believe that superior visibility with low NNPS of the SHR shows the potential for exposure dose reduction compared to the other image capture modes if the scan time is not considered.
Figure 10.

Images of the phantom of the molar region of a dry human mandible. The image capture modes were (A) HS, (B) HR and (C) SHR. An expanded part of the alveolar bone of the root apex and alveolar bone of the alveolar ridge surrounded by dot square are displayed. These images were set at optimum window. HS,high-speed; HR, high-resolution; SHR, super high-resolution.
The present study had some limitations. First, the study did not refer to systems developed by other manufacturers. Properties of MTF depend on the scanning direction of laser-beam that varies with the PSP system used. Strictly speaking, our results cannot be applied to the general features of PSP systems. Therefore, additional systematic research using other PSP systems needs to be conducted. However, to the best of our knowledge, the pixel size, the scan time, and the various image capture modes could be changed in other manufacturers' PSP systems. Therefore, similar results could be expected in other systems too. Moreover, our findings could be useful for a large number of users with the PSP systems changing the pixel size. Second, the balance between image quality and scan time was not optimized. The scan time of SHR is more than four times that of HS and about two times that of HR. In clinical practice, a full mouth series of intraoral radiographs requires 10 or 14 X-rays. Therefore, scan time is a critical factor in operational efficiency. We did not evaluate operational efficiency because our research did not intend to optimize the balance between image qualities and scan time. Third, the visual evaluation was not extended to other regions such as the anterior teeth. The visibility for other areas would be different from our results, depending on exposure dose and image quality. The molars need high exposure dose, and the noise characteristics in this molar region are expected to be the worst. Therefore, the visibility for other regions in the oral cavity may be better than that for the molar region. Further investigations are needed with different evaluation areas.
Conclusion
The MTF in small pixel size with SHR was superior to that with HS and HR, and the NNPS with SHR was slightly lower than that with HS and HR under the same exposure dose. The effect of this difference of image quality on visibility was confirmed using Al step phantom and the molar region of a dry human mandible phantom. The SHR mode has the potential to decrease the radiation dose without compromising the image quality compared to other image capture modes.
Footnotes
Acknowledgment: The authors are grateful to the staff of the Department of Oral and Maxillofacial Radiology and the Division of Radiology at Kyushu University Hospital for their valuable clinical support. The authors also wish to thank Nobukazu Tanaka of Department of Health Sciences at Kyushu University and Jun Ito of Trophy Radiology Japan for their assistance with this study.
Funding: This research did not receive any specific grant from any the public, commercial, or not-for-profit funding agencies.
Contributor Information
Taku Kuramoto, Email: t.kura13@gmail.com.
Kazunori Yoshiura, Email: yoshiura@rad.dent.kyushu-u.ac.jp.
REFERENCES
- 1.Dashpuntsag O, Yoshida M, Kasai R, Maeda N, Hosoki H, Honda E. Numerical evaluation of image contrast for thicker and thinner objects among current intraoral digital imaging systems. Biomed Res Int 2017; 2017: 1–10. doi: 10.1155/2017/5215413 [DOI] [PMC free article] [PubMed] [Google Scholar]
- 2.Kashima I. Computed radiography with photostimulable phosphor in oral and maxillofacial radiology. Oral Surg Oral Med Oral Pathol Oral Radiol Endod 1995; 80: 577–98. doi: 10.1016/S1079-2104(05)80155-6 [DOI] [PubMed] [Google Scholar]
- 3.Syriopoulos K, Sanderink GC, Velders XL, van der Stelt PF. Radiographic detection of approximal caries: a comparison of dental films and digital imaging systems. Dentomaxillofac Radiol 2000; 29: 312–8. doi: 10.1038/sj.dmfr.4600553 [DOI] [PubMed] [Google Scholar]
- 4.Brennan J. An introduction to digital radiography in dentistry. J Orthod 2002; 29: 66–9. doi: 10.1093/ortho/29.1.66 [DOI] [PubMed] [Google Scholar]
- 5.Hintze H, Wenzel A. Influence of the validation method on diagnostic accuracy for caries. A comparison of six digital and two conventional radiographic systems. Dentomaxillofac Radiol 2002; 31: 44–9. doi: 10.1038/sj.dmfr.4600645 [DOI] [PubMed] [Google Scholar]
- 6.Martins MGBQ, Whaites EJ, Ambrosano GMB, Haiter Neto F. What happens if you delay scanning Digora phosphor storage plates (PSPs) for up to 4 hours? Dentomaxillofac Radiol 2006; 35: 143–6. doi: 10.1259/dmfr/29710762 [DOI] [PubMed] [Google Scholar]
- 7.Farman AG, Farman TT. A comparison of 18 different X-ray detectors currently used in dentistry. Oral Surg Oral Med Oral Pathol Oral Radiol Endod 2005; 99: 485–9. doi: 10.1016/j.tripleo.2004.04.002 [DOI] [PubMed] [Google Scholar]
- 8.Boyacıoğlu H, İlgüy M, Ergün S, İlgüy D, Güneri P. How many times can we use a phosphor plate? A preliminary study. Dentomaxillofac Radiol 2008; 38: 42–7. [DOI] [PubMed] [Google Scholar]
- 9.Snel R, Van De Maele E, Politis C, Jacobs R. Digital dental radiology in Belgium: a nationwide survey. Dentomaxillofac Radiol 2018; 47: 20180045. doi: 10.1259/dmfr.20180045 [DOI] [PMC free article] [PubMed] [Google Scholar]
- 10.Trevor STT, Anil K, Massieh M, Pascal NT, Wenda Z, Susanne P;in press The effects of physical photostimulable phosphor plate artifacts on the radiologic interpretation of periapical inflammatory disease. Oral Surg Oral Med Oral Pathol Oral Radiol 2019. [DOI] [PubMed] [Google Scholar]
- 11.Tanaka N, Yano Y, Yabuuchi H, Akasaka T, Sasaki M, Ohki M, et al. Basic imaging properties of an indirect flat-panel detector system employing irradiation side sampling (ISS) technology for chest radiography: comparison with a computed radiographic system. Radiol Phys Technol 2013; 6: 162–9. doi: 10.1007/s12194-012-0184-z [DOI] [PubMed] [Google Scholar]
- 12.Weerawanich W, Shimizu M, Takeshita Y, Okamura K, Yoshida S, Yoshiura K. Cluster signal-to-noise analysis for evaluation of the information content in an image. Dentomaxillofac Radiol 2018; 47: 20170147. doi: 10.1259/dmfr.20170147 [DOI] [PMC free article] [PubMed] [Google Scholar]
- 13.Takeshita Y, Shimizu M, Jasa GR, Weerawanich W, Okamura K, Yoshida S, et al. Prediction of detectability of the mandibular canal by quantitative image quality evaluation using cone beam CT. Dentomaxillofac Radiol 2018; 47: 20170369. doi: 10.1259/dmfr.20170369 [DOI] [PMC free article] [PubMed] [Google Scholar]
- 14.Doi K, Strubler K, Rossmann K. Truncation errors in calculating the MTf of radiographic screen-film systems from the line spread function. Phys Med Biol 1972; 17: 241–50. doi: 10.1088/0031-9155/17/2/010 [DOI] [PubMed] [Google Scholar]
- 15.Morishita J, Doi K, Bollen R, Bunch PC, Hoeschen D, Sirand-rey G, et al. Comparison of two methods for accurate measurement of modulation transfer functions of screen-film systems. Med Phys 1995; 22: 193–200. doi: 10.1118/1.597456 [DOI] [PubMed] [Google Scholar]
- 16.Giger ML, Doi K, Fujita H. Investigation of basic imaging properties in digital radiography. 7. noise Wiener spectra of II-TV digital imaging systems. Med Phys 1986; 13: 131–8. doi: 10.1118/1.595937 [DOI] [PubMed] [Google Scholar]
- 17.Samei E, Ranger NT, Dobbins JT, Chen Y. Intercomparison of methods for image quality characterization. I. modulation transfer functiona. Med Phys 2006; 33: 1466–65. doi: 10.1118/1.2188816 [DOI] [PubMed] [Google Scholar]
- 18.Samei E, Flynn MJ, Reimann DA. A method for measuring the presampled MTf of digital radiographic systems using an edge test device. Med Phys 1998; 25: 102–13. doi: 10.1118/1.598165 [DOI] [PubMed] [Google Scholar]
- 19.Fujita H, Morishita J, Ueda K, Tsai DY, Ohtsuka A, Fujikawa T. Resolution properties of a computed radiographic system. Proc SPIE 1989; 1090: 263–76. [DOI] [PubMed] [Google Scholar]
- 20.Ideguchi T. Physical image quality assessment in digital radiography: the evaluation of physical imaging properties for digital radiography -the resolution properties (the slit method. In Japanese.] Jpn J Radiol Technol 2009; 65: 1109–17. [DOI] [PubMed] [Google Scholar]
- 21.Araki K, Endo A, Okano T. An objective comparison of four digital intra-oral radiographic systems: sensitometric properties and resolution. Dentomaxillofac Radiol 2000; 29: 76–80. doi: 10.1038/sj.dmfr.4600504 [DOI] [PubMed] [Google Scholar]
- 22.Vandre RH, Pajak JC, Abdel-Nabi H, Farman TT, Farman AG. Comparison of observer performance in determining the position of endodontic files with physical measures in the evaluation of dental X-ray imaging systems. Dentomaxillofac Radiol 2000; 29: 216–22. doi: 10.1038/sj.dmfr.4600533 [DOI] [PubMed] [Google Scholar]
- 23.Farman TT, Vandre RH, Pajak JC, Miller SR, Lempicki A, Farman AG. Effects of scintillator on the modulation transfer function (MTf) of a digital imaging system. Oral Surg Oral Med Oral Pathol Oral Radiol Endod 2005; 99: 608–13. doi: 10.1016/j.tripleo.2004.08.013 [DOI] [PubMed] [Google Scholar]
- 24.Farman TT, Vandre RH, Pajak JC, Miller SR, Lempicki A, Farman AG. Effects of scintillator on the detective quantum efficiency (DQE) of a digital imaging system. Oral Surg Oral Med Oral Pathol Oral Radiol Endod 2006; 101: 219–23. doi: 10.1016/j.tripleo.2005.07.032 [DOI] [PubMed] [Google Scholar]
- 25.Samei E, Flynn MJ. An experimental comparison of detector performance for computed radiography systems. Med Phys 2002; 29: 447–59. doi: 10.1118/1.1449873 [DOI] [PubMed] [Google Scholar]
- 26.Samei E, Flynn MJ. An experimental comparison of detector performance for direct and indirect digital radiography systems. Med Phys 2003; 30: 608–22. doi: 10.1118/1.1561285 [DOI] [PubMed] [Google Scholar]
- 27.Yoshiura K, Stamatakis HC, Welander U, McDavid WD, Shi XQ, Ban S, et al. Physical evaluation of a system for direct digital intra-oral radiography based on a charge-coupled device. Dentomaxillofac Radiol 1999; 28: 277–83. doi: 10.1038/sj.dmfr.4600457 [DOI] [PubMed] [Google Scholar]
- 28.Kunitomo H. Modulation transfer function--presampled MTF measurements by Fourier analysis using square wave chart. Nihon Hoshasen Gijutsu Gakkai Zasshi 2009; 65: 1561–7. doi: 10.6009/jjrt.65.1561 [DOI] [PubMed] [Google Scholar]
- 29.Brüllmann DD, d'Hoedt B, D’Hoedt B. The modulation transfer function and signal-to-noise ratio of different digital filters: a technical approach. Dentomaxillofac Radiol 2011; 40: 222–9. doi: 10.1259/dmfr/33029984 [DOI] [PMC free article] [PubMed] [Google Scholar]
- 30.IEC 62220-1-1, medical electrical equipment -characteristics of digital X-ray imaging devices- part 1-1: determination of the detective quantum efficiency. International Electrotechnical Commission 2015;. [Google Scholar]
- 31.IEC 61267, medical diagnostic X-ray equipment -radiation conditions for use in the determination of characteristics. International Electrotechnical Commission 1994;. [Google Scholar]
- 32.Sogur E, Baksi BG, Mert A. The effect of delayed scanning of storage phosphor plates on occlusal caries detection. Dentomaxillofac Radiol 2012; 41: 309–15. doi: 10.1259/dmfr/12935491 [DOI] [PMC free article] [PubMed] [Google Scholar]
- 33.Kanai K, Ohtsuka A, Morishita J, Yamauchi S, Ueda K, Nishihara S, et al. COMPARISON OF MEASUREMENT METHODS OF CHARACTERISTIC CURVES FOR DIGITAL SUBTRACTION ANGIOGRAPHY(DSA) SYSTEMS. Nippon Hoshasen Gijutsu Gakkai Zasshi 1988; 44: 1492–6. doi: 10.6009/jjrt.KJ00001360363 [DOI] [Google Scholar]
- 34.Morishita J, Fujita H, Sakamoto K, Ueda K, Ohtsuka A, Fujikawa T, et al. Measurements of characteristic curves in a computed radiographic system (II. Med Imaging Inf Sci 1989; 6: 25–38. [Google Scholar]
- 35.Higashide R. Modulation transfer function--edge method--. Nihon Hoshasen Gijutsu Gakkai Zasshi 2009; 65: 1449–56. doi: 10.6009/jjrt.65.1449 [DOI] [PubMed] [Google Scholar]
- 36.Fetterly KA, Hangiandreou NJ, Schueler BA, Ritenour ER. Measurement of the presampled two-dimensional modulation transfer function of digital imaging systems. Med Phys 2002; 29: 913–21. doi: 10.1118/1.1472498 [DOI] [PubMed] [Google Scholar]
- 37.Fetterly KA, Schueler BA. Performance evaluation of a "dual-side read" dedicated mammography computed radiography system. Med Phys 2003; 30: 1843–54. doi: 10.1118/1.1584045 [DOI] [PubMed] [Google Scholar]
- 38.Yoshiura K, Kawazu T, Chikui T, Tatsumi M, Tokumori K, Tanaka T, et al. Assessment of image quality in dental radiography, part 1: phantom validity. Oral Surg Oral Med Oral Pathol Oral Radiol Endod 1999; 87: 115–22. doi: 10.1016/S1079-2104(99)70304-5 [DOI] [PubMed] [Google Scholar]
- 39.Yoshiura K, Kawazu T, Chikui T, Tatsumi M, Tokumori K, Tanaka T, et al. Assessment of image quality in dental radiography, part 2: optimum exposure conditions for detection of small mass changes in 6 intraoral radiography systems. Oral Surg Oral Med Oral Pathol Oral Radiol Endod 1999; 87: 123–9. doi: 10.1016/s1079-2104(99)70305-7 [DOI] [PubMed] [Google Scholar]
- 40.Dobbins JT, Ergun DL, Rutz L, Hinshaw DA, Blume H, Clark DC. DQE(f) of four generations of computed radiography acquisition devices. Med Phys 1995; 22: 1581–93. doi: 10.1118/1.597627 [DOI] [PubMed] [Google Scholar]
- 41.Kengyelics SM, Launders JH, Cowen AR. Physical imaging performance of a compact computed radiography acquisition device. Med Phys 1998; 25: 354–60. doi: 10.1118/1.598212 [DOI] [PubMed] [Google Scholar]
- 42.Tanaka N, Morishita J, Tsuda N, Ohki M. Effect of readout direction in the edge profile on the modulation transfer function of computed radiographic systems by use of the edge method. Radiol Phys Technol 2013; 6: 474–9. doi: 10.1007/s12194-013-0222-5 [DOI] [PubMed] [Google Scholar]
- 43.Dobbins JT. Effects of undersampling on the proper interpretation of modulation transfer function, noise power spectra, and noise equivalent quanta of digital imaging systems. Med Phys 1995; 22: 171–81. doi: 10.1118/1.597600 [DOI] [PubMed] [Google Scholar]
- 44.Lazzari B, Belli G, Gori C, Rosselli Del Turco M. Physical characteristics of five clinical systems for digital mammography. Med Phys 2007; 34: 2730–43. doi: 10.1118/1.2742498 [DOI] [PubMed] [Google Scholar]