Abstract
Despite the rapid advance in single-cell RNA sequencing (scRNA-seq) technologies within the last decade, single-cell transcriptome analysis workflows have primarily used gene expression data while isoform sequence analysis at the single-cell level still remains fairly limited. Detection and discovery of isoforms in single cells is difficult because of the inherent technical shortcomings of scRNA-seq data, and existing transcriptome assembly methods are mainly designed for bulk RNA samples. To address this challenge, we developed RNA-Bloom, an assembly algorithm that leverages the rich information content aggregated from multiple single-cell transcriptomes to reconstruct cell-specific isoforms. Assembly with RNA-Bloom can be either reference-guided or reference-free, thus enabling unbiased discovery of novel isoforms or foreign transcripts. We compared both assembly strategies of RNA-Bloom against five state-of-the-art reference-free and reference-based transcriptome assembly methods. In our benchmarks on a simulated 384-cell data set, reference-free RNA-Bloom reconstructed 37.9%–38.3% more isoforms than the best reference-free assembler, whereas reference-guided RNA-Bloom reconstructed 4.1%–11.6% more isoforms than reference-based assemblers. When applied to a real 3840-cell data set consisting of more than 4 billion reads, RNA-Bloom reconstructed 9.7%–25.0% more isoforms than the best competing reference-based and reference-free approaches evaluated. We expect RNA-Bloom to boost the utility of scRNA-seq data beyond gene expression analysis, expanding what is informatically accessible now.
Single-cell RNA sequencing (scRNA-seq) refers to high-throughput methods that interrogate the transcriptomes of individual cells. Unlike RNA sequencing (RNA-seq) for bulk samples, scRNA-seq enables the detection of cellular transcriptomic heterogeneity for a given sample of cells. Within the last decade, it has been used for studying cancer cells (Navin 2015) and virus-infected cells (Cristinelli and Ciuffi 2018), as well as for building the cell atlas of several species (Cao et al. 2017; The Tabula Muris Consortium 2018; Howick et al. 2019). The early uses of scRNA-seq data analysis have been primarily limited to gene expression quantification. Isoform-level analyses for single cells remain scarce (Arzalluz-Luque and Conesa 2018) and mainly depend on splice-junction detection (Song et al. 2017).
Although long-read sequencing technologies excel in capturing near full-length transcript sequences, which are ideal for isoform-level analyses (Arzalluz-Luque and Conesa 2018), they have a significantly higher error rate, limited sequencing depth, and higher input requirement compared to short-read sequencing technologies (Conesa et al. 2016). Droplet-based short-read sequencing prepared with transcript-end capture protocols (Macosko et al. 2015; Zheng et al. 2017; Cole et al. 2018) are scalable to nearly 1 million cells, but they show low sensitivity and strong transcript-end bias, prohibiting the reconstruction of splice isoforms. Lifting this bias, there are well-based paired-end sequencing protocols, such as Smart-seq2 (Picelli et al. 2013) and SMARTer (Verboom et al. 2019), that offer better sensitivity and full-length transcript sequencing for single cells, thus permitting both expression quantification and isoform structure analysis. However, these scRNA-seq protocols are predominantly used for gene expression profiling at the single-cell level. For example, 7427 data series on Gene Expression Omnibus were generated with Smart-seq2 or SMARTer (Supplemental Methods). Therefore, new bioinformatics approaches are required to leverage the sequencing data for isoform analysis in these data sets.
To gain enough input RNA for sequencing, minute amounts of RNA from each cell must be heavily amplified; thus, scRNA-seq data are highly prone to technical noise. Current scRNA-seq assembly methods are primarily intended for specific gene targets (Canzar et al. 2017; Lindeman et al. 2018; Rizzetto et al. 2018), and assembly methods for bulk RNA-seq do not effectively accommodate uneven transcript coverage and amplified background noise in scRNA-seq data. In principle, pooling reads from multiple cells can introduce reads to low-coverage and noisy regions of transcripts, thus closing coverage gaps and increasing the signal-to-noise ratio (Supplemental Fig. S1). Yet, naively pooling reads from multiple cells would obscure the cell precision of the assembly process. Further, pooling reads for coassembly for multiple cells would require much more memory than assembling the sequencing data for each individual cell. The overall run time for coassembly is also expected to be significantly slower than the assembly for individual cells because the aggregated sequencing data of multiple cells increases the complexity of the assembly problem.
Reference-based assembly methods, such as StringTie (Pertea et al. 2015) and Scallop (Shao and Kingsford 2017), reconstruct transcripts based on the alignment of reads against the reference genome. Compared to reference-free methods, reference-based methods tend to be better and more resource-efficient at assembling transcripts for known species. Furthermore, their assemblies are usually chains of concordant exon coordinates on the reference genome and therefore are free from chimeric transcripts. However, the absolute dependence on a reference genome often disables reference-based assemblers’ ability to reconstruct gene fusion transcripts, foreign transcripts (such as those from viruses), and inter-species chimeric transcripts, of which all are candidates for transcriptomic markers in diseases. Reference-free assemblers, on the contrary, can still assemble these transcripts as no assumptions are made on the origin of input reads.
According to a comprehensive study (Hölzer and Marz 2019), Trans-ABySS (Robertson et al. 2010), Trinity (Grabherr et al. 2011), and rnaSPAdes (Bushmanova et al. 2019) are the leading reference-free transcriptome assembly tools, and they all follow the de Bruijn graph (DBG) assembly paradigm. Although these methods use a hash table data structure to store the DBG in memory, recent genome assembly approaches (Chikhi and Rizk 2013; Jackman et al. 2017) showed how memory requirements may be reduced by adopting succinct data structures, such as Bloom filters (Bloom 1970), for compact k-mer storage to representing an implicit DBG. Adapting this strategy for scRNA-seq assembly is an attractive proposition for reducing memory consumption.
Existing reference-free assembly methods typically rely on alignment of paired-end reads against assembled sequences to reconstruct longer transcript sequences. Read alignments can be computationally costly, especially when performed against a nonstatic target that cannot be indexed in advance, such as earlier stages of reference-free assembly approaches. We note that recent RNA-seq quantification tools, such as kallisto (Bray et al. 2016), reduce run time by replacing alignment with pseudoalignment. Borrowing the strategy of substituting read alignment with a lightweight alternative should also benefit run times when assembling transcriptomes.
Taking all these into account, we developed RNA-Bloom for single-cell transcriptome assembly of paired-end short-read sequencing data from well-based technologies. RNA-Bloom uses a pooled assembly approach to leverage sequencing content from multiple cells for improved transcript reconstruction of individual cells. It follows the DBG assembly paradigm but uses Bloom filters for efficient in-memory storage of k-mers as well as k-mer counts derived from the reads of all cells, yielding an implicit DBG. This DBG is only used for reconstructing fragments from read pairs; to maintain cell precision, a new DBG built from each cell's fragment k-mers is used for reconstructing transcripts from fragments. Owing to the anticipated slower run time of coassembly, RNA-Bloom uses paired distant k-mers derived from reads and reconstructed fragments as a fast alternative to read alignments. Like paired-end reads, these paired distant k-mers are used to guide the elongation of reconstructed fragments into full-length transcript sequences.
RNA-Bloom can assemble both bulk RNA-seq and scRNA-seq data without any reference sequences, and it runs in the reference-free mode by default. As a hybrid of reference-free and reference-based strategies, RNA-Bloom has the option to assemble transcripts in reference-guided mode where a reference transcriptome is available. In RNA-Bloom's reference-guided mode, k-mer pairs from a transcriptome reference are included in addition to those derived from reads and fragments. Therefore, the reference is only used to guide the assembly and RNA-Bloom can still assemble nonreference sequences, such as novel isoforms and foreign transcripts, in both reference-free and reference-guided modes.
Results
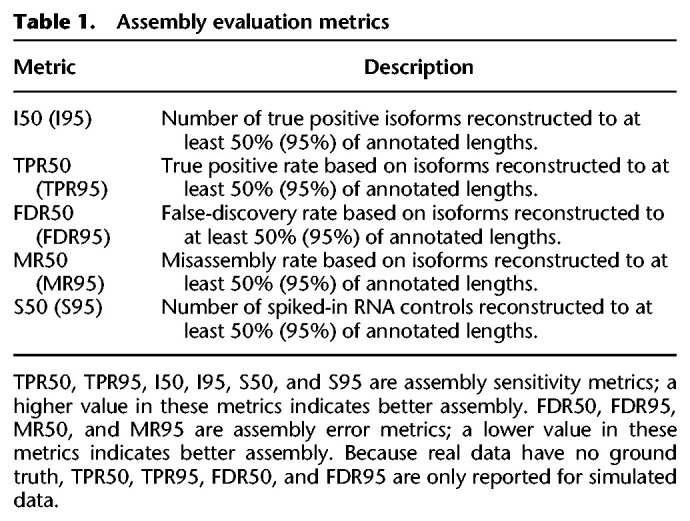
RNA-Bloom can optionally run in bulk or pooled assembly mode with or without reference guidance; it is important to understand their synergistic effects on assembly quality. In our benchmarks, we evaluated all four combinations: (1) reference-free mode only (RB), (2) reference-guided mode only (RB(ref)), (3) reference-free pooled assembly mode (RB(pool)), and (4) reference-guided pooled assembly mode (RB(ref,pool)). We compared RNA-Bloom against three reference-free RNA-seq assemblers (Trans-ABySS, Trinity, and rnaSPAdes) and two reference-based RNA-seq assemblers (StringTie and Scallop). We examined the assembly quality and computing performance of these approaches on both simulated and real data. Assembly evaluation metrics discussed in this study are described in Table 1 and Supplemental Methods and are calculated based on assembly evaluation with rnaQUAST (Bushmanova et al. 2016).
Table 1.
Assembly evaluation metrics
Benchmarking on bulk RNA-seq data
We first investigated the performance of RNA-Bloom on both simulated and real bulk RNA-seq samples. We simulated one sample with RSEM (Li and Dewey 2011) based on a real bulk RNA-seq sample (European Nucleotide Archive [ENA] run accession: ERR523093) of real mouse serum embryonic stem cells (Kolodziejczyk et al. 2015). The simulation procedure is described in Supplemental Methods. For benchmarking on real data, we used another bulk RNA-seq sample (ENA run accession: ERR523027) of the same cell type from the same study.
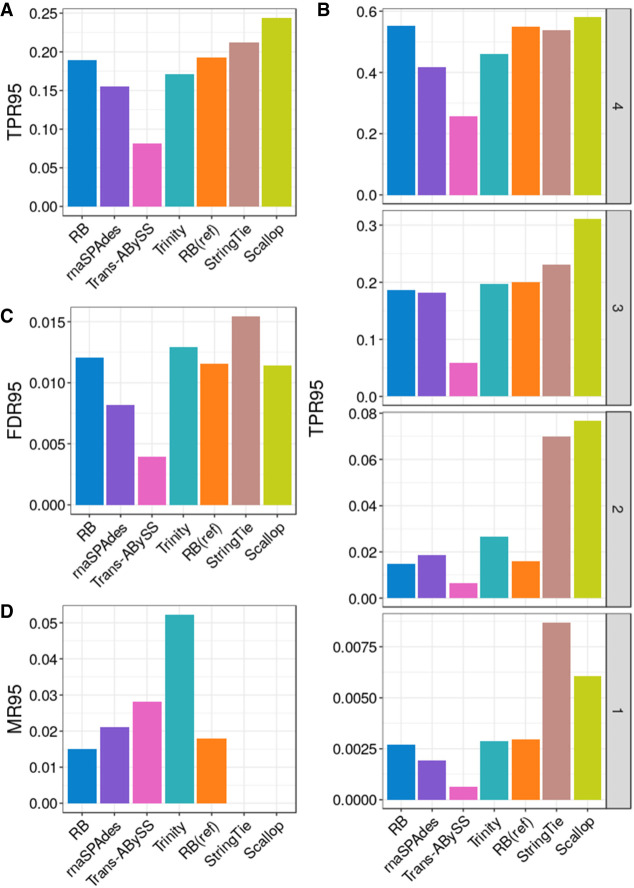
The assembly quality benchmarking results for simulated data based on I95 and I50 are summarized in Figure 1 and Supplemental Figure S2, respectively. RB and RB(ref) have higher true positive rates (TPR95 = 18.9%, 19.3%, respectively) than all other reference-free methods evaluated (Fig. 1A). As expected, Scallop and StringTie, being reference-based methods, have the highest true positive rates (TPR95 = 24.4%, 21.2%, respectively) and lowest misassembly rate (MR95 = 0 for both). We further examined the isoform reconstruction at different expression levels (Fig. 1B). Scallop, StringTie, RB, and RB(ref) have comparable true positive rates in the highest transcript expression stratum, but StringTie and Scallop have much higher true positive rates in the lowest two strata. However, StringTie has the highest false-discovery rate (FDR95 = 1.5%), followed by Trinity (FDR95 = 1.3%); Trans-ABySS has the lowest false-discovery rate (FDR=0.4%) (Fig. 1C). Trinity has the highest misassembly rate (MR95 = 5.2%), followed by Trans-ABySS (MR95 = 2.8%) (Fig. 1D).
Figure 1.
Assembly quality on mouse simulated bulk RNA-seq data. (A) True positive rate calculated based on I95, denoted as TPR95. (B) True positive rate at four transcript expression strata. Isoforms in strata 1, 2, 3, and 4 have nonzero values of transcripts per million (TPM) in the lowest quartile, second-lowest quartile, second-highest quartile, and the highest quartile, respectively. (C) False-discovery rate calculated based on I95, denoted as FDR95. (D) Misassembly rate calculated based on I95, denoted as MR95.
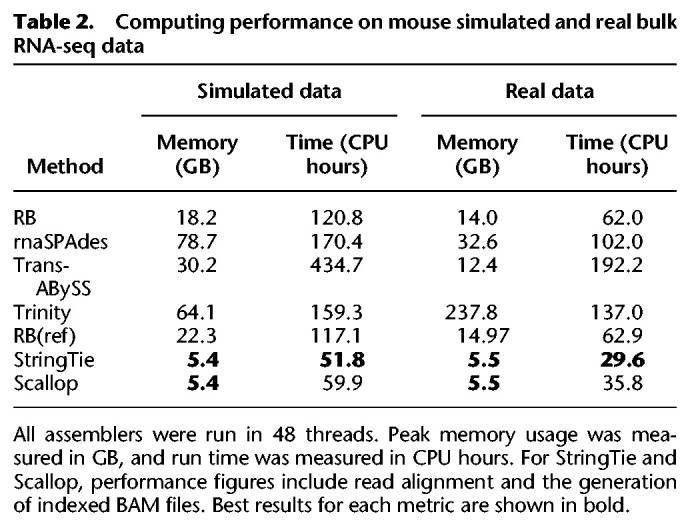
We also compared the assembly quality and computing performance in both simulated and real data; the results are summarized in Figure 2, Supplemental Figure S3, and Table 2. Reference-based methods, Scallop and StringTie, have the highest sensitivity, lowest misassembly rate, fastest run time, and lowest peak memory usage in assembling simulated and bulk data. The computing performance of RB and RB(ref) are very similar in simulated data and they are nearly identical in real data. RB(ref) has a slightly higher sensitivity than RB, but both RB and RB(ref) have higher sensitivity, faster run time, and lower peak memory usage than all other reference-free methods. Although RB and RB(ref) have lower misassembly rates than rnaSPAdes in assembling simulated data, they have higher misassembly rates than rnaSPAdes in assembling real data. Overall, RNA-Bloom improves upon state-of-the-art bulk RNA-seq reference-free methods while maintaining a relatively low computing resource requirement.
Figure 2.
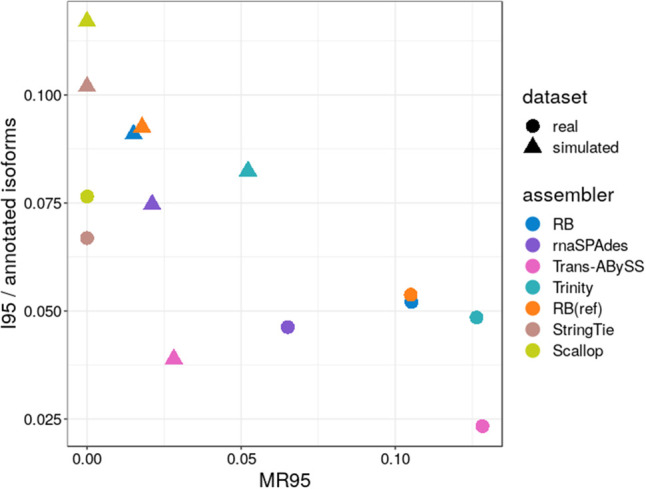
Assembly quality on mouse simulated and real bulk RNA-seq data. Assembly sensitivity was measured as the number of isoforms reconstructed to at least 95% annotated isoform length (denoted as I95) in each data set normalized by the total number of isoforms in reference annotation. Misassembly rate was calculated based on I95, denoted as MR95.
Table 2.
Computing performance on mouse simulated and real bulk RNA-seq data
Benchmarking on simulated scRNA-seq data
We used RSEM (Li and Dewey 2011) to generate a simulated data set containing a total of 495.6 million paired-end 100-bp reads (for the simulation procedures, see Supplemental Methods) based on the single-cell transcriptomes of 384 mouse microglia cells from Tabula Muris (The Tabula Muris Consortium 2018). Using this simulated data set, we assessed each method's assembly quality. Except for RNA-Bloom's pooled assembly modes, that is, RB(pool) and RB(ref, pool), all assembly methods were applied to each cell separately.
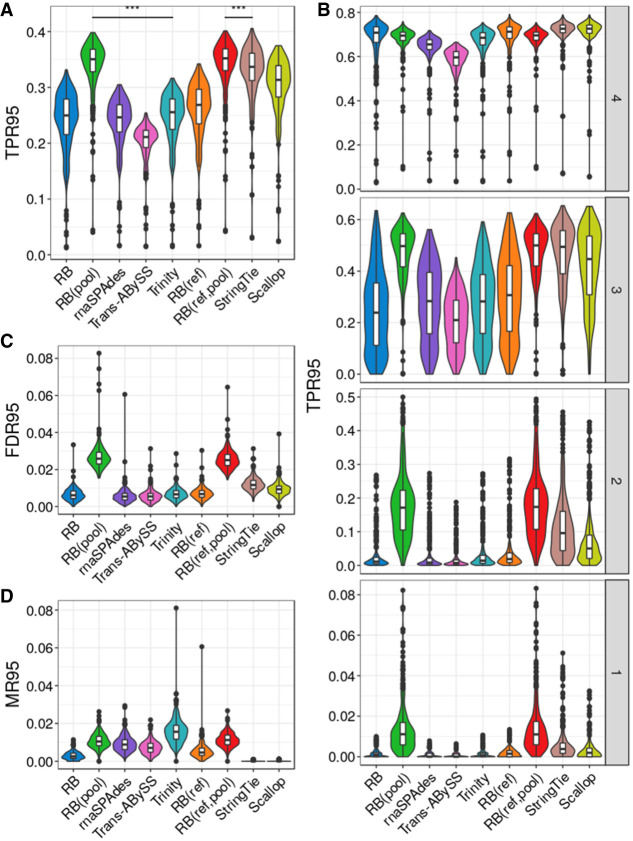
The benchmarking results for simulated isoform reconstruction are summarized in Figure 3, A and B, and Supplemental Figure S4, A and B. Among the reference-free methods, RB(pool) has the largest mean TPR50 (52.8%, with SD = 2.6%) and mean TPR95 (34.0%, SD = 4.5%), whereas Trinity has the second-largest mean TPR95 (24.6%, SD = 4.7%) and RB has the second-largest mean TPR50 (39.1%, SD = 5.1%). Among reference-using methods, RB(ref,pool) has the highest mean TPR50 (53.0%, SD = 2.6%) and TPR95 (34.2%, SD = 4.5%), whereas StringTie has the second-largest mean TPR50 (47.4%, SD = 3.5%) and TPR95 (32.9%, SD = 4.9%). Overall, reference-using methods have better TPR95 than reference-free methods, but RB(pool), being a reference-free method, has a mean TPR95 and TPR50 even larger than both StringTie and Scallop.
Figure 3.
Assembly quality on simulated data for 384 mouse cells. (A) True positive rate calculated based on isoforms reconstructed to at least 95% of annotated length, denoted as TPR95. (B) True positive rate at different transcript expression stratum. (C) False-discovery rate calculated based on isoforms reconstructed to at least 95% of annotated length, denoted as FDR95. (D) Misassembly rate calculated based on isoforms reconstructed to at least 95% of annotated length, denoted as MR95. Distributions of each metric were measured over all 384 cells. The comparison bars on top between RB(pool) and RB(ref,pool) and the next best performer in each class indicate statistical significance of the difference between distributions at P < 0.001 (***) or no significance (NS) using the Wilcoxon test.
We further examined the reconstruction of simulated isoforms at different expression levels. We split the set of all simulated isoforms into four strata based on the quartiles of the expression levels from all cells. For isoforms in the lower expression quartiles (strata 1, 2, 3) (Fig. 3B; Supplemental Fig. S4B), RB(pool) and RB(ref,pool) have the largest TPR95 and TPR50. In particular, the proportional difference between them and other methods were substantially larger in the lower quartiles. For isoforms in the highest expression quartile (stratum 4) (Fig. 3B; Supplemental Fig. S4B), StringTie and RB(ref) tied as the reference-using method with the largest mean TPR50 (75.8%, SD = 3.5% for StringTie and SD = 5.4% for RB(ref)), but StringTie has the highest mean TPR95 (71.8%, SD = 6.3%). Among reference-free methods, RB has the largest mean TPR50 (76.6%, SD = 6.1%), whereas RB(pool) has the largest mean TPR95 (68.4%, SD = 6.0%).
We then evaluated the false-discovery rate and misassembly rate (Fig. 3C,D). rnaSPAdes has the lowest mean FDR50 (4.6%, SD = 2.2%) and FDR95 (0.6%, SD = 0.4%), whereas RB(pool) has the highest mean FDR50 (8.3%, SD = 1.1%) and FDR95 (2.7%, SD = 0.7%). StringTie and Scallop have no misassemblies, which is the expected behavior of reference-based methods. RB and RB(ref) have lower misassembly rates than all other reference-free assemblers, but Trinity has the largest mean MR50 (1.0%, SD = 0.4%) and MR95 (1.6%, SD = 0.7%).
We examined the effect of the number of cells on RNA-Bloom's pooled assembly cell precision (Supplemental Methods) by down-sampling to smaller pools of 96 cells. As the pool size increased, the mean cell precision of RNA-Bloom decreased, but the mean TPR95 increased (Fig. 4). Without pooling (i.e., pool size of one cell), the mean cell precision of the reference-free mode (i.e., RB) and the reference-guided mode (i.e., RB(ref)) are 99.4% (SD = 0.4%) and 99.3% (SD = 0.3%), respectively. At pool size of 96 cells, the mean cell precision of the reference-free mode (i.e., RB(pool)) and the reference-guided mode (i.e., RB(ref,pool)) are 97.5% (SD = 0.5%) and 97.4% (SD = 0.5%), respectively. However, the cell precision for both modes decreased marginally from pool size of 96 cells to 384 cells; in particular, the decrease for the reference-guided mode is not statistically significant (Wilcoxon test, P = 0.8).
Figure 4.
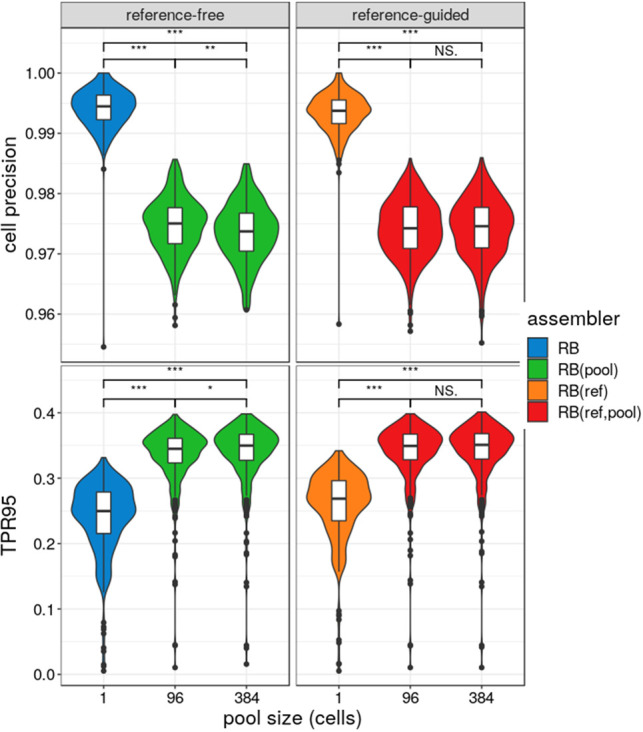
Cell precision and true positive rate of RNA-Bloom's reference-free and reference-guided modes over 384 cells. The simulated data set of 384 cells is split into four smaller subpools of 96 cells and 1 cell. Pool size of 1 refers to no pooling between cells. Each subpool is assembled separately, and the cell precision of the assembled isoforms in each cell is calculated based on the I95. True positive rate was calculated based on I95, denoted as TPR95. Distributions of cell precision and TPR95 were measured over all 384 cells. The comparison bars on top between different pool sizes indicate statistical significance of the difference between distributions at P < 0.001 (***), P < 0.01 (**), P < 0.05 (*), or no significance (NS) using the Wilcoxon test.
Assembly of spiked-in RNA sequences
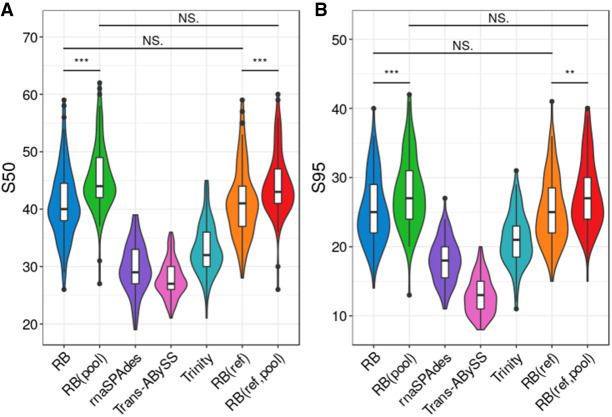
We investigated the ability to reconstruct novel sequences without a priori knowledge of the sequencing data. Therefore, reference-based methods, namely StringTie and Scallop, were omitted from this analysis. Using the five reference-free methods, we assembled a public real data set (Natarajan et al. 2019) composed of 96 mouse embryonic stem cells spiked with External RNA Controls Consortium (ERCC) and Spike-in RNA Variant (SIRV) synthetic transcripts. Because these samples were deeply sequenced, we subsampled each library to 10% of its original size. The assembly results are summarized in Figure 5, A and B. Among reference-free methods, RB(pool) has the largest mean S50 (45.5, SD = 6.0) and S95 (27.9, SD = 5.2), whereas RB has the second-largest mean S50 (41.0, SD = 6.2) and S95 (25.2, SD = 4.9). In addition, we also assembled this data set with RB(ref) and RB(ref,pool) using only the mouse transcriptome reference. The differences in mean S50 and S95 between RB(ref) and RB are not statistically significant (Wilcoxon test, P = 0.91 for S50; P = 0.9 for S95). Similarly, the differences in mean S50 and S95 between RB(ref,pool) and RB(pool) are also not statistically significant (Wilcoxon test, P = 0.11 for S50; P = 0.54 for S95). This shows that reference guidance in RNA-Bloom has no effect on the assembly of novel sequences.
Figure 5.
Assembly sensitivity on experimental data of 96 mouse embryonic stem cells with ERCC and SIRV spiked-in transcripts. (A) Number of spiked-in transcripts reconstructed to at least 50% annotated length, denoted as S50. (B) Number of spiked-in transcripts reconstructed to at least 95% annotated length, denoted as S95. Distributions of each metric were measured over all 96 cells. RB(ref) and RB(ref,pool) assemblies were guided by the mouse transcriptome reference. The comparison bars on top indicate statistical significance of the difference between distributions at P < 0.001 (***), P < 0.01 (**), P < 0.05 (*), or no significance (NS) using the Wilcoxon test.
Assembly of real scRNA-seq data sets
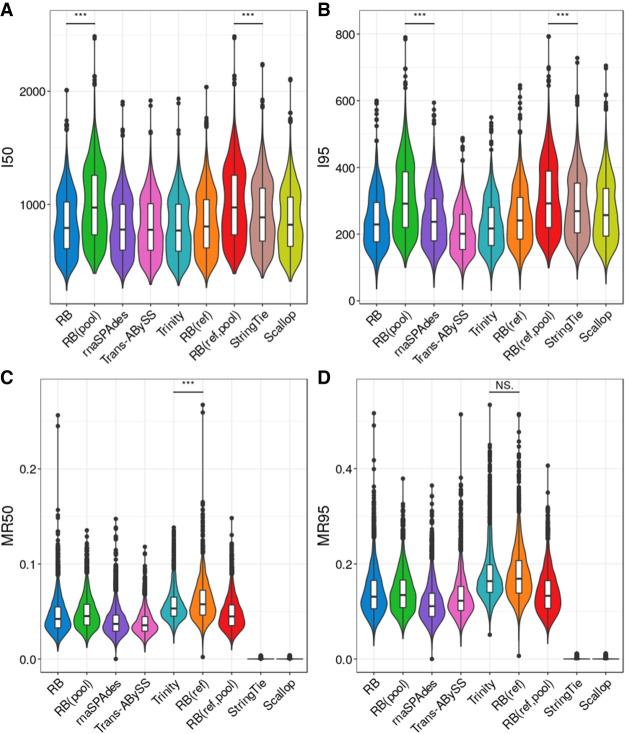
We explored the scalability of all nine assembly approaches on two experimental scRNA-seq data sets. In the first data set, we selected 3840 mouse microglia cells from Tabula Muris (for the procedure for selecting cells, see Supplemental Methods) for a total of 4.4 billion paired-end 100-bp reads. The assembly evaluation results are summarized in Figure 6, A through D. RB(pool) is the reference-free method that has the largest I50 (1001, SD = 326) and I95 (306, SD = 105). RB(ref,pool) is the reference-using method that has the largest I50 (1001, SD = 326) and I95 (307, SD = 105). Among reference-free methods, Trans-ABySS and rnaSPAdes have the lowest mean MR50 (3.8%, SD = 1.2%) and MR95 (11.8%, SD = 4.1%), respectively. Trinity has the highest mean MR50 (5.7%, SD = 1.8%) and MR95 (17.7%, SD = 5.6%). For methods that use the reference, StringTie and Scallop have no misassemblies, as expected, whereas RB(ref) has the highest MR50 (6.1%, SD = 2.1%) and MR95 (17.7%, SD = 5.3%). The difference in MR95 between RB(ref) and Trinity is not statistically significant. RB, RB(pool), and RB(ref, pool) have similar mean MR50 (4.5%∼4.8%, SD = 1.7%∼1.8%) and MR95 (13.9%∼14.0%, SD = 4.3%∼4.8%).
Figure 6.
Assembly quality evaluation on an experimental scRNA-seq data set consisting of 3840 mouse microglia cells. (A) Number of isoforms reconstructed to at least 50% of annotated length, denoted as I50. (B) Number of isoforms reconstructed to at least 95% of annotated length, denoted as I95. (C) Misassembly rate calculated based on I50, denoted as MR50. (D) Misassembly rate calculated based on I95, denoted as MR95. Distributions of each metric were measured over all 3840 cells.
We also assembled another public real data set composed of 260 mouse embryonic stem cells (Kolodziejczyk et al. 2015) with a total of 3.94 billion paired-end 100-bp reads. Although this data set has a lot fewer cells than Tabula Muris, each cell was much more deeply sequenced, averaging over 9 million reads per cell. The assembly evaluation results are summarized in Supplemental Figure S5. Among reference-free methods, RB(pool) has the largest mean I50 (5328, SD = 1118) and I95 (1653, SD = 417), whereas rnaSPAdes has the second-largest I50 (3265, SD = 1207) and I95 (938, SD = 389). Among methods that use the reference, RB(ref,pool) has the largest mean I50 (5457, SD = 1134) and I95 (1866, SD = 457), whereas StringTie has the second-largest I50 (4823, SD = 950) and I95 (1678, SD = 396). Trinity has the highest mean MR50 (17.5%, SD = 3.8%) and MR95 (58.5%, SD = 12.2%), whereas all other assemblers have lower misassembly rates. In particular, StringTie and Scallop have no misassemblies, like in the Tabula Muris data set.
Computational performance
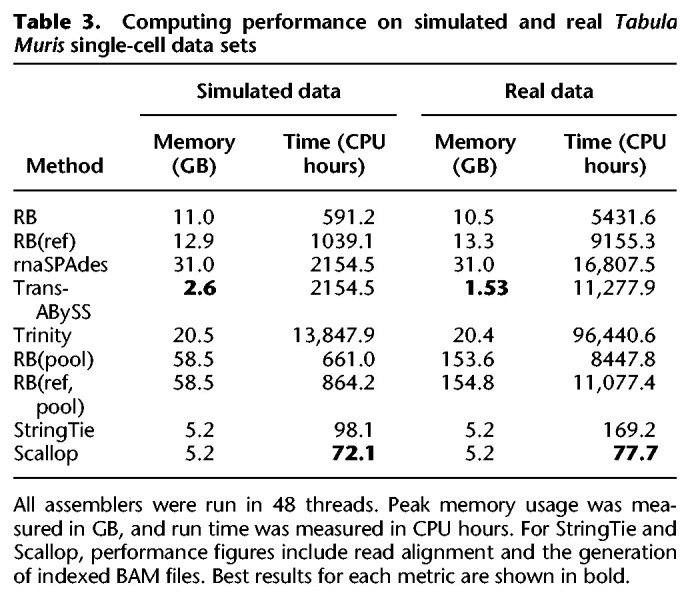
The computational performance of all assembly strategies for the simulated and real Tabula Muris data sets is summarized in Table 3. All methods were configured to use up to 48 CPUs. In assembling the simulated data set, Trans-ABySS has the lowest peak memory usage (2.6 GB), whereas RB(ref,pool) has the highest (58.5 GB). In assembling the experimental Tabula Muris data set, Trans-ABySS has the lowest peak memory usage (1.5 GB), whereas RB(ref,pool) has the highest (154.8 GB). Scallop has the fastest total run time in assembling the simulated data set (1.5 wall-clock hours) and the real data set (1.6 wall-clock hours). RB was the fastest reference-free method (12.3 wall-clock hours) in assembling the simulated data. Trinity has the slowest total run time in both simulated (288.5 wall-clock hours) and real data sets (2009.2 wall-clock hours). Overall, reference-based methods have faster run times and lower peak memory usage than reference-free methods.
Table 3.
Computing performance on simulated and real Tabula Muris single-cell data sets
Single-cell isoform analysis of microglial genes
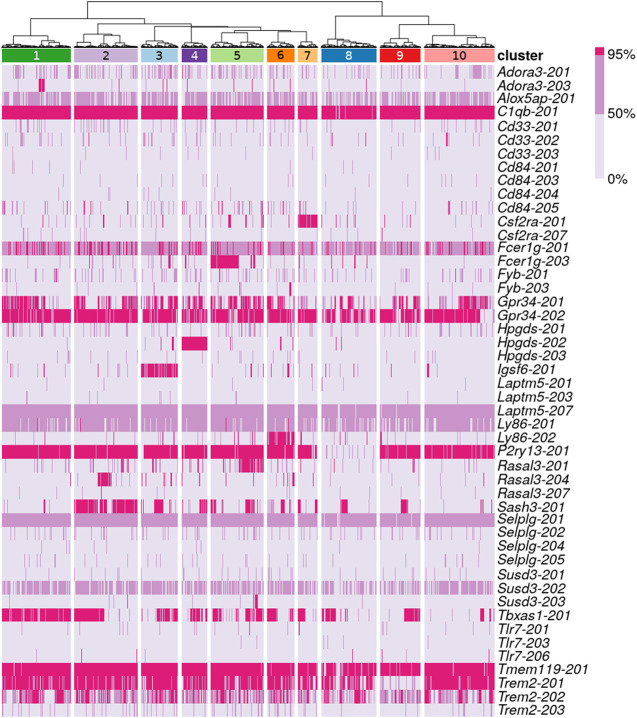
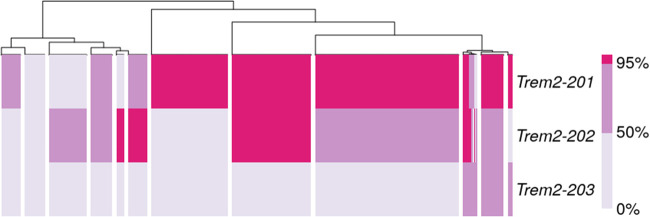
Based on the reconstruction levels of known isoforms reported by rnaQUAST, we clustered RB(ref,pool) assemblies of the 3840-cell Tabula Muris real data set using a set of 31 microglial genes (Bonham et al. 2019). The procedure for clustering is described in Supplemental Methods. We chose to work with RB(ref, pool) assemblies because they had the best sensitivity figures in both simulated and real data sets. The cell clusters are presented in Figure 7. Isoforms of C1qb and Tmem119 are assembled to full-length in nearly all cells. Specific isoforms of Igsf6, Hpgds, and Csf2ra are fully reconstructed, which are unique to cell clusters 3, 4, and 7, respectively. The isoform of P2ry13 was fully reconstructed in all cell clusters except cell cluster 8, where partial reconstruction was minimally observed. Similarly, the Trem2-201 isoform was also fully reconstructed in all cell clusters except cluster 9. However, its alternative isoforms did not share the same pattern. Trem2-202 had a mix of partial and full-length reconstruction across all cell clusters. Trem2-203, a retained-intron alternative isoform, had only partial reconstruction in a very small number of cells. Therefore, we reclustered the cells using only isoforms of Trem2 (Fig. 8), and we observed signs of isoform switch. Although Trem2-201 appeared to be the dominant isoform in the majority of the cells, other smaller groups of cells showed bias toward Trem2-202. These two isoforms encode different protein sequences, but they share the same Pfam domain (PF07686) (Supplemental Fig. S6). Because variants of Trem2 are known to be associated with neurodegenerative diseases such as Alzheimer's disease in humans (Jay et al. 2017), follow-up studies of the alternative isoforms may improve our understanding of the gene's function.
Figure 7.
Clustering of microglial cells based on isoform reconstruction. The first row indicates 10 cell clusters, and colors in subsequent rows encode three levels of isoform reconstruction: none (below 50%), partial (at least 50% but below 95%), and full-length (at least 95%). The labels refer to isoforms of microglial genes that have either partial or full-length reconstruction in at least 38 cells.
Figure 8.
Clustering of microglial cells based on isoform reconstruction of Trem2. Colors encode three levels of isoform reconstruction: none (below 50%), partial (at least 50% but below 95%), and full-length (at least 95%). The labels refer to Trem2 isoforms with either partial or full-length reconstruction in at least 38 cells.
Discussion
New sequencing technologies that interrogate single-cell transcriptomes provide information on gene regulation at unprecedented details. Whereas transcript-end capture protocols are primarily used to measure expression levels, full-length sequencing protocols have richer information content for isoform structures in single cells. However, to realize the full potential of the full-length sequencing protocols, specialized bioinformatics tools are needed.
Here, we present RNA-Bloom, an RNA-seq assembly algorithm that addresses this need. Overall, in our benchmarks on scRNA-seq data, RNA-Bloom has the best isoform reconstruction with misassembly rates comparable to that of other assemblers. Without using the pool assembly mode, RNA-Bloom's reference-guided mode has better reconstruction than its reference-free mode in simulated and real data, but both assembly modes behave similarly in assembling novel transcripts a priori. This shows that reference-guided mode is preferred whenever a high-quality transcriptome reference is available.
All assembly methods evaluated have the best isoform reconstruction in the highest expression stratum of the simulated data, likely because highly expressed transcripts are represented by more reads, making them easier to assemble. However, the proportional difference in mean reconstruction between RNA-Bloom and bulk RNA-seq assemblers increased in the lowest three expression strata. This is very remarkable because reference-based assemblers reconstructed more isoforms than RNA-Bloom in our benchmarking with bulk RNA-seq data. This illustrates that RNA-Bloom's pooled assembly strategy is working effectively despite potential coverage gaps and amplified noise, which tend to have larger detrimental effects on the reconstruction of low-expressed transcripts owing to insufficient good quality reads. This advantage comes at the cost of a relatively higher memory usage and a higher false-discovery rate than other assembly methods.
Despite pooling reads from multiple cells, RNA-Bloom can robustly reconstruct isoforms specific to individual cells and alternative isoforms within individual cells, as shown in our isoform analysis of the microglial genes using the Tabula Muris data set. As a scalable assembler shown to work for more than 4 billion paired-end reads, RNA-Bloom unlocks the possibility of cataloging cell types at the isoform level in large data sets.
Methods
The workflow of RNA-Bloom consists of three stages: (1) shared DBG construction, (2) fragment sequence reconstruction, and (3) transcript sequence reconstruction (Fig. 9). In stage 1, an implicit DBG is constructed using the k-mers from all input reads of all cells. In stage 2, fragment sequences of each cell are reconstructed by connecting the cell's read pairs using the DBG from stage 1. To maintain the cell precision of the transcripts to be reconstructed in stage 3, a new DBG for each cell is created solely using k-mers from the cell's reconstructed fragments following stage 2. In stage 3, using the cell-specific DBGs, fragments are extended outward in both directions to reconstruct transcript sequences.
Figure 9.
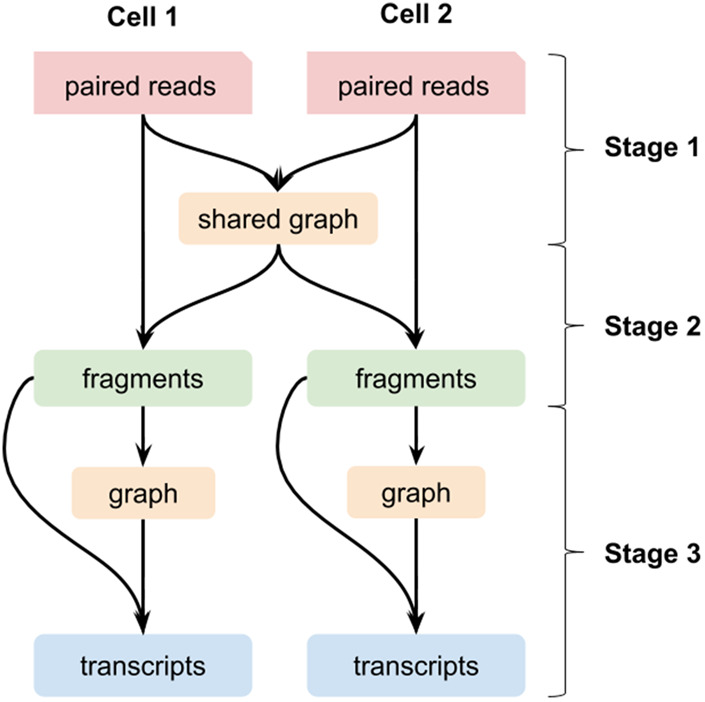
Pooled assembly of scRNA-seq data in RNA-Bloom illustrated for data from two cells.
Bloom filter data structure
The hash functions for Bloom filters in RNA-Bloom were implemented based on the nucleotide hashing algorithm, ntHash (Mohamadi et al. 2016). The number of unique k-mers and the user-defined false positive rate (FPR) for Bloom filters are used to determine the size for each Bloom filter. RNA-Bloom has the option to run ntCard (Mohamadi et al. 2017) to quickly estimate the number of unique k-mers, provided ntCard is already installed on the user's computing environment. If the number of unique k-mers is not specified or ntCard is not available, then the total size of Bloom filters is configured in proportion to the total file size of all input read files. In our experience, a Bloom filter FPR of 0.5% ∼ 1.0% provides a relatively good trade-off between memory usage and assembly quality.
Stage 1: shared de Bruijn graph construction
The shared DBG is represented by three separate Bloom filters: (1) DBG Bloom filter, (2) k-mer counting Bloom filter, and (3) read k-mer pairs Bloom filter. The DBG Bloom filter is a bit array, and it provides an implicit representation of the DBG for the k-mers in all cells. The k-mer counting Bloom filter provides a compact nonexact storage of k-mer counts, and it is implemented based on the 8-bit minifloat byte-array data structure introduced previously (Birol et al. 2015). To minimize the effect of false positives in the Bloom filters, a k-mer is deemed present in the data set only if it is found in the DBG Bloom filter and it has a nonzero count in the k-mer counting Bloom filter. The read k-mer pairs Bloom filter stores pairs of distant k-mers at a fixed distance along each read (Supplemental Fig. S7). These k-mer pairs are essentially sparse representations of individual reads, and they are useful in guiding graph traversal in later stages. The shared DBG is used throughout fragment reconstruction of individual cells.
Stage 2: fragment sequence reconstruction
After the shared DBG has been constructed, the process of fragment sequence reconstruction is performed separately for individual cells. For each read pair in each cell, mismatch and indel errors are identified and corrected based on k-mer counts in a procedure similar to the RNA-seq error correction method, Rcorrector (Song and Florea 2015; Supplemental Fig. S8). After error correction, the read pair is connected by extending each constituent read toward its mate to reconstruct the underlying fragment sequence. Each read is extended by searching for neighbors in the shared DBG. When the current extension reaches a branching point in the graph, the unambiguous extension of each branch is assigned a score based on its median k-mer count and the number of read k-mer pairs spanning across the branching point (Supplemental Fig. S9; Supplemental Methods). Because longer extensions tend to have more supporting k-mer pairs, the score is normalized by the length of the extension. The branch with the highest score is added to the current extension from the read. This extension routine is initially depth-bounded by a permissive default threshold (default = 1000 bp) for each cell. After the first N read pairs (default = 1000) of the cell have been evaluated, the depth threshold is readjusted to 1.5-fold of the interquartile range of reconstructed fragment lengths. This threshold limits the depth of graph traversal to ensure fast overall assembly run time and prevents spurious connections of reads. Extension is first attempted from the left read toward the right, and a second attempt is made from the right read toward the left when the first attempt fails. Extension from each direction terminates if the paired reads are connected or the extension has reached either a dead end or the depth threshold.
Each reconstructed fragment is checked for consistency with input reads by scanning for overlapping read k-mer pairs. If the reconstructed fragment is consistent with read k-mer pairs, more distant pairs of k-mers at a fixed distance within the reconstructed fragment are stored in the fragment k-mer pairs Bloom filter (Supplemental Fig. S7). The distance between the paired k-mers are set to the first quartile of reconstructed fragment lengths from the first N read pairs evaluated. This results in ∼75% of the cell's reconstructed fragments being represented by at least one fragment k-mer pair. As observed previously (Birol et al. 2015), although more distant paired k-mers tend to be more unique, and thus are better at the resolution of ambiguous branches in the DBG, increasing the distance between paired k-mers would lower the proportion of fragments represented by k-mer pairs. Therefore, it is important to balance the proportion of fragments represented by k-mer pairs and the distance between paired k-mers.
To avoid redundant storage, each fragment is screened against an assembled k-mer Bloom filter, which contains k-mers of previously reconstructed fragments, and the fragment k-mer pairs Bloom filter. If the fragment contains at least one new k-mer or k-mer pair, new k-mers and k-mer pairs are inserted into the corresponding Bloom filters. The fragment is then assigned to one of the strata according to its minimum k-mer count and its length (Supplemental Fig. S10). Fragments not consistent with reads are discarded, and their original paired-end reads are assigned to the strata for unconnected reads. This stratification of reconstructed transcript fragments provides a crude separation of fragment sequences of different expression levels. After all paired-end reads have been evaluated for a cell, both fragment k-mer pairs Bloom filter and the assembled k-mers Bloom filter are emptied in preparation for transcript fragment reconstruction of the next cell.
Stage 3: transcript sequence reconstruction
After fragment sequence reconstruction has been completed for all cells, transcript sequences can be reconstructed by extending each fragment sequence outward in both directions. To reconstruct transcript sequences for each cell, the DBG Bloom filter is emptied and repopulated with only k-mers along the cell's reconstructed fragments. Emptying the DBG Bloom filter ensures that fragments are extended with k-mers specific to the corresponding cell.
Fragment sequences are retrieved from strata with decreasing k-mer counts because low-expression strata tend to be more enriched in sequencing errors and artifacts. Strata for long fragments are retrieved first, followed by the strata for short fragments, and finally strata for unconnected reads (Supplemental Fig. S10). Each fragment sequence is extended outward in both directions. The extension routine for each direction is the same as its counterpart in fragment sequence reconstruction, except that the scoring scheme here includes fragment k-mer pairs in addition to read k-mer pairs (Supplemental Fig. S9; Supplemental Methods).
The reconstructed transcript sequences are evaluated for consistency with input reads and reconstructed fragments by scanning along the reconstructed transcript sequence for overlapping read k-mer pairs and fragment k-mer pairs. Segments of the transcript sequence without overlapping k-mer pairs are trimmed from the transcript sequence. This procedure ensures a low number of misassembled transcripts.
To reduce redundancy in the assembly, assembled transcripts for each cell are overlapped with minimap2 (Li 2018). Containment and dovetail overlaps (where one sequence is end-to-end contained in the other, and the end of one sequence partially overlaps with the beginning of the other, respectively) are identified from the overlaps having >99% sequence identity. Contained sequences are removed from the assembly and sequences with dovetail overlaps are merged into a single sequence.
Reference-guided assembly
When the reference-guided option (“-ref”) is used, k-mer pairs from the user-supplied transcriptome reference are used in conjunction with read k-mer pairs and fragment k-mer pairs. In stage 1, k-mer pairs, at a distance the same as the read k-mer pairs, from the transcriptome reference are stored in the Bloom filter for read k-mer pairs. In stage 3, k-mer pairs, at a distance the same as the fragment k-mer pairs, from the transcriptome reference are stored in the Bloom filter for fragment k-mer pairs. The processes for fragment reconstruction and transcript reconstruction do not distinguish the origin of the k-mer pairs.
Assembly evaluations
All read data were trimmed for adaptors with fastp (Chen et al. 2018), and only paired-end reads longer than 25 bp are retained for assembly. Benchmarking was performed with RNA-Bloom, Trans-ABySS, Trinity, rnaSPAdes, StringTie, and Scallop. The software versions and commands for each assembler are described in Supplemental Methods. All assemblers were run using 48 threads on a machine with 48 HT-cores at 2.2 GHz and 384 GB of RAM. Because the bulk RNA-seq assemblers evaluated do not pool reads from multiple cells in their algorithms, the total run time was the sum of those of the assemblies of individual cells.
For reference-based methods, alignment of reads against the reference genome was performed with HISAT2 (Kim et al. 2019), and BAM files were generated and indexed with SAMtools (Li et al. 2009). FASTA files were derived from each assembly's GTF using gffread (Pertea and Pertea 2020).
Isoform reconstruction and misassemblies in each assembly were determined with rnaQUAST (Supplemental Methods), using the mouse reference genome GRCm38 and Ensembl version 99 annotations for measuring assembly sensitivity and correctness.
We calculated the quartiles of the expression levels measured on the transcripts per million (TPM) scale for all simulated isoforms in all 384 cells. We used these TPM quartiles to define four expression strata: (1) TPM < Q1, (2) Q1 ≤ TPM < Q2, (3) Q2 ≤ TPM < Q3, and (4) Q3 ≤ TPM. Every simulated isoform in each cell was assigned to one of the four strata.
Software availability
RNA-Bloom is implemented in the Java programming language and distributed under GPLv3 license. It is available for download as a prebuilt executable JAR file at GitHub (https://github.com/bcgsc/RNA-Bloom) and as Supplemental Code S1.
Data access
The simulated bulk and single-cell RNA-seq data generated in this study have been deposited on our website (http://www.bcgsc.ca/downloads/supplementary/rnabloom/genome_2019_260174/) within the archive files, Supplemental_Data_S1.tar.gz and Supplemental_Data_S2.tar.gz, respectively.
Competing interest statement
The authors declare no competing interests.
Supplementary Material
Acknowledgments
This work was supported by Genome Canada and Genome British Columbia (243FOR and 281ANV, respectively); the National Institutes of Health (2R01HG007182-04A1); and the Natural Sciences and Engineering Research Council of Canada (NSERC). The content of this work is solely the responsibility of the authors and does not necessarily represent the official views of the National Institutes of Health or other funding organizations.
Author contributions: K.M.N. and I.B. designed the method and algorithms. K.M.N., J.C., H.M., and I.B. designed the Bloom filter data structures. K.M.N. implemented the RNA-Bloom software. K.M.N., R.C., and C.Y. conducted the benchmarking experiments. K.M.N., R.C., C.Y., R.L.W., and I.B. analyzed the results. All authors wrote the manuscript.
Footnotes
[Supplemental material is available for this article.]
Article published online before print. Article, supplemental material, and publication date are at http://www.genome.org/cgi/doi/10.1101/gr.260174.119.
Freely available online through the Genome Research Open Access option.
References
- Arzalluz-Luque Á, Conesa A. 2018. Single-cell RNAseq for the study of isoforms—how is that possible? Genome Biol 19: 110 10.1186/s13059-018-1496-z [DOI] [PMC free article] [PubMed] [Google Scholar]
- Birol I, Chu J, Mohamadi H, Jackman SD, Raghavan K, Vandervalk BP, Raymond A, Warren RL. 2015. Spaced seed data structures for de novo assembly. Int J Genomics Proteomics 2015: 196591 10.1155/2015/196591 [DOI] [PMC free article] [PubMed] [Google Scholar]
- Bloom BH. 1970. Space/time trade-offs in hash coding with allowable errors. Commun ACM 13: 422–426. 10.1145/362686.362692 [DOI] [Google Scholar]
- Bonham LW, Sirkis DW, Yokoyama JS. 2019. The transcriptional landscape of microglial genes in aging and neurodegenerative disease. Front Immunol 10: 1170 10.3389/fimmu.2019.01170 [DOI] [PMC free article] [PubMed] [Google Scholar]
- Bray NL, Pimentel H, Melsted P, Pachter L. 2016. Near-optimal probabilistic RNA-seq quantification. Nat Biotechnol 34: 525–527. 10.1038/nbt.3519 [DOI] [PubMed] [Google Scholar]
- Bushmanova E, Antipov D, Lapidus A, Suvorov V, Prjibelski AD. 2016. rnaQUAST: a quality assessment tool for de novo transcriptome assemblies. Bioinformatics 32: 2210–2212. 10.1093/bioinformatics/btw218 [DOI] [PubMed] [Google Scholar]
- Bushmanova E, Antipov D, Lapidus A, Prjibelski AD. 2019. rnaSPAdes: a de novo transcriptome assembler and its application to RNA-Seq data. Gigascience 8: giz100 10.1093/gigascience/giz100 [DOI] [PMC free article] [PubMed] [Google Scholar]
- Canzar S, Neu KE, Tang Q, Wilson PC, Khan AA. 2017. BASIC: BCR assembly from single cells. Bioinformatics 33: 425–427. 10.1093/bioinformatics/btw631 [DOI] [PMC free article] [PubMed] [Google Scholar]
- Cao J, Packer JS, Ramani V, Cusanovich DA, Huynh C, Daza R, Qiu X, Lee C, Furlan SN, Steemers FJ, et al. 2017. Comprehensive single-cell transcriptional profiling of a multicellular organism. Science 357: 661–667. 10.1126/science.aam8940 [DOI] [PMC free article] [PubMed] [Google Scholar]
- Chen S, Zhou Y, Chen Y, Gu J. 2018. fastp: an ultra-fast all-in-one FASTQ preprocessor. Bioinformatics 34: i884–i890. 10.1093/bioinformatics/bty560 [DOI] [PMC free article] [PubMed] [Google Scholar]
- Chikhi R, Rizk G. 2013. Space-efficient and exact de Bruijn graph representation based on a Bloom filter. Algorithms Mol Biol 8: 22 10.1186/1748-7188-8-22 [DOI] [PMC free article] [PubMed] [Google Scholar]
- Cole C, Byrne A, Beaudin AE, Forsberg EC, Vollmers C. 2018. Tn5Prime, a Tn5 based 5′ capture method for single cell RNA-seq. Nucleic Acids Res 46: e62 10.1093/nar/gky182 [DOI] [PMC free article] [PubMed] [Google Scholar]
- Conesa A, Madrigal P, Tarazona S, Gomez-Cabrero D, Cervera A, McPherson A, Szcześniak MW, Gaffney DJ, Elo LL, Zhang X, et al. 2016. A survey of best practices for RNA-seq data analysis. Genome Biol 17: 13 10.1186/s13059-016-0881-8 [DOI] [PMC free article] [PubMed] [Google Scholar]
- Cristinelli S, Ciuffi A. 2018. The use of single-cell RNA-Seq to understand virus–host interactions. Curr Opin Virol 29: 39–50. 10.1016/j.coviro.2018.03.001 [DOI] [PubMed] [Google Scholar]
- Grabherr MG, Haas BJ, Yassour M, Levin JZ, Thompson DA, Amit I, Adiconis X, Fan L, Raychowdhury R, Zeng Q, et al. 2011. Full-length transcriptome assembly from RNA-Seq data without a reference genome. Nat Biotechnol 29: 644–652. 10.1038/nbt.1883 [DOI] [PMC free article] [PubMed] [Google Scholar]
- Hölzer M, Marz M. 2019. De novo transcriptome assembly: a comprehensive cross-species comparison of short-read RNA-Seq assemblers. Gigascience 8: giz039 10.1093/gigascience/giz039 [DOI] [PMC free article] [PubMed] [Google Scholar]
- Howick VM, Russell AJC, Andrews T, Heaton H, Reid AJ, Natarajan K, Butungi H, Metcalf T, Verzier LH, Rayner JC, et al. 2019. The Malaria Cell Atlas: single parasite transcriptomes across the complete Plasmodium life cycle. Science 365: eaaw2619 10.1126/science.aaw2619 [DOI] [PMC free article] [PubMed] [Google Scholar]
- Jackman SD, Vandervalk BP, Mohamadi H, Chu J, Yeo S, Hammond SA, Jahesh G, Khan H, Coombe L, Warren RL, et al. 2017. ABySS 2.0: resource-efficient assembly of large genomes using a Bloom filter. Genome Res 27: 768–777. 10.1101/gr.214346.116 [DOI] [PMC free article] [PubMed] [Google Scholar]
- Jay TR, von Saucken VE, Landreth GE. 2017. TREM2 in neurodegenerative diseases. Mol Neurodegener 12: 56 10.1186/s13024-017-0197-5 [DOI] [PMC free article] [PubMed] [Google Scholar]
- Kim D, Paggi JM, Park C, Bennett C, Salzberg SL. 2019. Graph-based genome alignment and genotyping with HISAT2 and HISAT-genotype. Nat Biotechnol 37: 907–915. 10.1038/s41587-019-0201-4 [DOI] [PMC free article] [PubMed] [Google Scholar]
- Kolodziejczyk AA, Kim JK, Tsang JCH, Ilicic T, Henriksson J, Natarajan KN, Tuck AC, Gao X, Bühler M, Liu P, et al. 2015. Single cell RNA-sequencing of pluripotent states unlocks modular transcriptional variation. Cell Stem Cell 17: 471–485. 10.1016/j.stem.2015.09.011 [DOI] [PMC free article] [PubMed] [Google Scholar]
- Li H. 2018. Minimap2: pairwise alignment for nucleotide sequences. Bioinformatics 34: 3094–3100. 10.1093/bioinformatics/bty191 [DOI] [PMC free article] [PubMed] [Google Scholar]
- Li B, Dewey CN. 2011. RSEM: accurate transcript quantification from RNA-Seq data with or without a reference genome. BMC Bioinformatics 12: 323 10.1186/1471-2105-12-323 [DOI] [PMC free article] [PubMed] [Google Scholar]
- Li H, Handsaker B, Wysoker A, Fennell T, Ruan J, Homer N, Marth G, Abecasis G, Durbin R, 1000 Genome Project Data Processing Subgroup. 2009. The Sequence Alignment/Map format and SAMtools. Bioinformatics 25: 2078–2079. 10.1093/bioinformatics/btp352 [DOI] [PMC free article] [PubMed] [Google Scholar]
- Lindeman I, Emerton G, Mamanova L, Snir O, Polanski K, Qiao SW, Sollid LM, Teichmann SA, Stubbington MJT. 2018. BraCeR: B-cell-receptor reconstruction and clonality inference from single-cell RNA-seq. Nat Methods 15: 563–565. 10.1038/s41592-018-0082-3 [DOI] [PubMed] [Google Scholar]
- Macosko EZ, Basu A, Satija R, Nemesh J, Shekhar K, Goldman M, Tirosh I, Bialas AR, Kamitaki N, Martersteck EM, et al. 2015. Highly parallel genome-wide expression profiling of individual cells using nanoliter droplets. Cell 161: 1202–1214. 10.1016/j.cell.2015.05.002 [DOI] [PMC free article] [PubMed] [Google Scholar]
- Mohamadi H, Chu J, Vandervalk BP, Birol I. 2016. ntHash: recursive nucleotide hashing. Bioinformatics 32: 3492–3494. 10.1093/bioinformatics/btw245 [DOI] [PMC free article] [PubMed] [Google Scholar]
- Mohamadi H, Khan H, Birol I. 2017. ntCard: a streaming algorithm for cardinality estimation in genomics data. Bioinformatics 33: 1324–1330. 10.1093/bioinformatics/btw832k [DOI] [PMC free article] [PubMed] [Google Scholar]
- Natarajan KN, Miao Z, Jiang M, Huang X, Zhou H, Xie J, Wang C, Qin S, Zhao Z, Wu L, et al. 2019. Comparative analysis of sequencing technologies for single-cell transcriptomics. Genome Biol 20: 70 10.1186/s13059-019-1676-5 [DOI] [PMC free article] [PubMed] [Google Scholar]
- Navin NE. 2015. The first five years of single-cell cancer genomics and beyond. Genome Res 25: 1499–1507. 10.1101/gr.191098.115 [DOI] [PMC free article] [PubMed] [Google Scholar]
- Pertea G, Pertea M. 2020. GFF Utilities: GffRead and GffCompare. F1000Res 9: 304 10.12688/f1000research.23297.1 [DOI] [PMC free article] [PubMed] [Google Scholar]
- Pertea M, Pertea GM, Antonescu CM, Chang TC, Mendell JT, Salzberg SL. 2015. StringTie enables improved reconstruction of a transcriptome from RNA-seq reads. Nat Biotechnol 33: 290–295. 10.1038/nbt.3122 [DOI] [PMC free article] [PubMed] [Google Scholar]
- Picelli S, Björklund ÅK, Faridani OR, Sagasser S, Winberg G, Sandberg R. 2013. Smart-seq2 for sensitive full-length transcriptome profiling in single cells. Nat Methods 10: 1096–1098. 10.1038/nmeth.2639 [DOI] [PubMed] [Google Scholar]
- Rizzetto S, Koppstein DNP, Samir J, Singh M, Reed JH, Cai CH, Lloyd AR, Eltahla AA, Goodnow CC, Luciani F. 2018. B-cell receptor reconstruction from single-cell RNA-seq with VDJPuzzle. Bioinformatics 34: 2846–2847. 10.1093/bioinformatics/bty203 [DOI] [PubMed] [Google Scholar]
- Robertson G, Schein J, Chiu R, Corbett R, Field M, Jackman SD, Mungall K, Lee S, Okada HM, Qian JQ, et al. 2010. De novo assembly and analysis of RNA-seq data. Nat Methods 7: 909–912. 10.1038/nmeth.1517 [DOI] [PubMed] [Google Scholar]
- Shao M, Kingsford C. 2017. Accurate assembly of transcripts through phase-preserving graph decomposition. Nat Biotechnol 35: 1167–1169. 10.1038/nbt.4020 [DOI] [PMC free article] [PubMed] [Google Scholar]
- Song L, Florea L. 2015. Rcorrector: efficient and accurate error correction for Illumina RNA-seq reads. Gigascience 4: 48 10.1186/s13742-015-0089-y [DOI] [PMC free article] [PubMed] [Google Scholar]
- Song Y, Botvinnik OB, Lovci MT, Kakaradov B, Liu P, Xu JL, Yeo GW. 2017. Single-cell alternative splicing analysis with expedition reveals splicing dynamics during neuron differentiation. Mol Cell 67: 148–161.e5. 10.1016/j.molcel.2017.06.003 [DOI] [PMC free article] [PubMed] [Google Scholar]
- The Tabula Muris Consortium. 2018. Single-cell transcriptomics of 20 mouse organs creates a Tabula Muris. Nature 562: 367–372. 10.1038/s41586-018-0590-4 [DOI] [PMC free article] [PubMed] [Google Scholar]
- Verboom K, Everaert C, Bolduc N, Livak KJ, Yigit N, Rombaut D, Anckaert J, Lee S, Venø MT, Kjems J, et al. 2019. SMARTer single cell total RNA sequencing. Nucleic Acids Res 47: e93 10.1093/nar/gkz535 [DOI] [PMC free article] [PubMed] [Google Scholar]
- Zheng GXY, Terry JM, Belgrader P, Ryvkin P, Bent ZW, Wilson R, Ziraldo SB, Wheeler TD, McDermott GP, Zhu J, et al. 2017. Massively parallel digital transcriptional profiling of single cells. Nat Commun 8: 14049 10.1038/ncomms14049 [DOI] [PMC free article] [PubMed] [Google Scholar]
Associated Data
This section collects any data citations, data availability statements, or supplementary materials included in this article.


