Abstract
To accomplish the remarkable task of lifelong infection, Epstein-Barr virus (EBV) switches between four viral genome latency and lytic programs to navigate the B-cell compartment and evade immune responses. The transforming program, comprised of highly immunogenic EBV nuclear antigen (EBNA) and Latent Membrane Proteins (LMP), is expressed in newly infected B-lymphocytes and in post-transplant lymphomas. Upon memory cell differentiation and in most EBV-associated Burkitt lymphomas (BL), all but one viral antigen are repressed for immunoevasion. To gain insights into epigenetic mechanisms that restrict immunogenic oncoprotein expression, a genome-scale CRISPR/Cas9 screen was performed in EBV+ BL cells. Here we show that the ubiquitin ligase UHRF1 and its DNA methyltransferase partner DNMT1 were critical for restriction of EBNA and LMP expression. All UHRF1 reader and writer domains were necessary for silencing, and DNMT3B was identified as an upstream viral genome CpG methylation initiator. Polycomb repressive complex I exerted a further layer of control over LMP expression, suggesting a second mechanism for latency program switching. UHRF1, DNMT1 and DNMT3B are upregulated in germinal center B-cells, the BL cell of origin, providing a molecular link between B-cell state and EBV latency program. These results suggest rational therapeutic targets to manipulate EBV oncoprotein expression.
Epstein–Barr virus (EBV) infects over 95% of adults worldwide and is associated with 200,000 human cancers annually1,2. Despite encoding ~80 polypeptides, EBV navigates the B-cell compartment to colonize memory B-cells, the site of long-term persistence. To do so, EBV uses multiple latency programs at distinct stages of B-cell differentiation, in which combinations of viral nuclear and membrane oncoproteins and non-coding RNAs are expressed, but lytic antigens remain silenced1–3. Knowledge remains incomplete about how epigenetic mechanisms control EBV latency program selection.
Upon initial B-cell infection, the viral W promoter (Wp) drives the pre-latency program, characterized by expression of Epstein-Barr nuclear antigens EBNA2 and EBNA-LP. These viral transcription factors induce expression of c-MYC and other B-cell oncogenic genes4–8. Shortly thereafter, the EBV genome switches to the Latency IIb program, where the viral C promoter (Cp) drives expression of six EBNA transcription factors: EBNA1, EBNA2, EBNA-LP and EBNA3A-C1. Latency IIb drives B-cell hyperproliferation including in certain HIV-associated B-cell lymphomas4.
EBNA2 activates viral latent membrane protein (LMP) promoters to drive latency III, where six EBNAs and two LMPs are expressed. LMP1 and LMP2A mimic activated CD40 and B-cell receptors, respectively1. Latency III upregulates antigen presentation, T-cell costimulatory ligands and adhesion molecules and is observed in EBV+ lymphomas of highly immunosuppressed hosts1,4,9. Immune pressure from cytotoxic T-cell responses directed at EBNA3 antigens and likely also germinal center environmental cues cause the viral genome to restrict expression of all but the EBNA1, LMP1 and 2A oncoproteins. This latency II program is observed in Hodgkin lymphoma, which arises from germinal center B-cells.
For long-term memory B-cell persistence, EBV uses the latency I program, where all EBV antigens are silenced except weakly immunogenic EBNA1, which is expressed from the viral Q promoter (Qp)10. Burkitt lymphoma (BL) use latency I to subvert anti-EBV responses, and endemic BL accounts for nearly 50% of all pediatric cancers in sub-Saharan Africa1,11.
Resting memory B-cells downmodulate all EBV-encoded proteins, suggesting that host factors are critical for latency maintenance. While DNA methylation has roles4,5,12–14,13,15,16, mechanisms of silencing remain largely unknown17. We therefore used a human genome-scale loss-of-function CRISPR screen and mechanistic analyses to characterize epigenetic factors operative in BL latency I maintenance.
CRISPR-Cas9 Screen Reveals Epigenetic Factors Necessary for EBV Latency I
We performed a CRISPR/Cas9 screen for host factors that silence latency III in MUTU I cells, established from an African BL tumor18. MUTU I were used because it is known that they can switch to latency III in culture. Indeed, the MUTU III subclone was identified from the original tumor18, consistent with escape from a host epigenetic control mechanism. As previously reported18–20, CD10 was highly expressed on MUTU I but downregulated on MUTU III (Extended Data Fig. 1a and b). By contrast, the LMP1/NF-kB pathway-target ICAM-1 is strongly upregulated on MUTU III18,21,22. Therefore, CD10 and ICAM-1 were selected for our screen as surrogate markers of latency I/III, respectively. Cas9+ MUTU I cells were transduced with the Brunello single-guide RNA (sgRNA) library, comprised of 74,700 lentiviruses, four of which target each human protein coding gene23. Each lentivirus delivers a unique human gene-targeting sgRNA. Transduced cells were grown for 8 days to provide time for EBV latency switch.
FACSort was used to identify screen hits (Fig. 1a; Extended Data Fig. 1c). Putative latency III ICAM-1high/CD10low cells were sorted, as were ICAM-1high/CD10high cells, in case epigenetic mechanisms necessary for latency III repression might also be required for CD10 silencing. As a positive control, the ICAM-1low/CD10low cells were sorted to determine whether sgRNAs targeting CD10 itself would score (Fig. 1a; Extended Data Fig. 1c). Genomic DNA was harvested from input versus sorted populations, and PCR-amplified sgRNA abundances were quantified by deep sequencing. The STARS algorithm was used to identify statistically significant hits where sgRNAs were enriched in the sorted versus input population23. As expected, CD10-encoding MME was the top hit in the screen for loss of CD10 expression (ICAM-1low/CD10low subpopulation, Fig. 1b).
Fig. 1. CRISPR/Cas9 Screen for host factors that maintain latency I in BL.
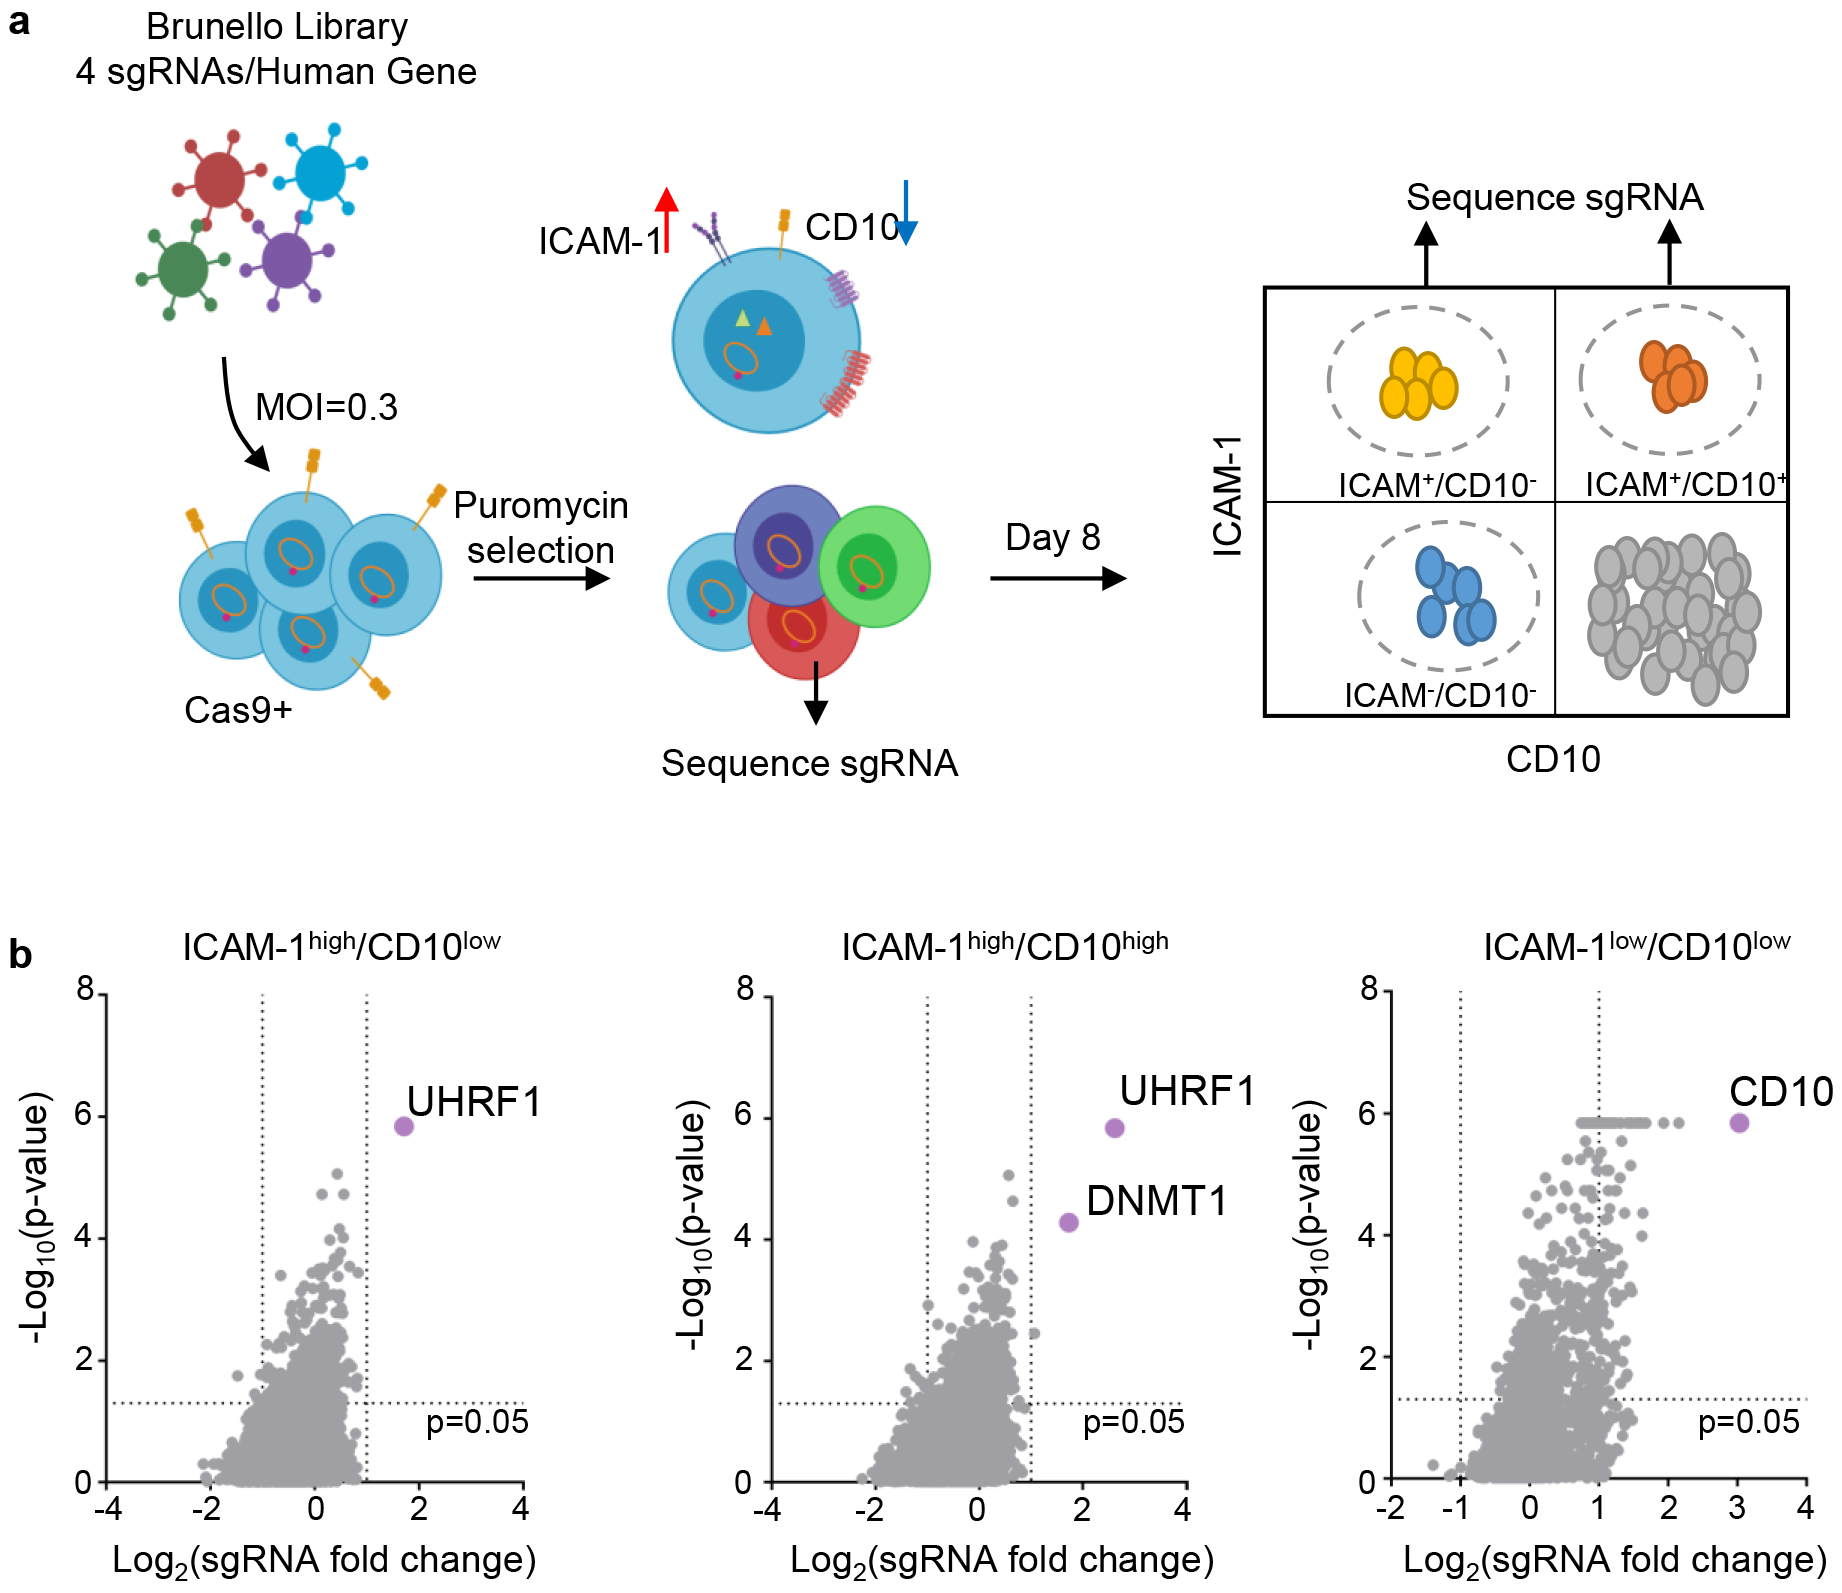
a, CRISPR/Cas9 screen workflow. Cas9+ MUTU I BL cells transduced with the Brunello sgRNA library, puromycin selected and then FACSorted at 8 days post-transduction. N=3 of biologically independent screen replicates were performed.
b, Volcano plots showing the -Log10(p-value) statistical significance (y-axis) and Log2 fold-change (x-axis) calculated by STARS analysis of sgRNA abundance in the input versus FACSorted ICAM-1high/CD10low (left), ICAM-1high/CD10high (middle), and ICAMlow/CD10low (right) populations. Top screen hits are highlighted in purple. n=3 of biologically independent replicates. P-values were determined by one-sided Fisher’s exact test.
The epigenetic enzymes ubiquitin-like with plant homeodomain (PHD) and RING finger domains 1 (UHRF1) and DNA methyltransferase I (DNMT1) were the top ICAMhigh screen hits (Fig. 1b, Extended Data Fig. 1d–e). UHRF1 and DNMT1 jointly mediate epigenetic inheritance of DNA methylation, but have not previously been implicated in viral gene regulation. UHRF1 binds to newly replicated DNA through interaction with CpG hemimethylated DNA and histone H3, where it monoubiquitinates histone H3 lysines 18 and 23. This signal recruits DNMT1 to ensure propagation of DNA methylation marks24–27.
UHRF1 and DNMT1 are upregulated in GC B-cells28,29, where EBNA silencing occurs. Stimulation of primary human B-cells by CD40L or anti-IgM, whose signaling is mimicked by LMP130,31 or LMP2A respectively, or by toll-like receptor 9 agonist CpG induced UHRF1 and DNMT1 expression (Extended Data Fig. 2a). EBV induces UHRF1 and DNMT1 in newly infected primary B-cells7,8,32,33 (Extended Data Fig. 2b and c), and LMP1/2A co-expression upregulates UHRF1 and DNMT1 in GC B-cells in vivo34 (Extended Data Fig. 2d). UHRF1 and DNMT1 are expressed in BL. These data suggest that maintenance of DNA methylation machinery is expressed in sites where latency switching is established and maintained.
UHRF1 Loss Reverses EBV Latency Promotor Methylation and De-represses Latency III
To identify UHRF1 depletion effects on EBV, control or UHRF1 targeting sgRNAs were expressed in MUTU I. UHRF1 depletion upregulated ICAM-1 in most cells (Fig. 2a). Immunoblot and RNAseq demonstrated de-repression of EBV latency III and induction of the LMP1/NF-kB target TRAF1 in UHRF1 knockout (KO) MUTU I and in Rael BL cells (Fig. 2b and c). UHRF1 depletion also de-repressed the EBV lytic gene BZLF1 in MUTU I and Rael. Although EBNA1 mRNA was highly upregulated by UHRF1 sgRNA (Extended Data Fig. 2e), EBNA1 protein abundance was only modestly upregulated by UHRF1 depletion in MUTU I and not in Rael BL, suggesting post-transcriptional effects limit EBNA1 (Fig. 2b,c). UHRF1 loss induced LMP1, EBNA2, BZLF1 and BMRF1 over 24 days of culture (Extended Data Fig. 2f). Membrane colocalized LMP1/21 and nuclear EBNA2 expression were evident (Extended Data Fig. 3a and b).
Fig. 2. UHRF1 is necessary for Latency III oncoprotein restriction in BL.
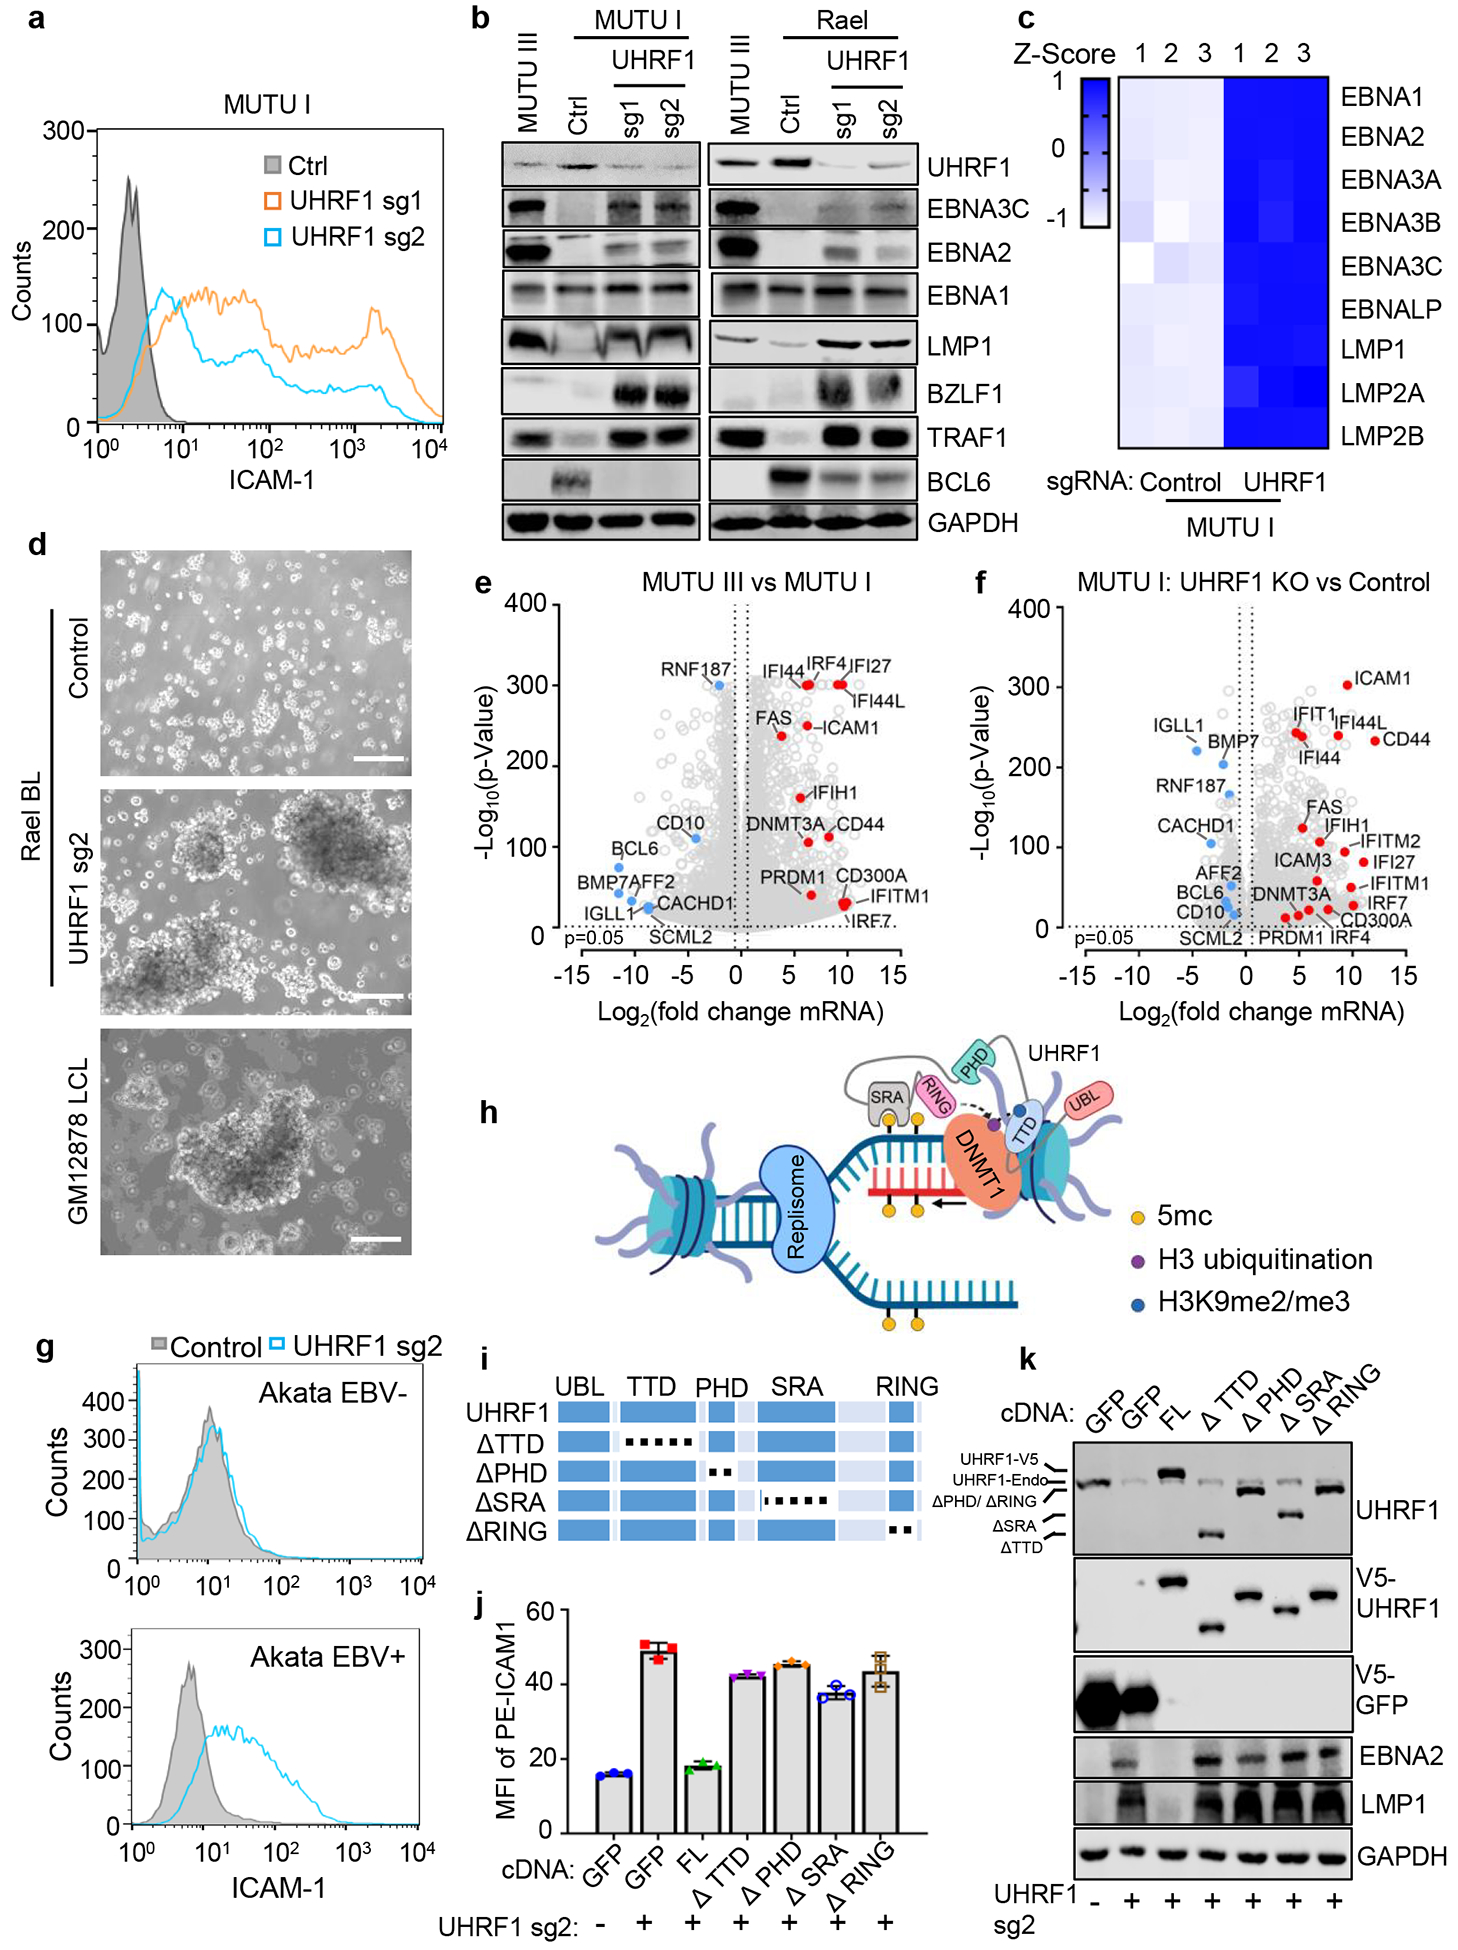
a, FACS analysis of plasma membrane (PM) ICAM-1 abundance in MUTU I with indicated sgRNAs.
b, Immunoblot analysis of whole cell lysates (WCL) of MUTU I with indicated sgRNAs. MUTU III WCL was used as a positive control.
c, Heatmap visualization of RNAseq mRNA abundances of MUTU I cells with indicated sgRNAs. Z-scores describe normalized read count positions in terms of distance from the mean in the standard deviation unit.
d, Phase microscopy images of Rael BL expressing control (top) or UHRF1 (middle) sgRNAs or GM12878 LCLs. Scale bar, 100 μm.
e, RNAseq volcano plot of -Log10 (p-value) statistical significance and Log2 fold-change mRNA abundance in MUTU III versus MUTU I cells. Selected genes induced in MUTU III (red dots) versus MUTU I (blue dots) are highlighted.
f, RNA-seq volcano plot of -Log10 (p-value) statistical significance versus Log2 fold-change in mRNA abundance of MUTU I cells with indicated sgRNAs. Selected genes highly induced in UHRF1 sgRNA (red dots) versus in control sgRNA cells (blue dots) are highlighted.
g, FACS analysis of PM ICAM-1 in EBV negative or positive Akata BL with indicated sgRNA expression.
h, Model of UHRF1 and DNMT1 roles at newly synthesized DNA. Interaction between UHRF1 UBL and hemimethylated DNA (yellow ball), PHD and histone H3 tail, TTD and H3K9me2/3 (green ball) and RING domain-mediated H3, K18, and K23 monoubiquitination (purple balls) are shown.
i, Model of UHRF1 and truncation mutants. Deletions are indicated by dotted lines.
j, FACS analysis of PM ICAM-1 mean fluorescence intensity (MFI) in MUTU I with indicated sgRNA and GFP, full-length (FL) or deletion mutant UHRF1 rescue constructs, as indicated. Mean + SD from n=3 technical replicates. Data are representative of n=2 biologically independent experiments.
k, Immunoblot analysis of WCL from MUTU I cells with GFP, FL or domain truncated UHRF1 together with indicated sgRNAs.
Data were from n=3 biologically independent replicates except where indicated. Blots in b and k and FACS plots in a and g were representative of n=3 biologically independent experiments. P-value and log fold change in e-g were generated with DESeq under default settings with Wald test and Normal shrinkage, respectively.
Remarkably, UHRF1 depletion transformed the BL cellular phenotype to resemble that of latency III LCLs, with formation of large cell clumps (Fig. 2d)18,35. RNAseq demonstrated host and viral genome-wide changes suggestive of latency III reprogramming in UHRF1-depleted MUTU I and also in Rael BL, which tightly maintain latency I13 (Fig. 2e and f; Extended Data Fig. 4a–c). mRNAs encoding CD10 and the BL master regulator BCL6 were strongly downmodulated by latency III or by UHRF1 depletion (Fig. 2e–f, Extended Data Fig. 4a). EBNA3C and IRF4 can each repress BCL636,37, suggesting a possible mechanism by which URHF1 depletion induces EBNA3C and IRF4 but represses BCL6.
The top 20 gene ontology terms upregulated by latency III or by UHRF1 KO in MUTU I included LMP1 target adhesion molecules and TNF (Extended Data Fig. 4b). FACS analysis demonstrated ICAM-1 and LMP1 abundance to be highly correlated at the single cell level (Extended Data Fig. 4d). UHRF1 depletion upregulated ICAM-1 in three EBV+ BL, but not in two EBV-negative B-cell lines, including a BL that lost the EBV genome (Fig. 2g and Extended Data Fig. 4d–f).
UHRF1 has epigenetic reader and writer domains25,37–39 (Fig. 2h). The TTD domain reads repressive histone H3 tail di- or tri-methylated lysine 9 (H3K9me2/me3) often present at heterochromatin sites, while the PHD domain recognizes the H3 N-terminus40,41. Newly synthesized, hemimethylated CpG is recognized by the SRA domain, which stimulates RING domain deposition of H3K18 and H3K23 monoubiquitination marks that recruit DNMT137,42. To identify domains necessary for latency I, cDNA rescue was performed in MUTU I cells depleted of endogenous UHRF1 (Fig. 2i). Whereas full length (FL) UHRF1 suppressed LMP1, EBNA2 and ICAM-1 expression, domain truncated UHRF1 rescue constructs did not, despite similar expression levels (Fig. 2j and 2k). ChIP-qPCR demonstrated H3K9me3 marks and UHRF1 occupancy at the latency III viral C and LMP promoters in MUTU I cells, but not in MUTU III cells (Fig. 3a and 3b). These results indicate that UHRF1 interactions with methylated H3K9, hemimethylated DNA and likely histone ubiquitination are each important for latency I maintenance.
Fig 3. UHRF1 maintains EBV latency promotor methylation.
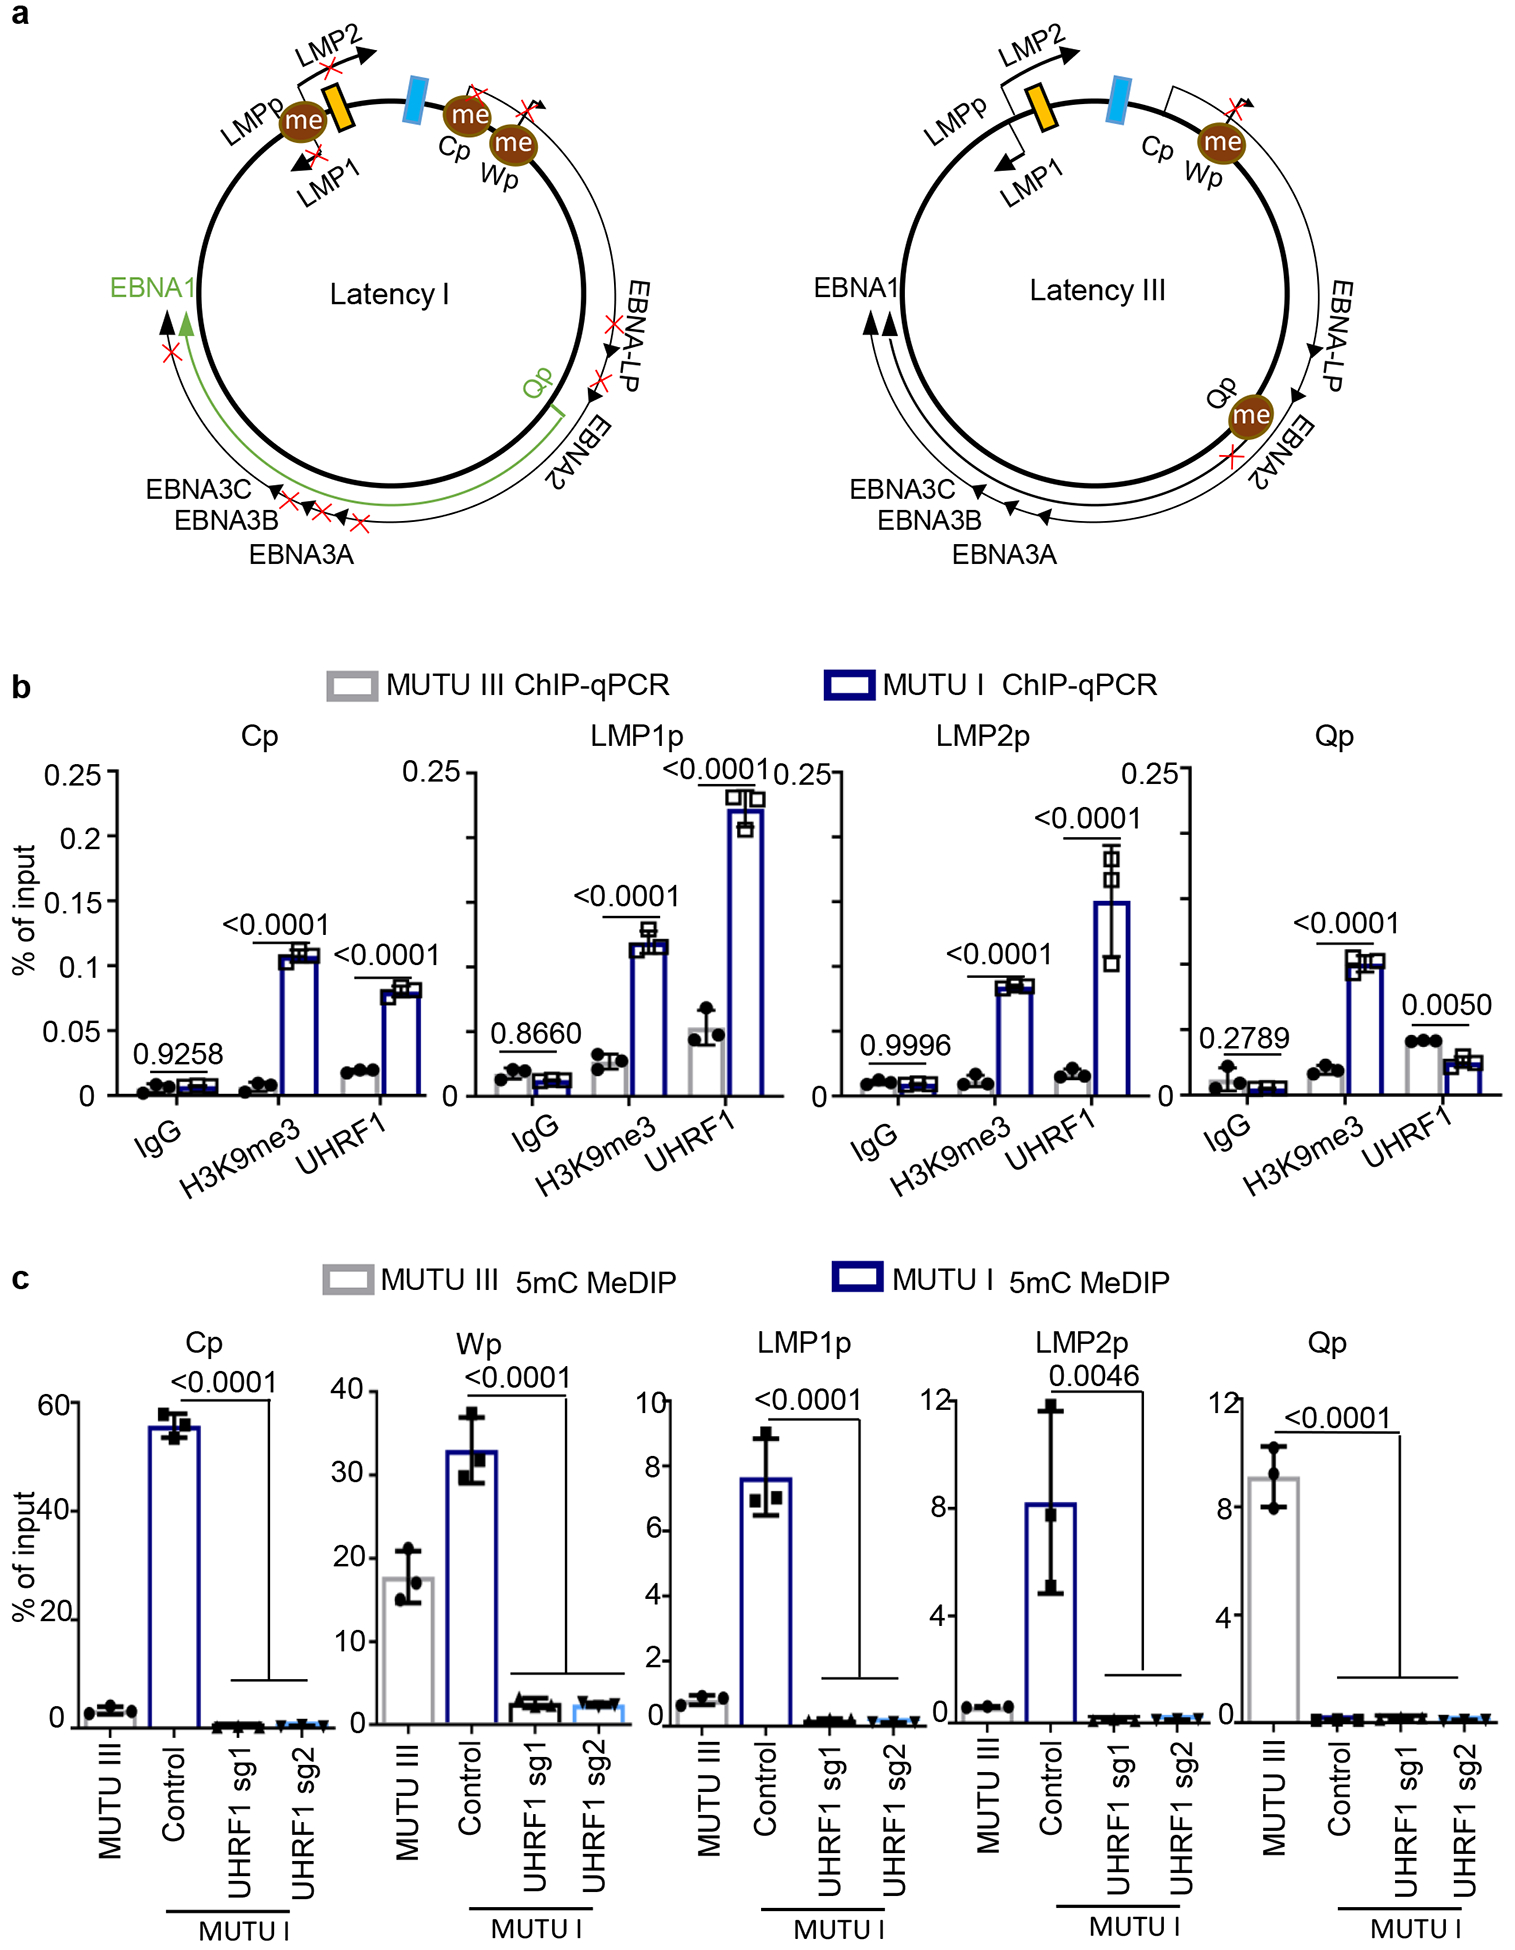
a, Schematic diagram of EBV latency Cp, Wp and Qp promotor usage in latency I (left) versus latency III (right). Brown circle indicates DNA CpG methylation, red “x” indicates epigenetically blocked transcription.
b, ChIP for UHRF1 or H3K9me3 was performed on chromatin from MUTU I (blue columns) or MUTU III (gray columns) followed by qPCR with primers specific for Cp, LMP1p, LMP2p or Qp. Mean ± SEM are shown for n=3 biologically independent replicates are shown. p-values were calculated by two-way ANOVA with Sidak’s multiple comparisons test.
c, MeDIP was performed on DNA from MUTU III (gray bars) or in MUTU I (blue bars) that expressed control or independent UHRF1 sgRNAs followed by qPCR with primers specific for Cp, Wp, LMP1p, LMP2p or Qp. Mean ± SEM for n=3 biologically independent replicates are shown. p-values were calculated using one-way ANOVA with Sidak’s multiple comparisons test.
We performed ChIP to measure UHRF1 occupancy and H3K9me3 signals at the C and LMP promoters (Cp and LMPp) in latency I and III. Even though UHRF1 was highly expressed in MUTU III (Fig. 2b), UHRF1 ChIP and H3K9me3 signals were significantly higher at Cp and LMPp in MUTU I (Fig. 3b). UHRF1 Qp occupancy was somewhat higher in MUTU III (Fig. 3b).
Methylated DNA immunoprecipitation (MeDIP) was used to investigate UHRF1 depletion effects on EBV promoter methylation. As expected43, Cp, Wp and LMPp were highly methylated in MUTU I, but not MUTU III, whereas Qp exhibited the opposite pattern. UHRF1 depletion caused near total loss of DNA methylation at MUTU I Cp, Wp and LMPp (Fig. 3c). MeDIP demonstrated absence of DNA methylation at Cp and LMP1p in three LCLs, with varying levels of Wp and Qp methylation (Extended Data Fig. 5a). These results suggest UHRF1 roles in suppression of the C, W and LMP promoters in latency I.
Experiments were repeated in the presence of acyclovir, to exclude effects of EBV lytic cycle de-repression and production of unmethylated genomes by the viral polymerase. MeDIP was performed on chromatin from acyclovir-treated sgControl ICAM-1low cells versus from sgUHRF1 ICAM-1high cells (Extended Data Fig. 5b). sgUHRF1 mediated loss of Cp and Wp CpG methylation (Extended Data Fig. 5c), as well as of the STAT3 promoter, whose activity is regulated by DNA methylation44 (Extended Data Fig. 5d). By contrast, similarly low methylation levels were observed at the TRAF1 promoter, where NF-kB occupancy instead regulates expression (Extended Data Fig. 5d).
The hypomethylating agent 5-azacitidine de-represses latency III or lytic antigens in distinct BL subpopulations13. Indeed, FACS identified lytic gp350 antigen expression in a small number and ICAM-1 upregulation in a larger subpopulation of UHRF1 KO cells (Extended Data Fig. 6a). The ICAM-1high population highly expressed EBNA2 and LMP1, whereas gp350+ cells expressed more lytic antigens BZLF1 and BMRF1 (Extended Data Fig. 6b). Low BMRF1 expression in gp350low cells may result from abortive lytic replication (Extended Data Fig. 6b). RNAseq identified mRNAs of lytic antigens in gp350high cells (Extended Data Fig. 6c), and PCA analysis identified that gp350high, ICAM-1high and control groups clustered separately (Extended Data Fig. 6d). Mechanistically, UHRF1 depletion reduced CpG methylation at the EBV lytic cycle Z promoter (Zp) (Extended Data Fig. 6e). Yet, since EBV DNA methylation is also important for BZLF1 activity in B-cells45,46, UHRF1 depletion may predominantly result in latency III reprogramming. Stochastic events may also dictate switching to latency III versus lytic cycle.
DNMT1 is Necessary for BL Latency I Maintenance
DNA methyltransfereases DNMT1, DNMT3A and DNMT3B methylate the fifth carbon of cytosines at specific CpG dinucleotide regions in mammalian cells. DNMT1 KO induced EBNA2, LMP1, ICAM-1 and BZLF1 expression while suppressing BCL6 in MUTU I and Rael BL cells (Fig. 4a, 4b). MeDIP identified loss of Cp, LMP1p, and Wp DNA methylation in DNMT1-depleted MUTU I cells, whereas Qp remained unmethylated (Fig. 4c, Extended Data Fig. 6f and 6g). Recently described DNMT1 hypomorphic activity following CRISPR editing47 may account for residual Cp and LMP1p methylation observed with sgDNMT1.
Fig. 4. DNMT1 depletion causes Cp and LMPp demethylation and de-repression of Latency III.
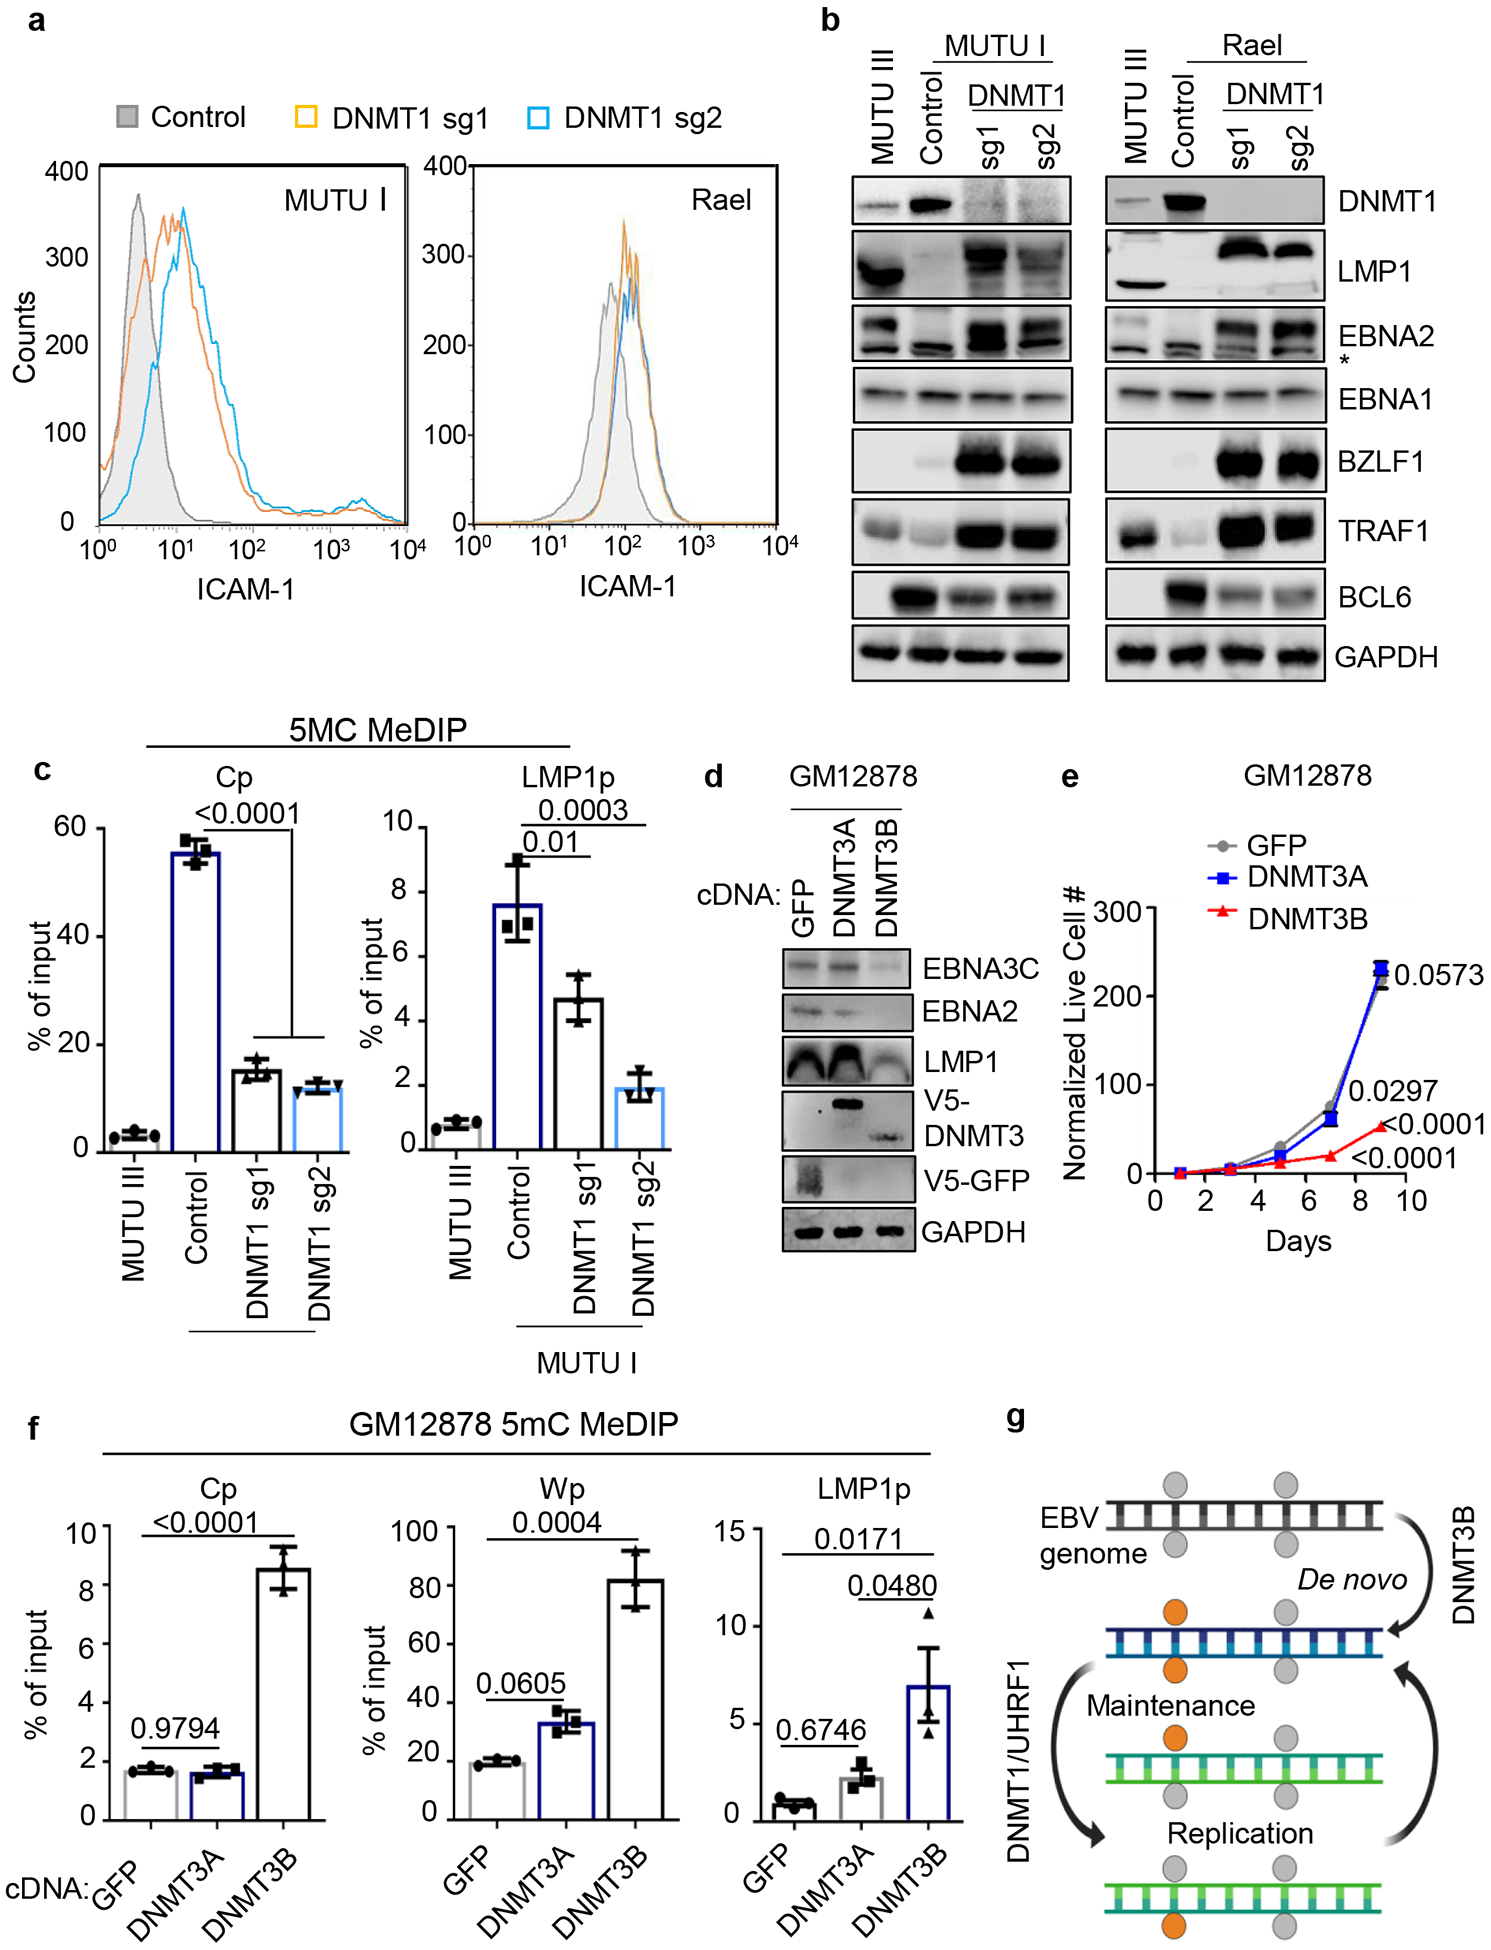
a, FACS analysis of PM ICAM-1 abundance in MUTU I (left) or Rael (right) BL expressing control or DNMT1 sgRNAs.
b, Immunoblot analysis of WCL from MUTU I (left) or Rael (right) BL that expressed control or independent DNMT1 sgRNAs. * marks a non-specific band in the EBNA2 immunoblot. MUTU III WCL was used as positive controls.
c, 5 mC MeDIP was performed on DNA from MUTU III or MUTU I that expressed control or independent DNMT1 sgRNAs followed by qPCR for Cp (left) or LMP1p (right). Shown are the mean ± SEM for n=3 biologically independent replicates. p-values were calculated using one-way ANOVA with Sidak’s multiple comparisons test.
d, Immunoblot analysis of WCL from GM12878 LCLs that stably expressed control GFP, DNMT3A or DNMT3B.
e, Growth curve analysis of GM12878 LCLs that stably expressed control GFP, DNMT3A or DNMT3B cDNAs. Mean ± SEM are shown for n=3 biologically independent replicates. p-values were calculated using two-way ANOVA with Turkey’s multiple comparisons test.
f, 5 mC MeDIP was performed on DNA from GM12878 LCLs that expressed control GFP (black bars), DNMT3A (gray bars) or DNMT3B (blue bars) followed by qPCR for the Cp, Wp or LMP1p. Mean ± SEM for n=3 biologically independent replicates are shown. p-values were calculated using one-way ANOVA with Sidak’s multiple comparisons test.
g, Model of epigenetic initiation versus maintenance of DNA CpG methylation as EBV-infected B-cells progress from latency III to I. DNMT3B initiates CpG methylation, which is subsequently maintained by UHRF1/DNMT1. Gray circle, unmethylated CpG site; orange circle, methylated CpG site.
FACS plots in 4a and blots in 4b and c are representative of at least n=3 biologically independent replicates.
We asked whether UHRF1 and DNMT1 were necessary for latency III restriction in primary effusion lymphoma (PEL), in which EBV and Kaposi Sarcoma Herpesvirus co-infect 80–90% of tumors48,49. PEL typically express EBNA1 and in some cases also LMP2A. Although CpG methylation contributes to PEL target gene regulation, UHRF1 or DNMT1 sgRNAs failed to induce EBNA2, LMP1 or BZLF1, despite strongly reducing Cp and LMP1p DNA methylation levels (Extended Data Fig. 7a and 7b). As hypomethylating agents do not induce latency III in PEL50, additional mechanisms likely suppress EBV latency III promoters in this plasmablast-like environment.
We next tested UHRF1 or DNMT1 KO in latently infected gastric carcinoma and nasopharyngeal carcinoma (NPC) cells. In NUGC3 gastric carcinoma cells, depletion of UHRF1 or DNMT1 upregulated LMP1, EBNA2 and BZLF1 from baseline levels (Extended Data Fig. 7c). UHRF1 and DNMT1 may therefore serve to fine-tune EBV gene expression in this GC epithelial cell context. Similarly, one of two UHRF1 or DNMT1 sgRNAs upregulated LMP1 from baseline levels in C666.1 NPC cells, but failed to de-repress EBNA2 or 3C expression (Extended Data Fig. 7d and 7e). Yet, MeDIP analysis identified that sgUHRF1 significantly downmodulated C666.1 Cp and LMP1p methylation (Extended Data Fig. 7f). Additional mechanisms likely suppress latency III in these carcinoma cells.
De novo DNA Methyltransferase DNMT3B Restricts Latency III
De novo methyltransferases DNMT3A and DNMT3B dictate new methylation patterns and have germinal center B-cell autonomous roles51,52. DNMT3A, but not DNMT3B, is upregulated in newly EBV infected B-cells8 (Extended Data Fig. 2b,c), by latency III in MUTU (Extended Data Table 1), and by LMP1/LMP2A co-expression in mouse germinal center B-cells in vivo34 (Extended Data Fig. 2d). Interestingly, DNMT3B is induced and DNTM3A is suppressed in human tonsil GC B-cells, where restriction of EBV latency III antigens is initiated (Extended Data Fig. 8a)53.
To test the hypothesis that DNMT3B induces Cp silencing, green fluorescence protein (GFP) control, DNMT3A or DNMT3B were over-expressed in GM12878 LCLs. DNMT3B, but not DNMT3A or GFP, repressed EBNA2, 3C and LMP1 expression and impaired growth and survival (Fig. 4d and 4e; Extended Data Fig. 8b–d), presumably due to viral oncoprotein loss. qRT-PCR confirmed that DNMT3B, and to a lesser extent DNMT3A, reduced LMP1 mRNA abundance in GM12878 (Extended Data Fig. 8d). DNMT3B over-expression similarly reduced EBNA2, 3C and LMP1 expression in GM11380 LCLs (Extended Data Fig. 8e). Either DNMT3A or DNMT3B reduced EBNA2, 3C and LMP1 expression in MUTU III but did not impair proliferation (Extended Data Fig. 8f, g), likely because of BL oncogenic drivers including translocated MYC.
Consistent with DNMT3B effects at the EBV latency promoter level, GM12878 DNMT3B overexpression increased Cp methylation (Fig. 4f). While DNMT3A binds Wp in LCLs54, DNMT3B increased Wp methylation by 4-fold (up to ~80% of input), compared with <2-fold by DNMT3A (Fig. 4f). Yet, LMP1p methylation was significantly increased by either DNMT3A or DNMT3B (Fig. 4f, Extended Data Fig. 8h). Since EBNA2 is a major activator of LMPp in LCLs, DNMT3B silencing of Cp likely contributed to effects on GM12878 and GM11830 LMP1 levels (Fig. 4d and Extended Data Fig. 8d,e). These results suggest that DNMT3B may initiate Cp methylation to silence latency III, perhaps as EBV-infected B-cells enter GCs (Fig. 4g). Interestingly, DNMT3B is expressed in EBV-negative BCBL-1 PEL cells, but not in JSC-1 or BC1 PELs co-infected EBV and KSHV (Extended Data Fig. 8i). We speculate that DNMT3B initiated Cp and LMPp silencing (Extended Data Fig. 7b) at an earlier stage of tumor development.
DNA Methylation and Polycomb Repression are Each Important for LMP Silencing
Lack of models limits understanding of LMPp regulation in latency II. We therefore tested UHRF1 or DNMT1 sgRNA effects on LMP expression in BLs that lack EBNA2, which occurs in ~15% of BL55. Unexpectedly, UHRF1 or DNMT1 KO in EBNA2-deficient P3HR-1 or Daudi BL upregulated LMP1 expression and demethylated LMP1p and Cp, although EBNA3C de-repression was not evident on the protein level (Fig. 5a–d). PM LMP1 and LMP2A co-expression was evident by confocal microscopy in UHRF1 KO (Fig. 5e). BZLF1 was also induced by UHRF1 or DNMT1 depletion. These results suggest that DNA methylation is important for LMPp silencing in an EBNA2-independent manner, and raise the question of how LMPp but not Cp escapes silencing in latency II, such as in Hodgkin Reed-Sternberg cells.
Fig. 5. UHRF1 and DNMT1 maintenance of DNA methylation is important for silencing BL LMP1 and 2A expression in the absence of EBNA2.
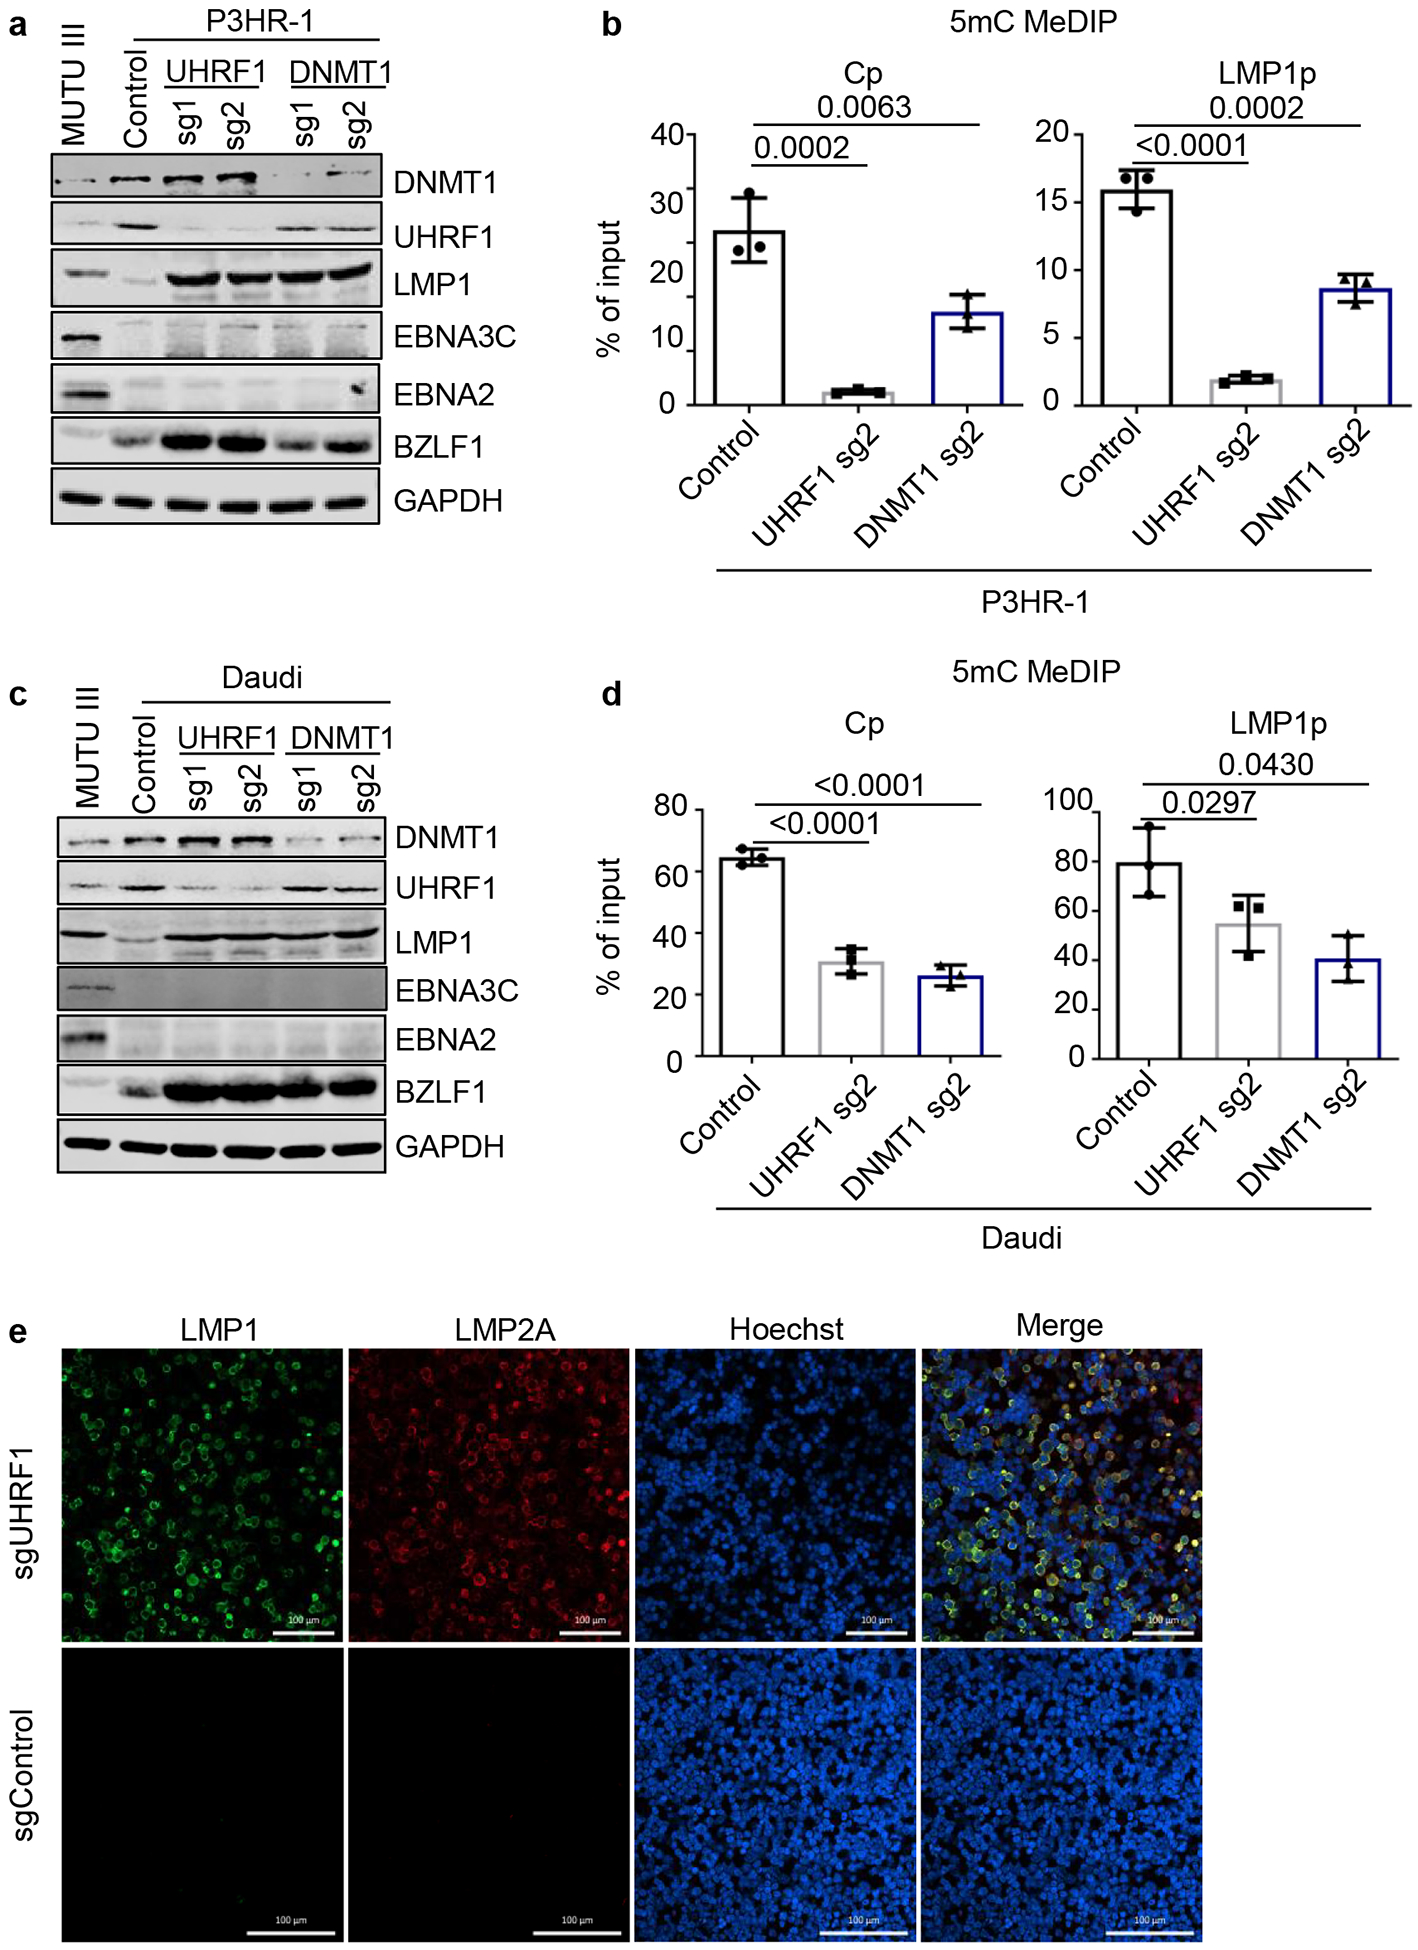
a, Immunoblot analysis of WCL from MUTU III or from P3HR-1 BL that expressed the indicated control, UHRF1 or DNMT1 sgRNAs. P3HR-1 harbor EBNA2-deleted EBV genomes that preclude Cp-activated latency III expression.
b, 5 mC MeDIP was performed on DNA from P3HR-1 BL that expressed control sgRNA (black bars), UHRF1 sg2 (gray bars) or DNMT1 sg2 (blue bars), followed by qPCR for Cp or LMP1p. Mean ± SEM for n=3 biologically independent replicates are shown. p-values were calculated by calculated using one-way ANOVA with Sidak’s multiple comparisons test.
c, Immunoblot analysis of WCL from MUTU III or from Daudi BL that expressed the indicated control, UHRF1 or DNMT1 sgRNAs. Daudi cells harbor EBNA2-deleted EBV genomes that preclude Cp-activated latency III expression.
d, 5 mC MeDIP was performed on DNA from Daudi BL that expressed control sgRNA (black bars), UHRF1 sg2 (gray bars) or DNMT1 sg2 (blue bars) followed by qPCR for the Cp or LMP1p. Mean ± SEM for n=3 biologically independent replicates are shown. p-values were calculated by paired two-sided student’s t-test with equal variance assumption.
e, Confocal immunofluorescence analysis of LMP1 or LMP2A expression in Daudi BL with control or UHRF1 sgRNAs. Nuclei are stained by Hoechst. White scale bar indicates 100 μM.
Polycomb repressive complexes 1 and 2 (PRC1 and PRC2) have important roles in EBV-mediated regulation of host genes56. While PRC2 EBV lytic gene regulation has been investigated, PRC1 roles in EBV gene regulation have not been reported. Interestingly, the PRC1 regulatory subunit SCML2 and catalytic subunit RING1 each scored as weak screen hits (Extended Data Figs. 1c and 9a). Additionally, SCML2 was amongst the most highly downregulated MUTU gene by latency III or UHRF1 KO (Fig 2e and 2f and Extended Data Fig. 9b).
To test PRC1 depletion effects on latency gene expression, SCML2 or RING1 sgRNAs were expressed in MUTU I. Perturbation of either PRC1 subunit increased EBNA3C mRNA abundance, though effects on EBNA3C protein were subtle (Fig. 6a, Extended Data Fig. 9c–d). RING1 depletion upregulated LMP1/2A and TRAF1 (Fig. 6a and 6b). RING1 sgRNAs induced LMP1 in EBNA2-deficient BL, suggesting potential roles at the LMPp level (Extended Data Fig. 9e–f).
Fig. 6. DNA methylation and PRC1-mediated histone ubiquitylation non-redundantly control latent membrane protein expression.
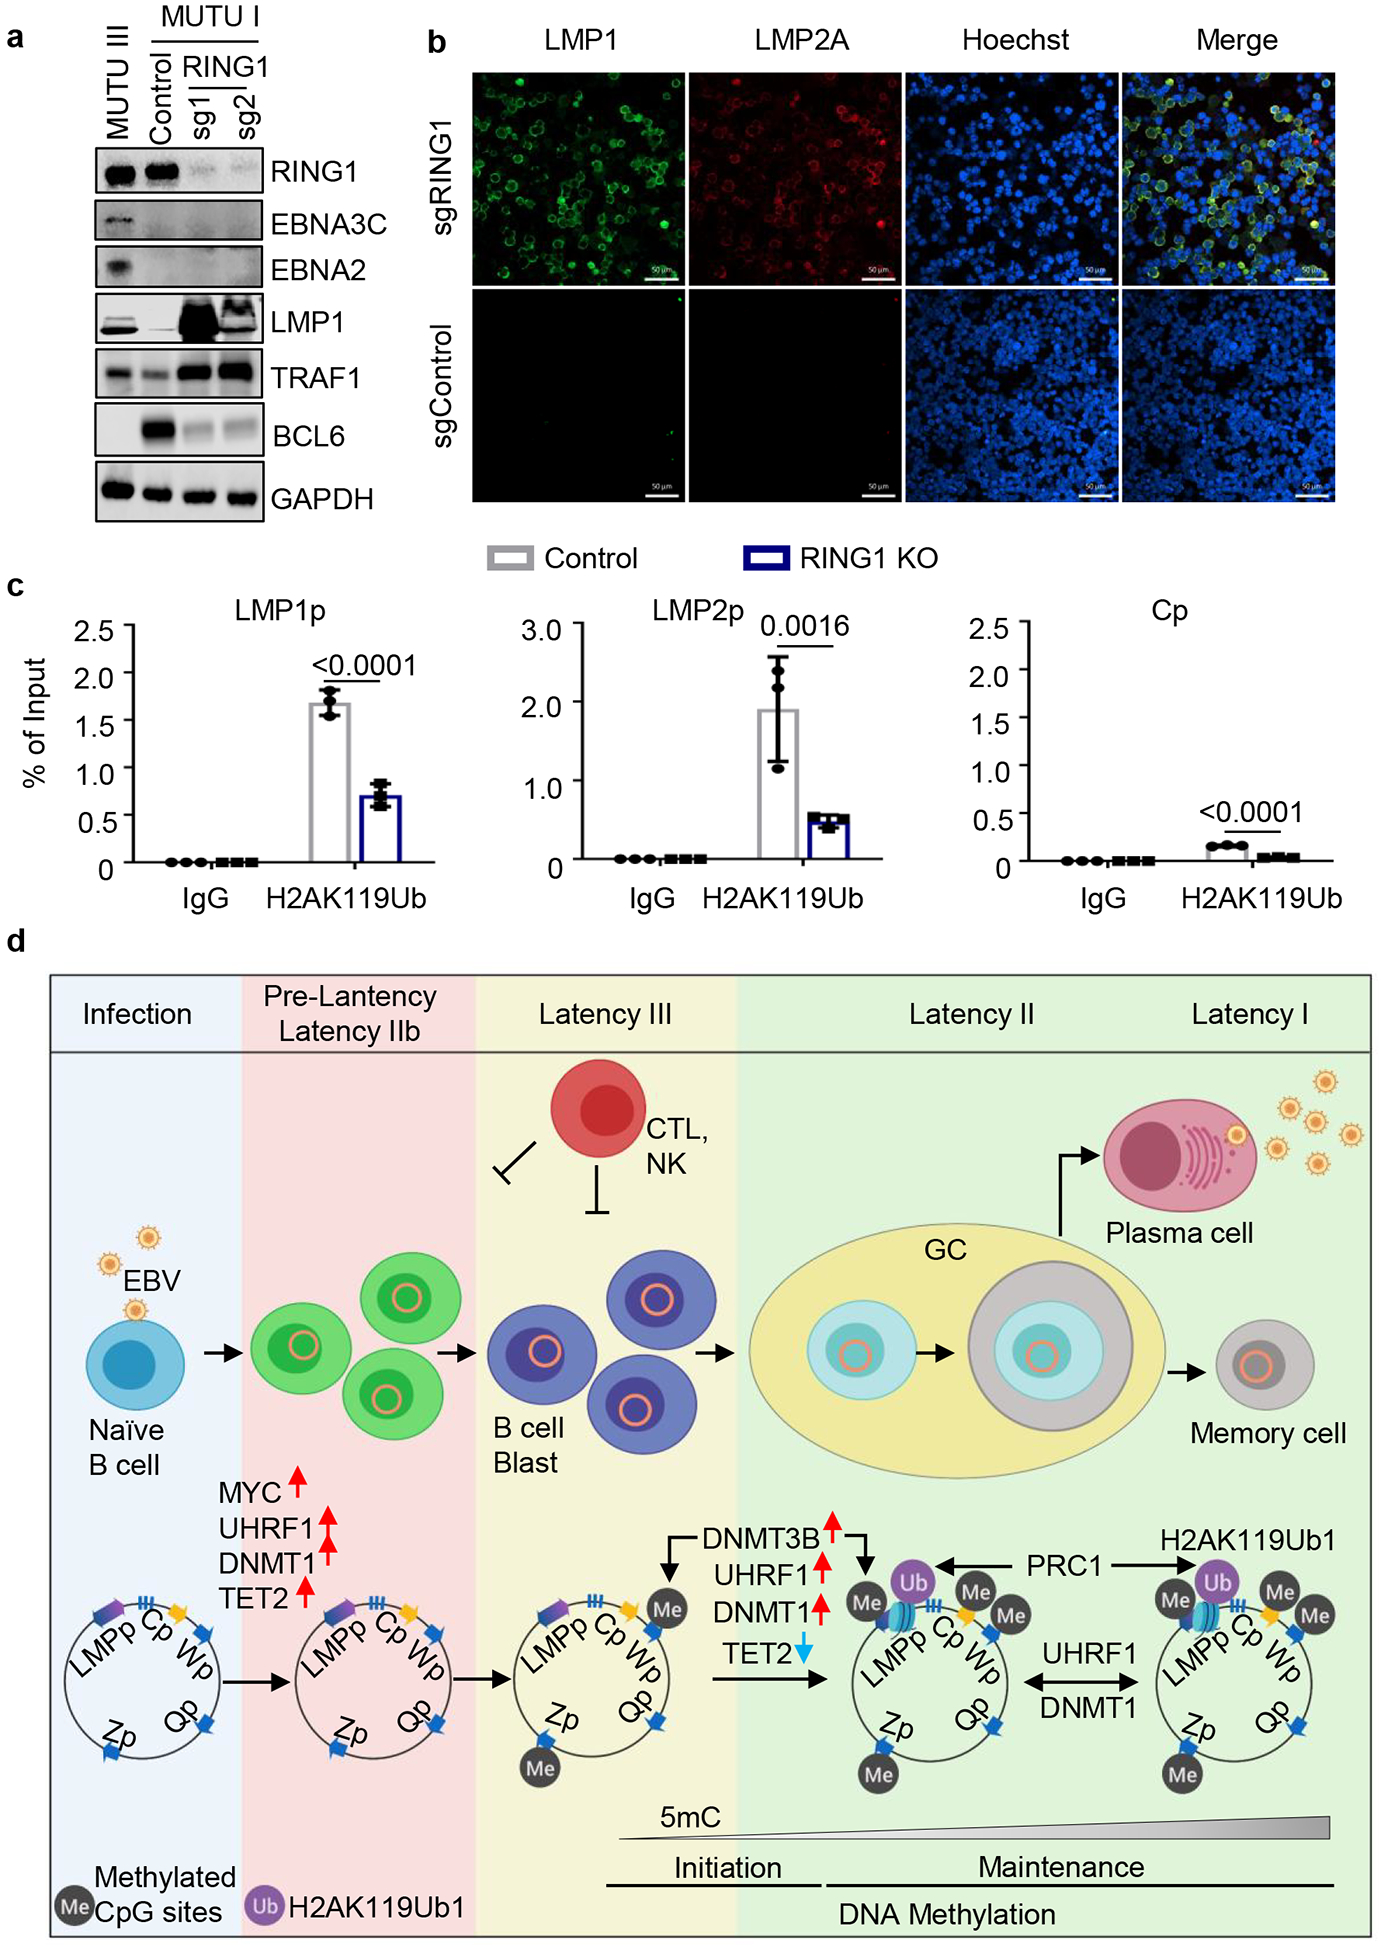
a, Immunoblot analysis of WCL from MUTU III or from MUTU I that expressed control or independent RING1 sgRNAs.
b, Confocal immunofluorescence analysis of LMP1 or LMP2A expression in MUTU I cells with control or UHRF1 sgRNAs. Nuclei are stained by Hoechst. White scale bar indicates 50 μm.
c, ChIP using control IgG versus anti-H2Ak119Ub antibody was performed on DNA from MUTU I with control (black bars) or RING1 (blue bars) sgRNAs followed by qPCR for the LMP1, LMP2 or C promoters. Shown are the mean ± SEM values from n=3 biologically independent replicates. p-values were calculated by calculated using two-way ANOVA with Sidak’s multiple comparisons test.
d, Schematic germinal center model of EBV latency gene epigenetic regulation. Wp and subsequently Cp drive EBNA expression in newly infected cells. UHRF1 and DNMT1 are upregulated early after infection, but EBNA2 also upregulates the TET2 DNA demethylase, which limits DNA methylation. The initiator methyltransferase DNMT3B is not yet expressed, thereby allowing EBV C promoter activation. As MYC levels diminish, LMP promoters are activated and latency III becomes operative. Latency III cells migrate to GCs, where the initiator DNMT3B is induced and where DNMT1 and UHRF1 levels increase. DNMT3b-mediated Cp methylation silences expression of all EBNAs except EBNA1, which instead becomes expressed from Qp. TET2 levels decrease with EBNA2 silencing, further supporting EBV genomic DNA methylation. As infected cells differentiate into memory B-cells, DNA methylation and PRC1-mediated H2AK119Ub1 jointly silence the LMP promoters, allowing transition to latency I, where Qp drives the EBNA1-only program. UHRF1 and DNMT1 maintain DNA methylation in latency I and PRC1 maintains H2AK119UB1, enforcing Cp, Wp and LMPp silencing.
Blots in 6a, b and images in 6e are representative of at least n=3 biologically independent replicates.
PRC1 KO suppressed BCL6 in MUTU I, but not in two EBV-negative B-cell lines (Figure 6a, Extended Data Figs. 9c and 9g) or in Daudi (Extended Data Figs. 9e and 9f). SCML2 or RING1 sgRNAs also failed to induce IRF4, a target of EBNA3C and LMP1/2A (Extended Data Figs. 9h, 9i). By contrast, LCL RING1 overexpression upregulated BCL6 and downregulated EBNA2, 3C and LMP1 (Extended Data Figs. 10a and 10b). Therefore, PRC1 effects on BCL6 may be dependent on EBNA3C or perhaps EBNA2, which also suppresses BCL636.
Mammalian PRC1 represses transcription by several mechanisms, including histone 2A lysine 119 mono-ubiquitination (H2AK119Ub1). Consistent with a PRC1 role in LMPp silencing, ChIP-qPCR identified H2AK119Ub1 at LMPp in MUTU I, which was reduced by RING1 KO (Fig 6c). Furthermore, H2AK119Ub1 signal at LMPp and Cp were reduced in MUTU III cells (Extended Data Fig. 10c). These results suggest PRC1 and CpG methylation are each important for LMPp regulation (Fig. 6d, Extended Data Fig. 10d).
Discussion
According to the “germinal center model”1,3, EBV subverts lymphoid tissue B-cell biology to expand the pool of infected cells, establish persistent infection and transmit. Our results suggest that EBV co-opts GC B-cell epigenetic pathways to regulate viral oncoprotein expression. These mechanisms also have relevance to the pathogenesis of GC-derived EBV-associated cancers, including Burkitt, Hodgkin and post-transplant lymphomas, where EBV genomes are copied and programmed to the appropriate latency state with each cell cycle.
We speculate that DNMT3B, expressed in human tonsil GC but not in resting or memory B-cells53, initiates latency III silencing. EBV induces DNMT3A, but not DNMT3B expression in newly infected B-cells in vitro8,54. DNMT3B was also not expressed in several hundred LCLs profiled by RNAseq57. Cp may therefore have evolved to be targeted by DNMT3B, linking B-cell state and EBV. DNMT3B deficiency causes immunodeficiency, centromeric instability and facial anomalies (ICF) syndrome, with loss of CD19+CD27+ memory B-cells and potentially severe infectious mononucleosis58. Mononucleosis symptoms are partially driven by T-cell responses to latency III antigens.
UHRF1 and DNMT1 are each important for GC formation and were each found to be necessary for latency I maintenance. UHRF1 epigenetic reader and writer domains were critical for latency I maintenance, suggesting that UHRF1 integrates EBV genomic DNA and histone methylation signals. H3K9me2/3 and DNA hemimethylation likely recruit UHRF1 to newly synthesized EBV genomes, where it ubiquitinates histone H3 tails at Cp and LMPp and recruits DNMT1. DNMT1 knockdown was insufficient to de-repress latency III17, suggesting that low abundance DNMT1 may be sufficient for Cp and LMPp methylation. Occupancy by a protein-repressor may instead silence Qp in latency III59.
PRC1-mediated histone H2A ubiquitylation and nucleosome compaction regulate cellular differentiation60. Our data suggests PRC1 likewise provides a second layer of LMP promoter control, with potential implications for latency II regulation in Hodgkin Reed-Sternberg (HRS) cells. Since all PRC1 complexes use RING1, whereas only one uses SCML2, variability of SCML2 depletion phenotypes may relate to differences in PRC1 subunit composition within the BL tested. Alternatively, depletion of the catalytic RING1 subunit may have more significant effects on LMP expression.
Our study highlights therapeutic targets for BL immuno-oncology approaches. For instance, chemical antagonists of UHRF1, DNMT1 or PRC1 may serve to sensitize EBV-infected Burkitt tumors to attack by circulating or adoptively transferred cytotoxic T-cells. Indeed, latency III supplies immunogenic EBNA and LMP epitopes for antigen presentation and enhances T-cell responses by upregulation of MHC class I, CD86 and other T-cell stimulatory ligands61. Latency III de-repression may also sensitize BL to attack by recently developed T-cell receptor-mimic bispecific antibodies targeting LMP2A62.
Methods
Cell lines and reagents
The BL cell lines MUTU I, MUTU III and KEM I were obtained from Dr. Jeffrey Sample. The BL cell lines P3HR-1 cl16, EBV+Akata, EBV- Akata and Daudi BL, and and EBV+ gastric carcinoma NUGC3 cells were obtained from Elliott Kieff. Rael BL cells were obtained from Lisa Giulino-Roth and Ethel Cesarman. JSC-1, BC-1, BCBL-1, and C666.1cells were obtained from Bo Zhao. The B-ALL REH cell line was obtained from ATCC. GM12878 and GM11380 LCLs were obtained from the Coriell Institute for Medical Research. MUTU I, Rael and KEM I cells were authenticated by the Idexx CellCheck 9 - human STR Profile and Inter-species Contamination Test. Cell lines with stable Streptococcus pyogenes Cas9 expression were generated by lentiviral transduction and blasticidin selection (5 ug/ml). Unless otherwise indicated, all cell lines used in the study were Cas9+. Cells were cultured in a humidified incubator at 37°C with 5% CO2 and routinely tested and certified as mycoplasma-free using the MycoAlert kit (Lonza). B cells were grown in RPMI 1640 medium (GIBCO, Life Technologies) with 10% fetal bovine serum (FBS, Gibco). 293T were obtained from ATCC and grown in Dulbecco’s Modified Eagle’s Medium (DMEM) with 10% FBS. For selection of transduced cells, puromycin was added at the concentration of 3 ug/ml. Hygromycin was used at 400 ug/ml for the initial 4 days, and 200 ug/ml thereafter. Acyclovir (APExBio Cat#A8644) was used at the concentration of 50μg/ml. All cell lines were routinely tested for mycoplasma by Lonza Mycoalert. Antibodies used in the study was listed in Reporting Summary.
CRISPR/Cas9 Screen
130 million Cas9+ MUTU I cells were spinoculated in 12-well plates in the presence of 4 ug/ul polybrene at 300 g at room temperature for 2 hours with the Brunello sgRNA library at a multiplicity of infection of 0.3 to minimize co-transduction. Plates were then returned to the incubator for additional 6 hours, followed by exchange fresh cell culture medium. Transduced cells were selected with 3 ug/ml of puromycin at 48 hours post transduction. Transduced cells were then passed every 72 hours, maintaining at least 40 million per library after each passage to ensure adequate complexity. At day 8 post transduction, genomic DNA was extracted from 40 million cells per each screen replicate using the Blood and Cell Culture DNA Maxi Kit (Qiagen) as the input. 160 million cells were double stained by PE anti-human ICAM-1 (#555511, BD Bioscience) and APC anti-human CD10 (#312210, Biolegend) at day 8 post transduction. FACSsort was performed at the, Brigham and Women’s Hospital Human Immunology Center flow cytometry core. Sorted cell genomic DNA was extracted by Blood and Cell Culture DNA Mini Kit (Qiagen). PCR amplification and next generation DNA sequencing were performed by the Broad Institute Genetic Perturbation Platform, as described63. The abundance of the PCR product was quantified by Illumina Hiseq DNA deep sequencing. STARS was used to evaluate the rank and statistical significance of screen hits, according to the manual23. For all hits, at least two independent sgRNAs scored.
Individual sgRNA CRISPR knockout analysis
Following the CRISPR screen, specific human genes were targeted by CRISPR/Cas9 engineering, using Brunello library sgRNA sequences. sgRNA oligos were obtained from Integrated DNA Technologies and cloned into the pLentiGuide-Puro vector (Addgene plasmid #52963, a gift from Feng Zhang) or into pLenti Sp BsmBI sgRNA Hygro (Addgene plasmid # 62205, a gift from Rene Maehr). Cells were selected by puromycin (3 μg/ml) and/or hygromycin (200 ug/ml), added 48 hr post-transduction. Loss of target gene protein expression was assayed by immunoblot.
cDNA rescue
UHRF1 sgRNA #2 PAM site mutation was introduced into the entry vector pDONR221-UHRF1 (BC113875, DNASU) containing DNA the sequence of V5-tagged full-length UHRF1, using the Q5 site directed mutagenesis kit (New England Biolabs), designated as pDONR221-UHRF1-PAM. The domain truncated UHRF1 cDNAs were constructed using NEBuilder® HiFi DNA Assembly Cloning Kit (New England Biolabs), based on pDonr-UHRF1-PAM. The TTD domain truncated cDNA, ΔTTD, was constructed by deleting the DNA fragment 369–855nt in the UHRF1 ORF resulting in the 124–285 amino acid deletion. The PHD domain truncated cDNA, ΔPHD, was constructed by deleting the 927–1098nt of UHRF1 ORF resulting in 310–366 amino acid deletion. The SRA domain truncated cDNA, ΔSRA, was constructed by deleting the 1323–1758nt of UHRF1 ORF resulting in 442–586 amino acid deletion. The RING domain truncated DNA, ΔRING, was constructed by deleting 2127–2289nt of UHRF1 ORF resulting the 710–763 amino acid deletion. UHRF1 cDNAs were transferred to the lentiviral vector pLX-TRC313 (Broad Institute) using Gateway LR Clonase II Enzyme Mix (Thermo Fisher Scientific). The lentivirus vector pLX-TRC313-GFP, which stably expresses a GFP cDNA was used as a control. MUTU I Cas9 cells were transduced with either pLX-TRC313 GFP or UHRF1 encoding lentiviruses. Cells were selected with hygromycin for 2 weeks. Heterogenous protein expression was confirmed by immunoblot using anti-V5 tag antibody (V8012, Sigma-Aldrich). Targeting of endogenous UHRF1 was then performed by transduction with a lentivirus that expresses UHRF2 sgRNA #2 and puromycin selection.
cDNA overexpression
Entry vectors bearing DNMT3A, DNMT3B, or RING1 cDNAs were purchased from the Harvard Plasmid Repository. DNMT3A or DNMT3B cDNAs were cloned into pLX-TRC313 (Broad Institute) using Gateway LR Clonase II Enzyme mix (Thermo Fisher Scientific). Control vector pLX-TRC313-GFP was obtained from Broad Institute. GM12878 LCLs were transduced with pLX-TRC313-GFP, -DNMT3A, or -DNMT3B encoding lentiviruses. Cells were selected with hygromycin for 2 weeks. Heterogenous protein expression was confirmed by immunoblot using anti-V5 tag antibody (V8012, Sigma-Aldrich). RING1 cDNA was cloned into pHAGE-3×FLAG-MYC vector using Gateway LR Clonase II Enzyme mix (Thermo Fisher Scientific). Control vector pHAGE-GFP was obtained from Addgene (plasmid #106281). GM12878 LCLs were transduced with either pHAGE-GFP or RING1 encoding lentiviruses. Cells were selected with puromycin for 4 days. Heterogenous protein expression was confirmed by immunoblot using anti-Flag tag antibody (F1804, Sigma-Aldrich).
Western blot analysis
Weston blot analysis was performed as previously described63. In brief, whole cell lysates (WCL) were separated by SDS-PAGE electrophoresis, transferred onto the nitrocellulose membranes, blocked with 5% milk in TBST buffer and then probed with relevant primary antibodies at 4 °C overnight, followed by secondary antibody (Cell Signaling Technology) incubation for 1 h at room temperature. Blots were then developed by incubation with ECL chemiluminescence for 1 min (Millipore) and images were captured by Licor Fc platform. All antibodies used in this study were listed in Reporting Summary.
Flow cytometry analysis
For live cells staining, 1× 10⁶ of cells were washed twice with FACS buffer (PBS, 1mM EDTA, and 0.5% BSA), followed by primary antibodies incubation for 30 min on ice. Labeled cells were then washed three times with FACS buffer. For intracellular staining, cells were treated with Fixation/Permeabilization Solution (BD Bioscience) following the manufacturer’s protocol. Cells were sorted on a BD FACSCalibur and analyzed with FlowJo X software (FlowJo). The protocol of LMP1 intracellular staining for FACS was kindly shared by Leah Kottyan and Matt Weirauch. One million of Rael cells expressing control or UHRF1 sgRNA#2 were washed by staining buffer (eBioscience Flow cytometry staining buffer, # 00–4222-26, eBioscience) twice and stained with ICAM1-PE antibody (#555511, BD Bioscience) for 30 min at room temperature. After staining, cells were washed three times with staining buffer and fixed with True-Nuclear 1X Fix Concentrate (True Nuclear Transcription Factor Buffer Set, #424401, Biolegend) at room temperature in the dark for 60 min. After washing twice with staining buffer, cells were permeabilized with True-Nuclear 1X Perm Buffer Concentrate (True Nuclear Transcription Factor Buffer Set, #424401, Biolegend) for 20min in the dark at room temperature. Cell pellets were then resuspended in 100uL True-Nuclear 1X Perm Buffer containing 1:800 LMP-1 Antibody (SC71023, Santa Cruz) conjugated with alexafluor647 (a generous gift from Dr. Kottyan) and incubated in the dark for 45 minutes. Cells were the washed with staining buffer twice and subjected to the flow cytometry.
Cell cycle analysis
GM12878 cells were transduced with lentiviruses expressing V5-tagged GFP, DNMT3A, or DNMT3B and selected by Hygromycin. Cells were then collected at day10 post lentivirus transduction and fixed in 70% ethanol overnight. For cell cycle analysis, fixed cells were treated with Staining Buffer (Propidium Iodide, 5μg/ml; RNase A, 40μg/ml; 0.1% Triton X-100; PBS) for 30 minutes at room temperature and analyzed by FACS. The FACS data were further analyzed with FlowJo V10.
Cell Number assay
Cell number was quantified by CellTiter-Glo (CTG, Promega) live cell assay as described previously63. Normalized cell growths for cell growth curves were calculated by normalizing CTG values of the samples at different time points to the CTG values of the same samples at the starting time point (i.e., day 1).
Chromatin immunoprecipitation (ChIP)
Cells were fixed with 1% formaldehyde for each ChIP assay. Then, cells were lysed by incubation with lysis buffer (50 mM HEPES-KOH, 150 mM NaCl, 1 mM EDTA, 1% Triton X-100, 0.1% sodium deoxycholate, and 1% SDS). Chromatin were resuspended using FA lysis buffer (50 mM HEPES-KOH, 150 mM NaCl, 1 mM EDTA, 1% Triton X-100, 0.1% sodium deoxycholate, and 0.1% SDS) and fragmented by an ultra-sonication processor (Diagenode, USA). The soluble chromatin was diluted and incubated with 5-μg corresponding antibodies (Reporting Summary). Specific immunocomplexes were precipitated with protein A or G beads. Beads were extensively washed. After reverse cross-linking, DNA was purified by using QIAquick PCR purification kit (Qiagen). qPCR quantified the DNA from ChIP assay and normalized it to the percent of input DNA. Primers for qPCR are listed in Supplementary Information.
Methylated DNA immunoprecipitation assay (MeDIP)
Genomic DNA was purified using the Blood and Cell Culture DNA Mini Kit (Qiagen) and then subjected to methylcytidine-DNA immunoprecipitation (MeDIP) using the MagMeDIP kit (C02010021; Diagenode). qPCR assays were then performed as described above. Primers for qPCR are listed in Supplementary Information.
Quantitative real time (qRT)-PCR
Total RNA was harvested from cells or xenograft tumors using RNeasy Mini Kit (Qiagen). Genomic DNA was removed by using the RNase-Free DNase Set (Qiagen). qRT-PCR was performed using Power SYBR Green RNA-to-CT 1-Step Kit (Applied Biosystems) on a CFX96 Touch™ Real-Time PCR Detection System (Bio-Rad), and data were normalized to internal control 18S rRNA. Relative expression was calculated using 2-ΔΔCt method. All samples were run in technical triplicates and at least three independent experiments were performed. The primer sequences were listed in Supplementary Information. Primers for detecting C, Q, LMP, or LMP promotors were described periously64.
RNAseq analysis
Total RNA from cells expressing control or UHRF1 sgRNA were isolated using the RNeasy Mini kit (Qiagen) following the manufacturer’s manual. An in-column DNA digestion step was included to remove the residual genomic DNA contamination. To construct indexed libraries, 1 μg of total RNA was used for polyA mRNA-selection, using NEBNext Poly(A) mRNA Magnetic Isolation Module (New England Biolabs), followed by library construction via NEBNext Ultra RNA Library Prep Kit for Illumina (New England Biolabs). Each experimental treatment was performed in triplicate. Libraries were multi-indexed, pooled and sequenced on an Illumina NextSeq 500 sequencer using single-end 75 bp reads (Illunima).
Adaptor-trimmed Illumina reads for each individual library were mapped back to the human GRCh37.83 transcriptome assembly using STAR2.5.2b65. Feature Counts was used to estimate the number of reads mapped to each contig66. Only transcripts with at least 5 cumulative mapping counts were used in this analysis. DESeq2 was used to evaluate differential expression (DE)67. DESeq2 uses a negative binomial distribution to account for overdispersion in transcriptome datasets. It is conservative and uses a heuristic approach to detect outliers while avoiding false positives. Each DE analysis was composed of a pairwise comparison between experimental group and the control group. Differentially expressed genes were identified after a correction for false discovery rate (FDR). For more stringent analyses, we set the cutoff for truly differentially expressed genes as adjusted p value (FDR corrected) < 0.05 and absolute fold change > 2.
The volcano plots were built based on the log2(foldchange) at x-axis and -log10(p-Value) at y-axis with Graphpad Prism7. The principle component analysis was performed using prcomp() function and visualized with ggplot2 (version 3.2.1) in R-3.5.2. Heatmap was generated by feeding the Z-score values of selected EBV genes from DESeq2 into Morpheus(https://software.broadinstitute.org/morpheus/). Enrichr was employed to perform gene list-based gene set enrichment analysis on selected gene subset. Consistent enriched gene sets in Top 20 terms ranked by Enrichr adjusted p-value were visualized Graphpad Prism 7. The algorithm to calculate the combined score is explicitly described previously68.
Statistical analysis
The statistical significance of CRISPR screen hits was calculated using the STARSs algorithm v1.323. Multiple hypothesis testing was adjusted using the Benjamini-Hochberg method with false discovery rate < 0.05 to filter significant screen hits. STARs was used to compare sgRNA abundances in the MUTU I B cell library prior to FACS sort with levels in the corresponding sorted populations. Thus, sgRNA abundances in the sorted population were compared to the input library levels. Gene ontology analysis was used the Enrichr module using the KEGG pathway databases68. Default parameters of Enrichr module was used, with the exception that the Enrichment statistic was set as classic.
Unless otherwise indicated, all bar graphs and line graphs represent the arithmetic mean of three biologically independent experiments (n = 3), with error bars denoting standard deviations. Data were analyzed using two-tailed paired Student t test or analysis of variance (ANOVA) with the appropriate post-test using GraphPad Prism7 software. P values were shown in each figure.
Confocal microscopy
Cells were seeded on glass slides in phosphate buffered saline (PBS), allowed to air dry and then fixed with 4% paraformaldehyde (PFA) in PBS for 10 minutes. PFA was removed and fixed cells were permeabilized with 0.1% Triton-X in PBS. Slides were then blocked with 1% IgG-free BSA (A2058, Sigma-Aldrich) in PBS for 30min at room temperature. Subsequently, cells were incubated with primary antibodies against LMP1 (the monoclonal antibody OT-21C, a gift from Dr. Richard Longnecker, 1:1000) and LMP2A (ab59028, Abcam, 1:200) or EBNA2 (PE2, a gift from Dr. Elliot Keiff) in PBS containing 1% BSA for 1 hour at 37°C. Slides were then washed three times and then incubated with secondary antibodies (Alexa Fluor 488-conjugated goat antimouse and/or Alex Fluor 594-conjugated goat anti-rabbit diluted 1:250 in PBS) for 1 hour at 37°C. Finally, slides were washed three times in PBS and incubated with 100 uL of Hoechst 33258 staining buffer (10 μg/mL in PBS) for 10 minutes to stain nuclear DNA. Cells were then washed three times with PBS. ProLong Gold anti-fade reagent was applied to the slide, which was then sealed with a No. 1.5 coverslip. Image acquisition was performed with the Zeiss LSM 800 instrument. Image analysis was performed with the Zeiss ZEN Blue software.
Primary Human B-cells.
Discarded, de-identified leukocyte fractions left over from platelet donations were obtained from the Brigham and Women’s Hospital Blood Bank. Blood cells were collected from platelet donors following institutional guidelines. Since these were de-identified samples, the gender was unknown. Our studies on primary human blood cells were approved by the Brigham & Women’s Hospital Institutional Review Board. Primary human B cells were isolated by negative selection using RosetteSep Human B Cell Enrichment and EasySep Human B cell enrichment kits (Stem Cell Technologies), according to the manufacturers’ protocols. B cell purity was confirmed by plasma membrane CD19 positivity through FACS. Cells were then cultured with RPMI 1640 with 10% FCS. Freshly isolated primary B-cells were seeded in complete RPMI media and 10% FBS at 1 million cells per mL. The following agonists were used at these concentrations: Mega CD40L (Enzo Life Sciences, Cat#ALX-522–110-C010 50 ng/mL), CpG (Integrated DNA Technologies, CpG ODN 2006, 0.5 μM), goat anti-human IgM 1 μg/ml (Sigma Cat# I0759) or combinations thereof, as indicated. Cells were harvested at 24 hours for whole cell lysate preparation. Acyclovir (APExBio Cat#A8644) was used at 50 ug/ml.
Graphics
Figures were drawn with GraphPad, Biorender, Microsoft Powerpoint, and ggplot2 in R.
Data availability
CRISPR screen results are available in Extended Data Table 2. The accession numbers for RNA-seq datasets reported in this paper are NIH GEO GSE136596, GSE136597, and GSE136609. Published microarray analysis53 of human tonsil B-cell naïve, GC, memory or plasma cell subsets were also used and are available at NIH GEO accession number GSE24919. The data that support the findings of this study are available from the corresponding author upon request.
Extended Data
Extended Data Fig. 1. Genome-wide CRISPR-Cas9 Mediated Loss-of-Function Screen Identifies UHRF1 and DNMT1 as candidate regulators of EBV Latency III.
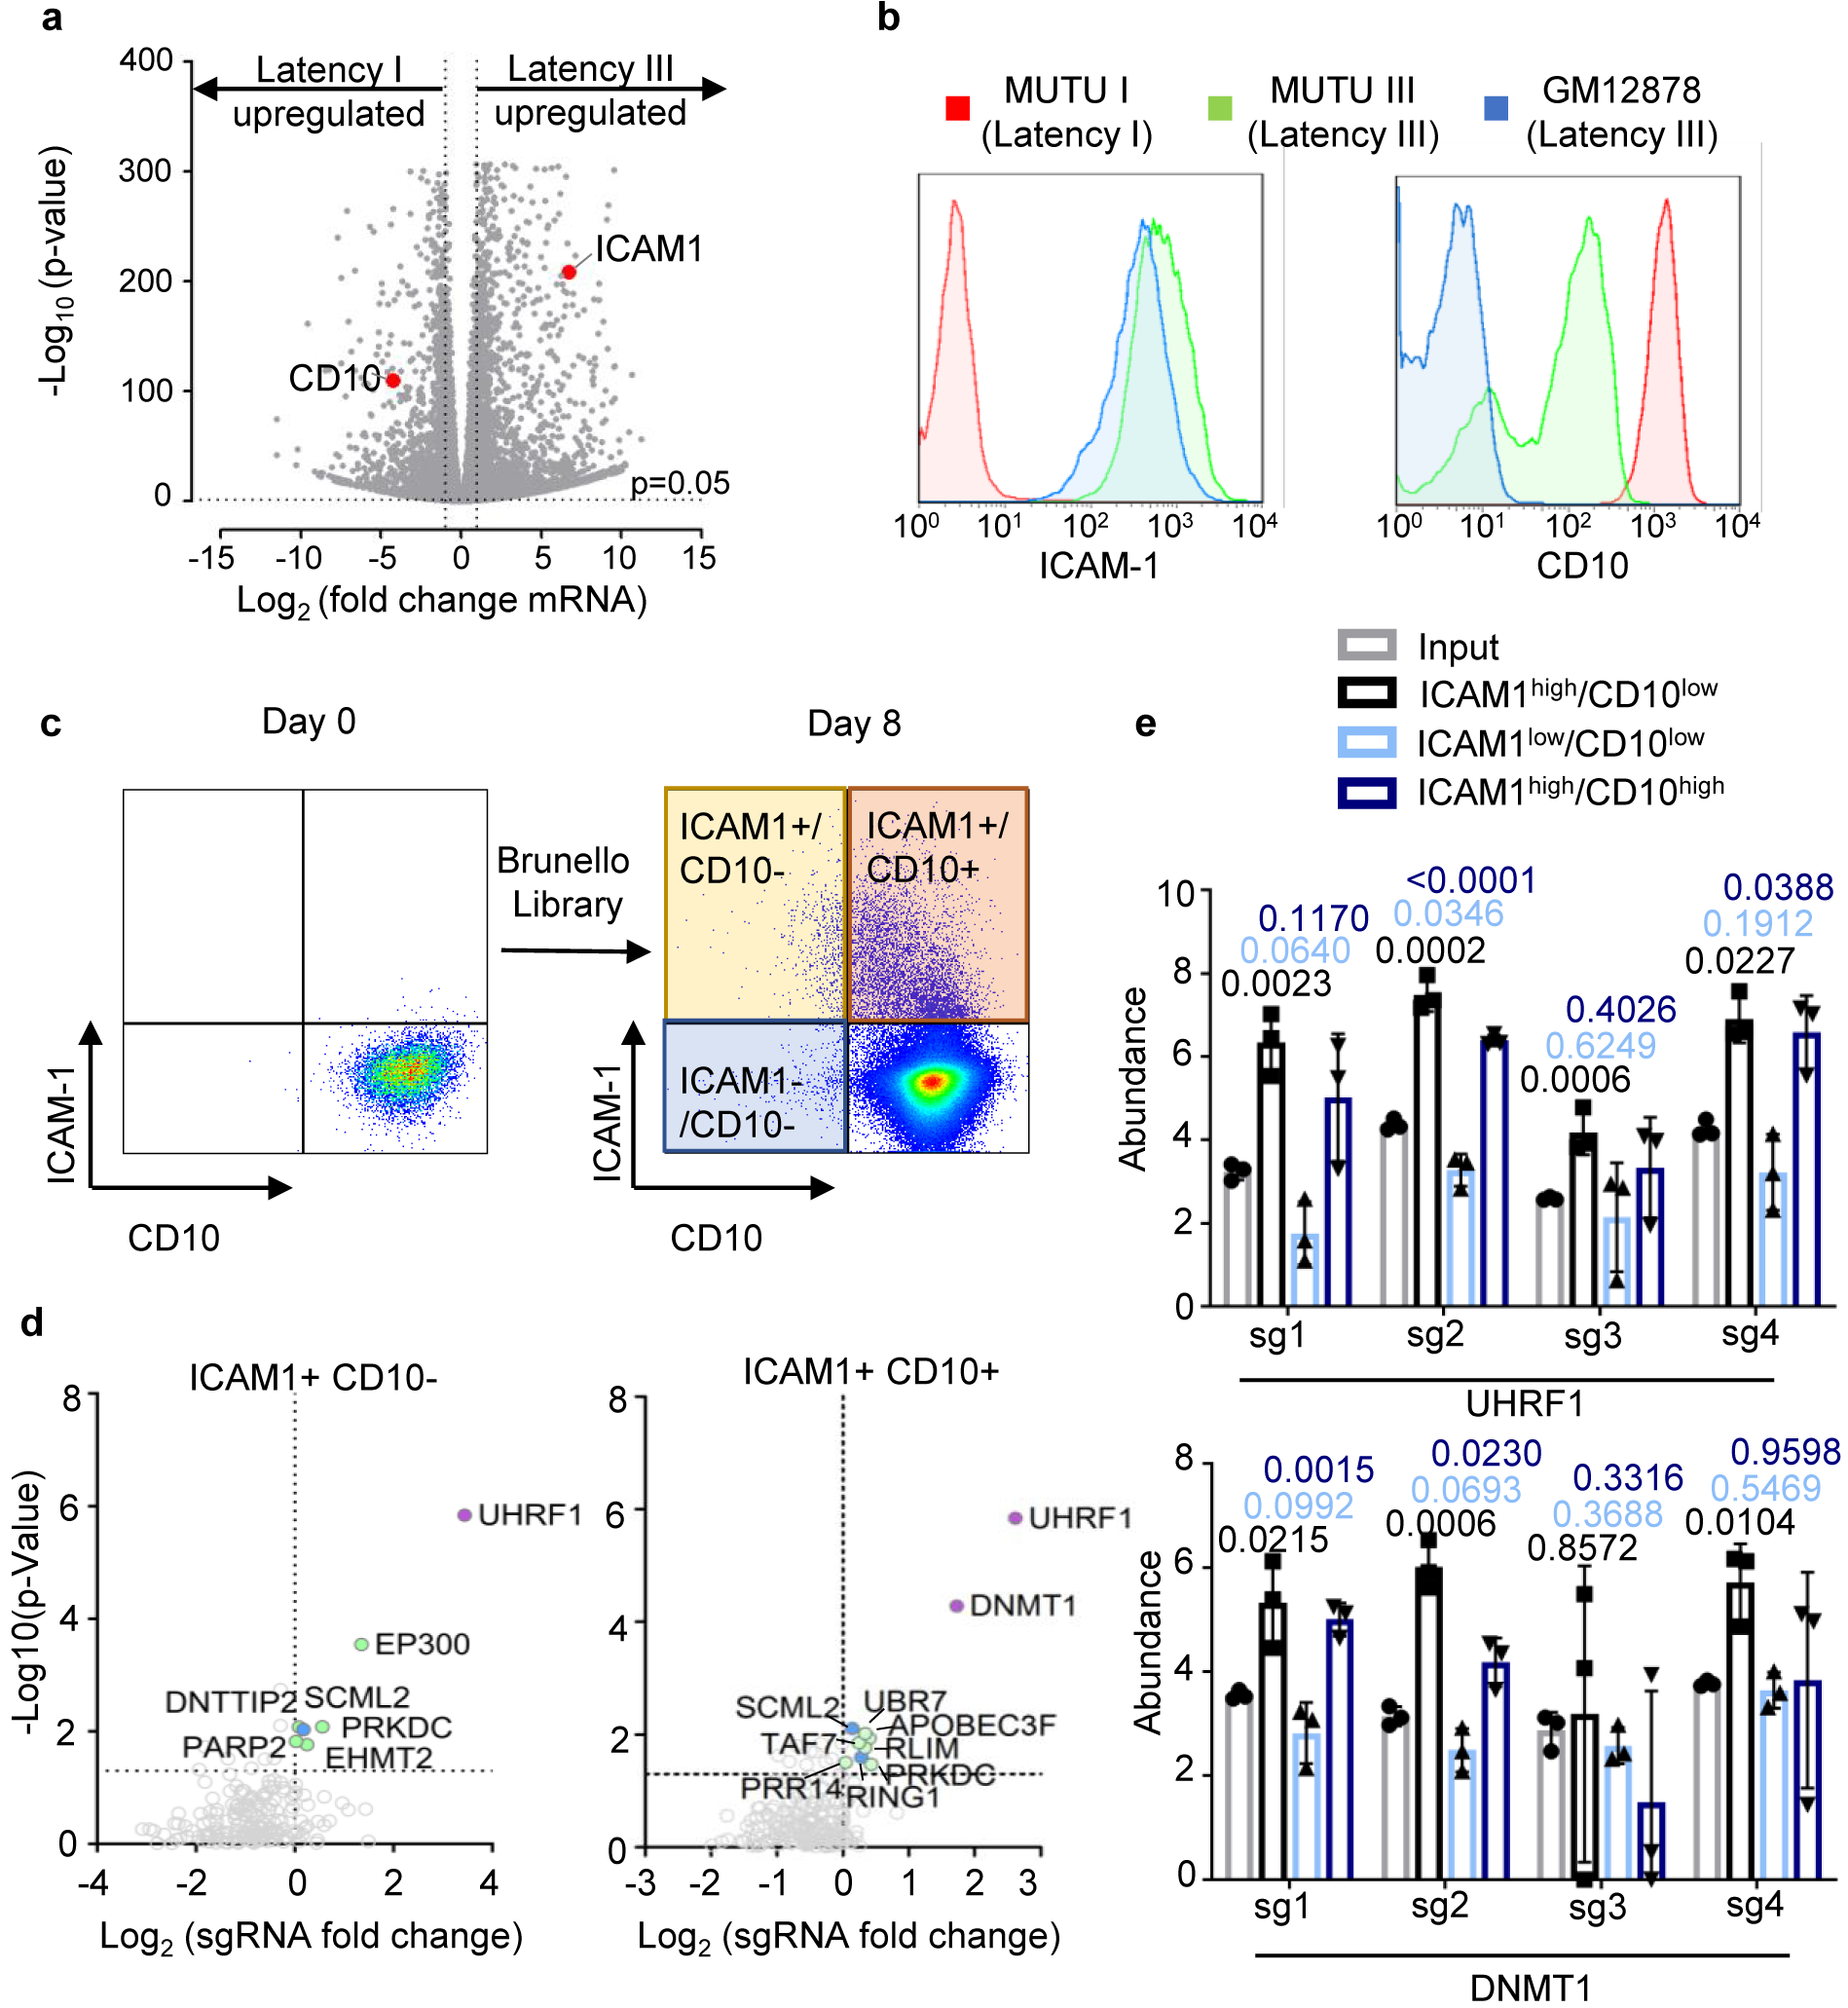
a, Volcano plot visualization of -Log10(p-value) statistical significance (y-axis) and Log2 fold-change in mRNA abundance (x-axis) of MUTU III versus MUTU I cells from triplicate RNA-seq datasets. ICAM-1 and CD10 (encoded by MME) are highlighted by red dots. n=3 biologically independent replicates. P-value and log fold change were generated with DESeq under default settings with Wald test and normal shrinkage, respectively
b, Plasma membrane ICAM-1 (left) and CD10 (right) abundances in MUTU1 (red), MUTU III (green) and GM12878 LCLs. Plots are representative of n=3 biologically independent values.
c, FACS plots of plasma membrane ICAM-1 and CD10 abundances in MUTU I cells prior to and at 8 days following transduction by the Brunello sgRNA library. Transduced cells were puromycin selected two days post-transduction. Plots are representative of n=3 biologically independent values.
d, Volcano plot of CRISPR screen results for genes encoding host epigenetic factors in the ICAM-1high/CD10low and ICAM-1high/CD10high subpopulations, using the curated EpiFactors database69. Plots are representative of n=3 biologically independent values. P-values were determined by one-sided Fisher’s exact test.
e, Log2-normalized abundance of the four Brunello library sgRNAs targeting UHRF1 or DNMT1 in the input (pre-FACSort) library (gray), ICAM-1high/CD10 low population (black), ICAM-low/CD10low (light blue), and ICAM-1high/CD10high (dark blue). Significance between the input and FACSorted groups was assessed using the two-sided unpaired Student’s t test. Mean + SD from n=3 biologically independent screens is shown.
Extended Data Fig. 2. Dynamic primary B-cell UHRF1 and DNMT1 regulation by physiological or EBV stimuli.
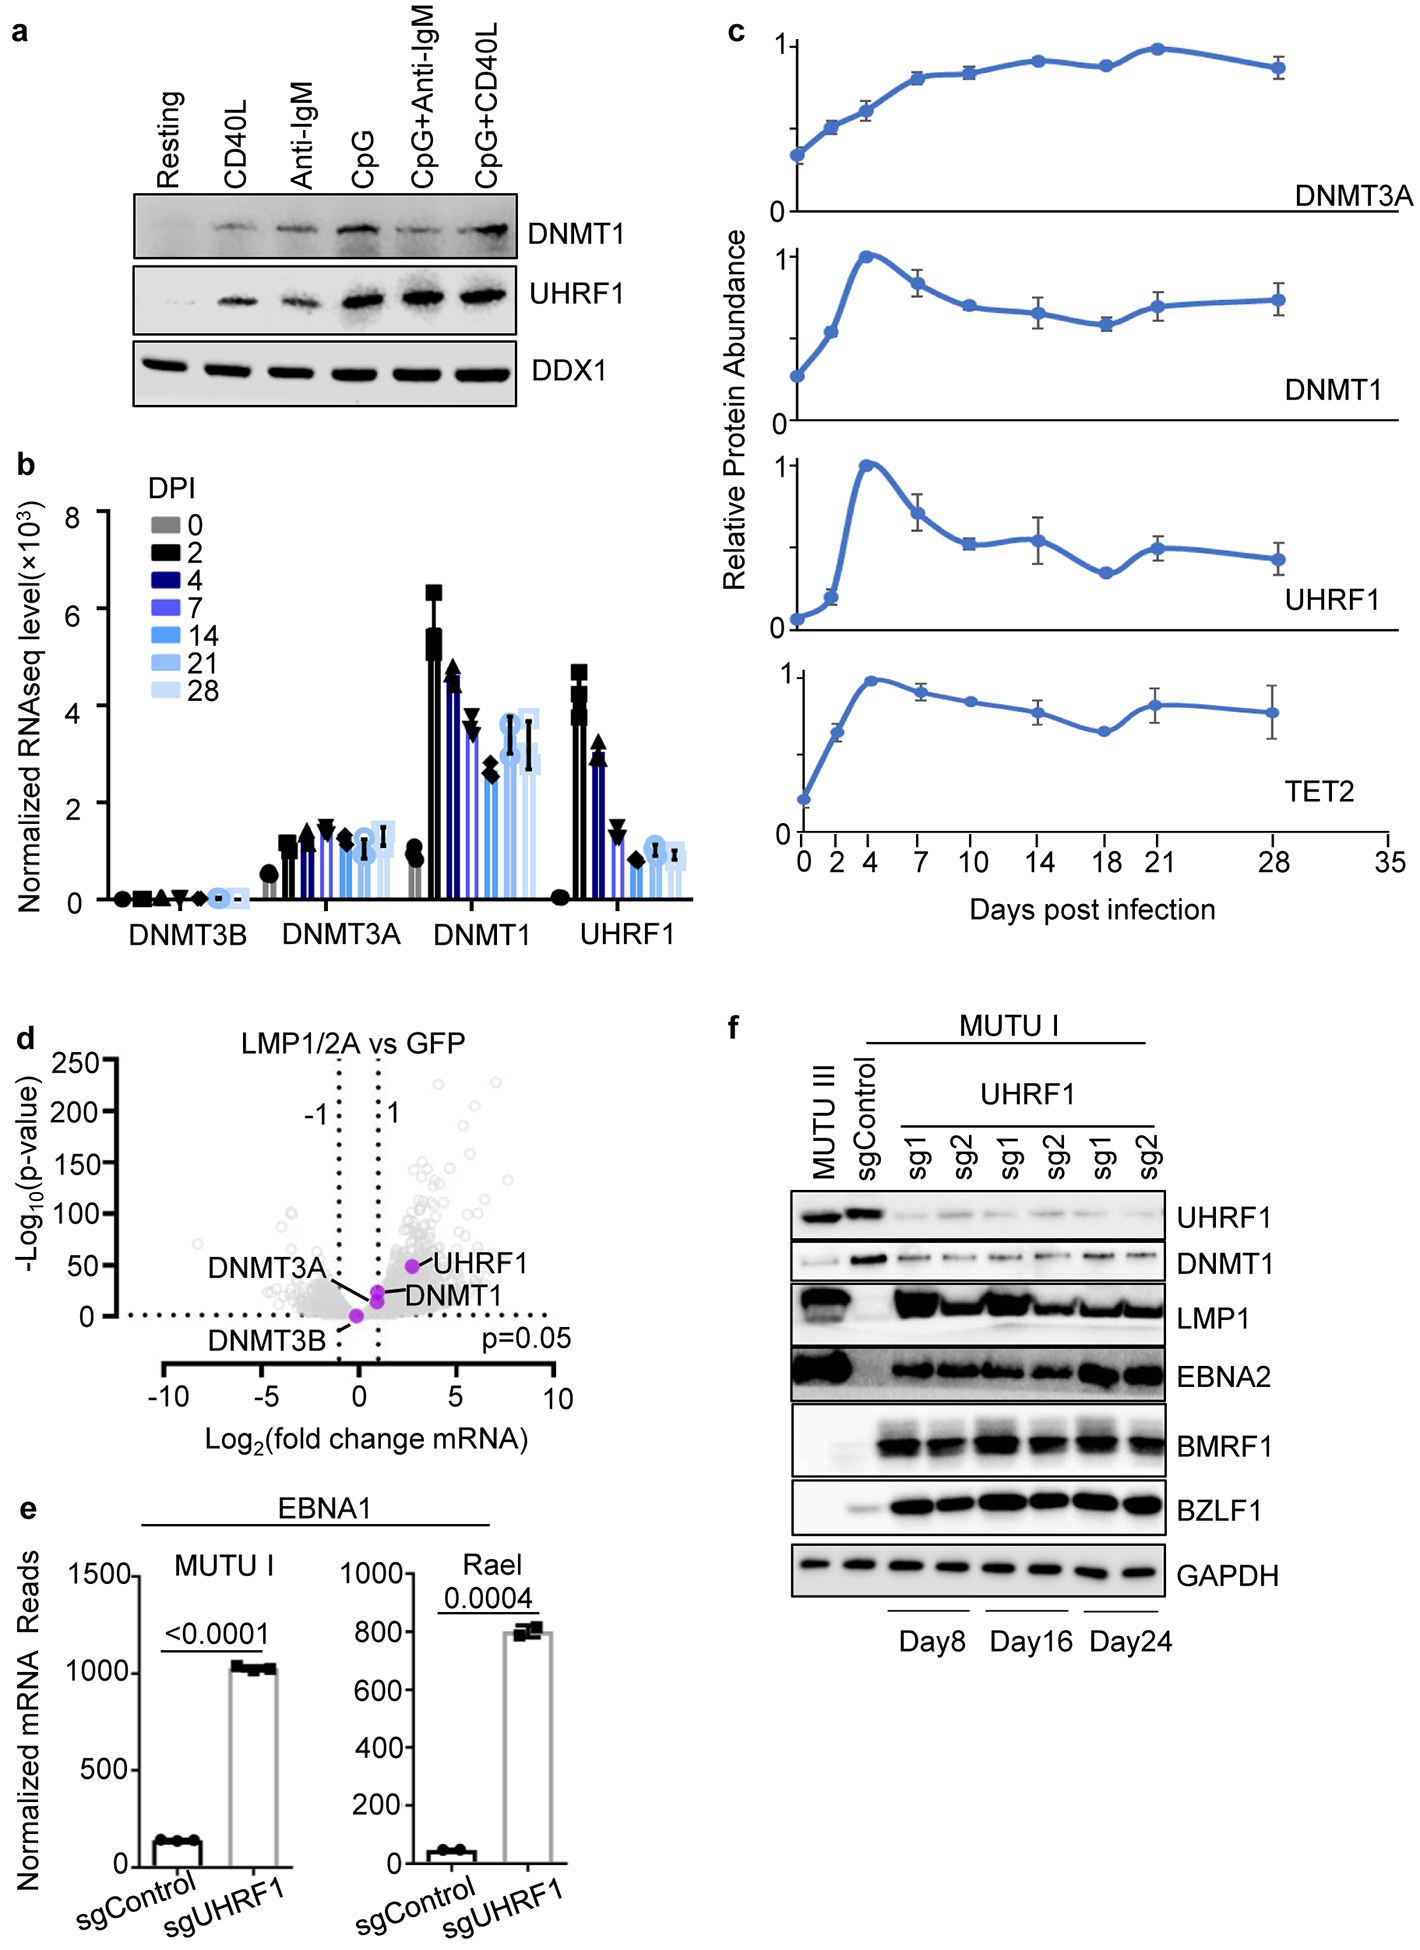
a, Immunoblot of WCL from peripheral blood primary human B-cells that were resting or that were stimulated by Mega-CD40L (50 ng/ml), anti-IgM (1 μg/ml), CpG (0.5 μM), IgM+ CpG or CD40 + CpG for 24 hours.
b, Normalized DNMT3B, DNMT3A, DNMT1 or UHRF1 mRNA levels in primary human peripheral blood B-cells at the indicated day post infection (DPI) by the EBV B95.8 strain32. Shown are the mean + SEM values from n=3 of biologically independent RNAseq datasets.
c, UHRF1, DNMT1, DNMT3A and TET2 relative protein abundances detected by tandem-mass-tag-based proteomics at rest and at nine time points after EBV B95.8 infection of primary human peripheral blood B-cells at a multiplicity of infection of 0.1. DNMT3B expression was not detected. Data represent the average +/− SEM for four independent replicates8. For each protein, the maximum level detected across the time course was set to a value of one.
d, Volcano plot visualization of -Log10 (p-value) statistical significance (y-axis) and Log2 fold-change in mRNA abundance (x-axis) of ex vivo GC B-cells that conditionally expressed control GFP or both LMP1 and LMP2A from an AICDA promoter, which is activated in GC B-cells. Data are from n=3 of biologically independent RNA-seq datasets34. P-value and log fold change were generated with DESeq under default settings with Wald test and Normal shrinkage, respectively. UHRF1, DNMT1, DNMT3A and DNMT3B values are highlighted.
e, Normalized EBNA1 mRNA reads from RNAseq analysis of MUTU I (n=3) or Rael cells (n=2) that expressed control or UHRF1 sgRNAs, as indicated. p-values were calculated by unpaired two-sided student’s t-test with equal variance assumption.
f, Immunoblot analysis of WCL from MUTU III or from MUTU I that expressed the indicated control or UHRF1 sgRNAs. Cells were harvested at the indicated day post sgRNA delivery by lentivirus transduction.
Blots in a and f are representative of n=3 biologically independent replicates.
Extended Data Fig. 3. UHRF1 is necessary for silencing of latency III antigen expression.
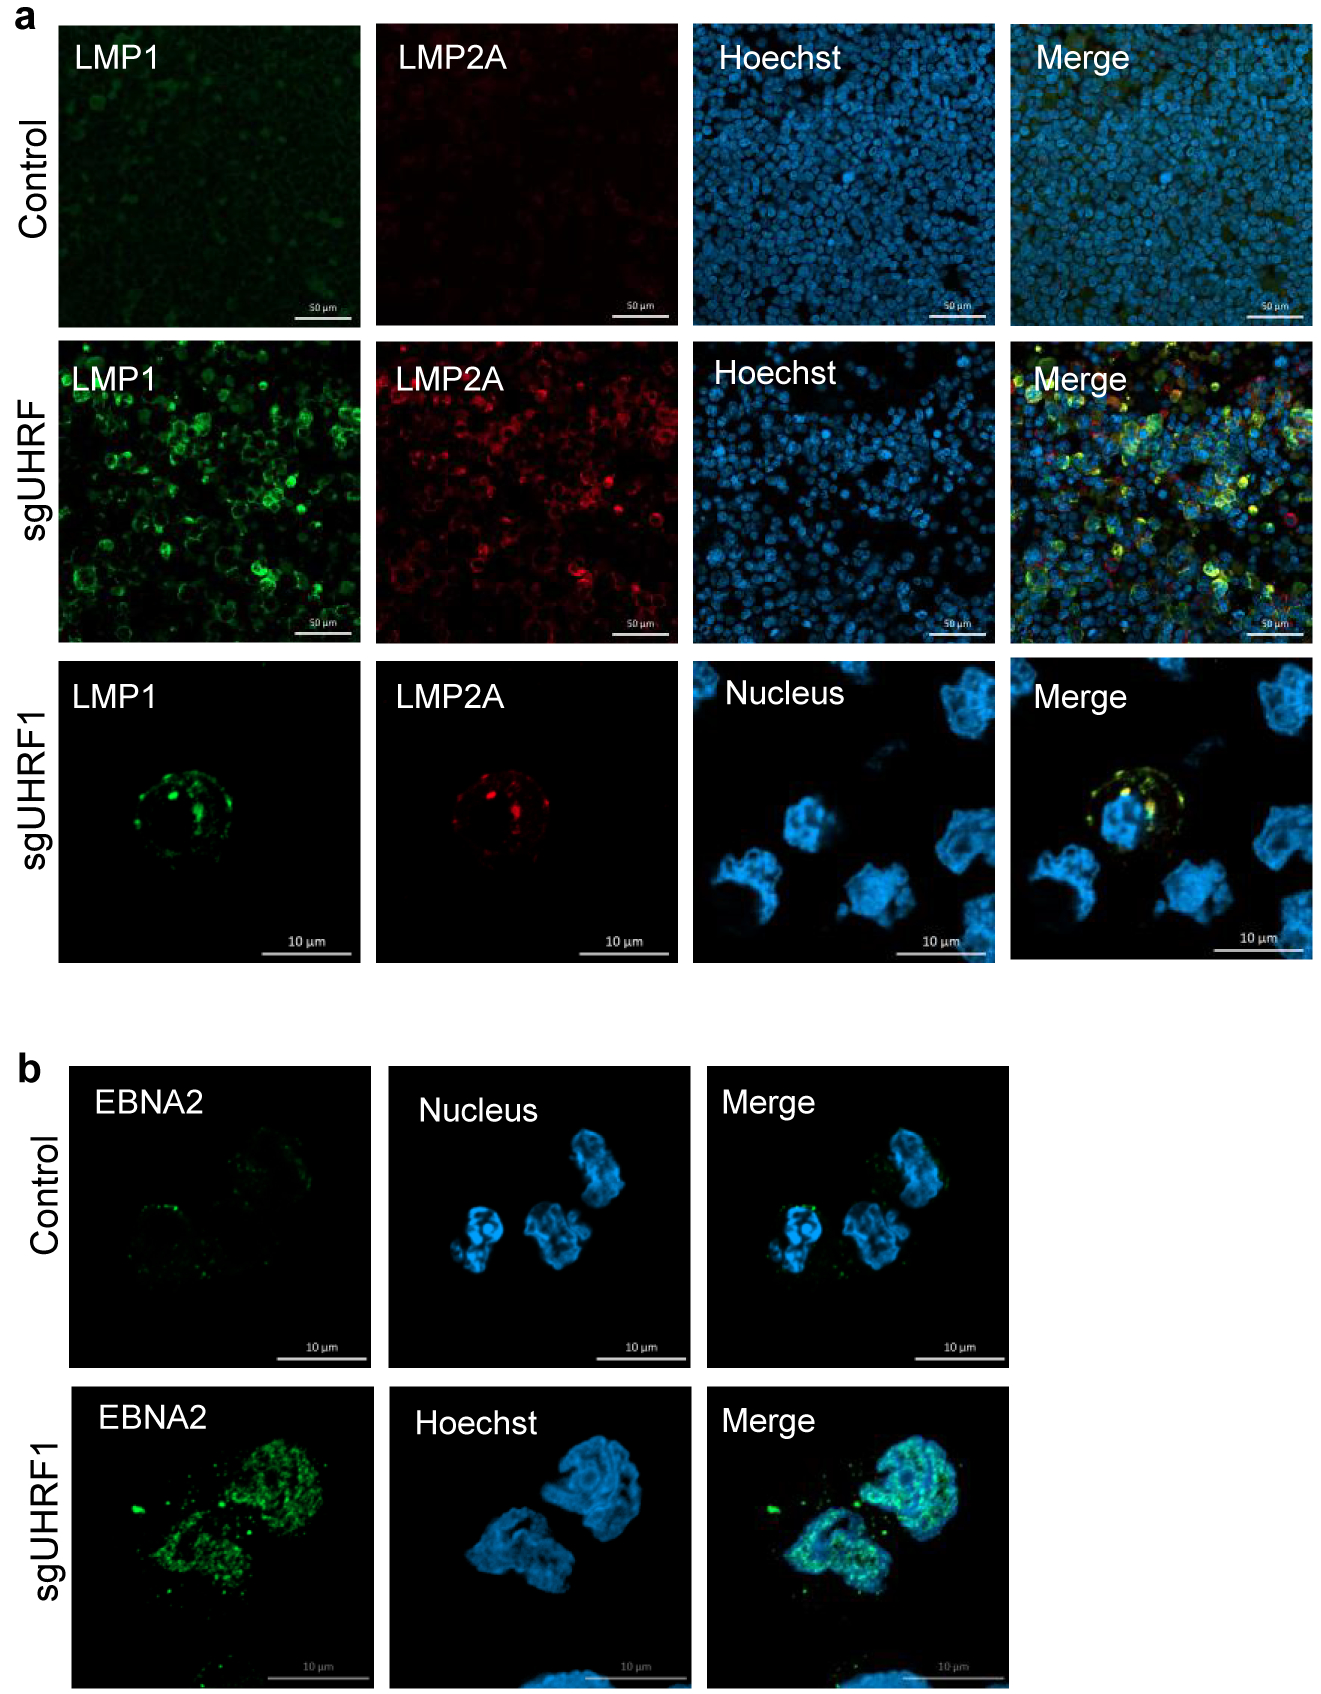
a, Confocal immunofluoresence analysis of LMP1 or LMP2A in Rael cells with control or UHRF1 sgRNAs. Nuclei are counterstained with Hoechst 33342. Scale bar, 10μm. Images are representative of n=3 biologically independent experiments.
b, Confocal immunofluoresence analysis of EBNA2 in Rael cells with control or UHRF1 sgRNAs. Nuclei are counterstained with Hoechst 33342. Scale bar, 10μm. Images are representative of n=3 biologically independent experiments.
Extended Data Fig. 4. UHRF1 depletion induces latency III and induces ICAM-1 in EBV+ but not EBV- B-cells.
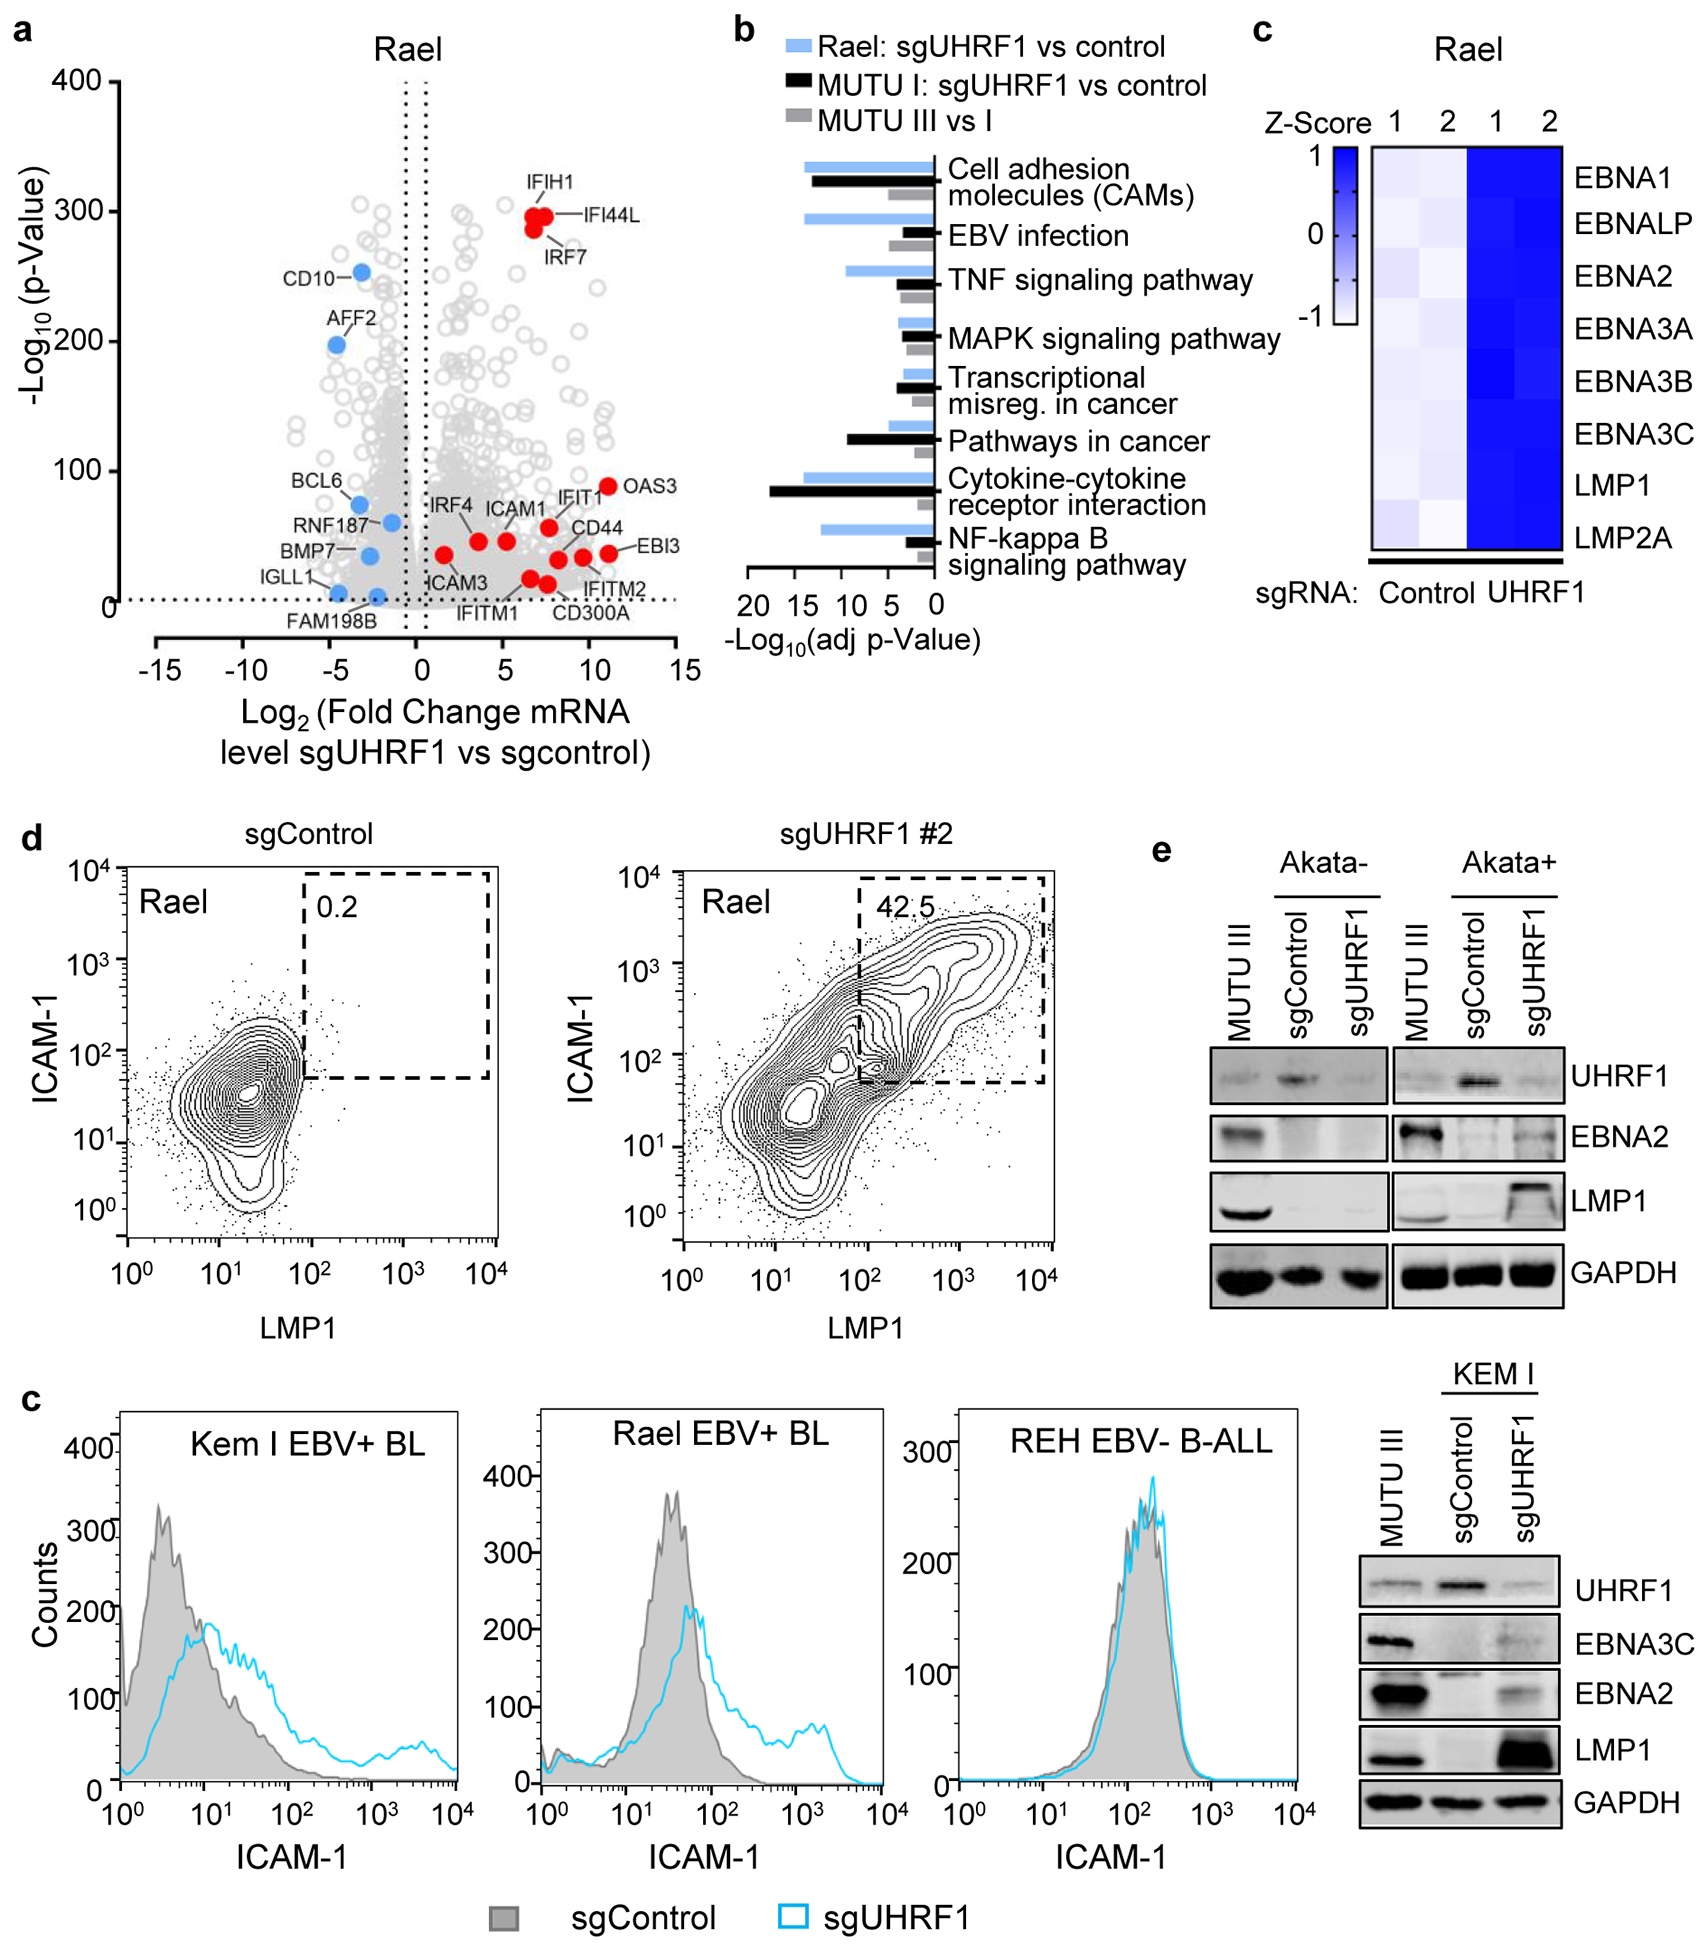
a, Volcano plot visualization of -Log10 (p-value) statistical significance (y-axis) and Log 2 (fold-change in mRNA abundance) in Rael cells that expressed control or UHRF1 sgRNAs. Data are from n=2 of biologically independent RNA-seq datasets. P-value and log fold change were generated with DESeq under default settings with Wald test and Normal shrinkage, respectively. Values for selected genes upregulated (red) or downregulated (blue) by UHRF1 sgRNA are highlighted.
b, Enrichr pathway analysis of gene sets significantly upregulated in MUTU III versus MUTU I (gray bars), or by UHRF1 versus control sgRNA expression in MUTU I (black bars) or Rael (blue bars). Shown are the adjusted p-values from Enrich analysis of triplicate RNAseq datasets using Fisher exact test. See alsoExtended Data Table 5.
c, Heatmap representation of abundances of mRNAs encoding latency III antigens in Rael BL with control or UHRF1 sgRNAs. Shown are data from n=2 biologically independent replicates.
d, FACS analysis of total cell ICAM-1 and LMP1 expression in Rael cells with control (left) or UHRF1 sgRNA #2 (right).
e, Immunoblot analysis of WCL from EBV- (left) or EBV+ Akata BLs with the indicated sgRNA expression.
f, FACS analysis of plasma membrane ICAM-1 expression in the indicated cell lines with control or UHRF1 sgRNA #2 expression. KEM I and Rael are EBV+ BL. REH is an EBV-negative B-cell acute lymphoblastic leukemia cell line. Shown below are immunoblots of WCL from KEM I BLs with the indicated sgRNA expression.
All FACS plots and blots are representative of n=3 biologically independent replicates.
Extended Data Fig. 5. MeDIP analysis of promoter CpG methylation in LCLs or in CRISPR edited BL treated with acyclovir.
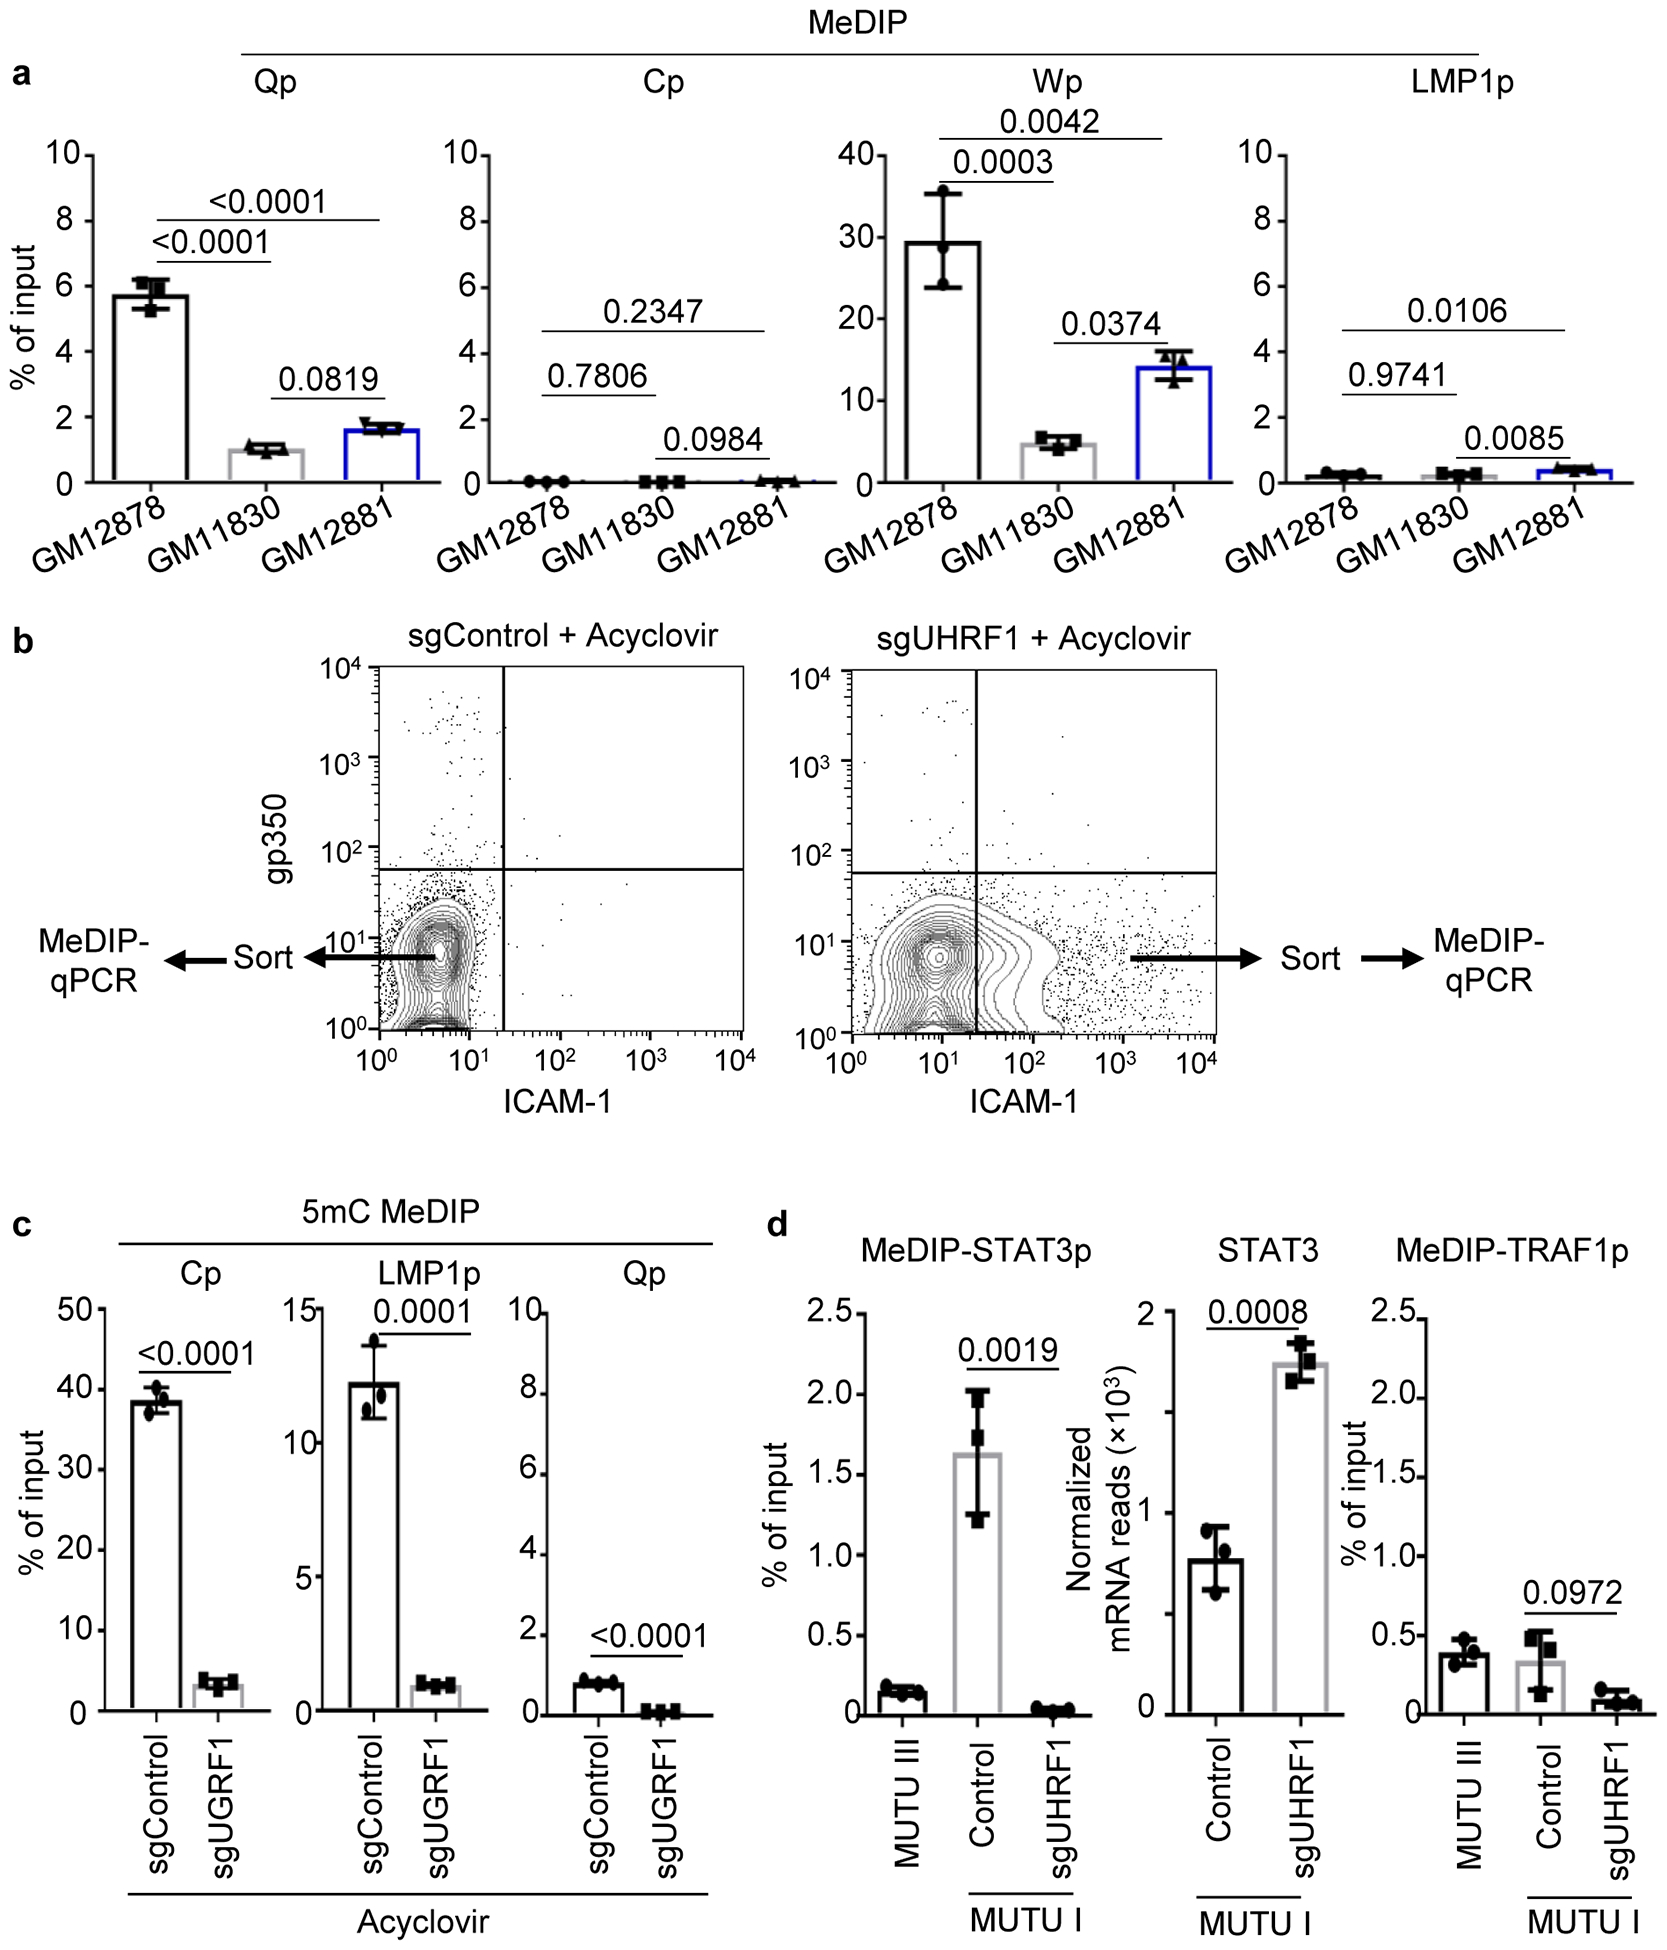
a. 5 mC MeDIP was performed on DNA from GM12878 (black bars), GM11830 (gray bars) or GM12881 LCLs (blue bars) followed by qPCR for the Qp, Cp, Wp or LMP1p. Mean ± SEM for n=3 of biologically independent replicates are shown. p-values were calculated using two-way ANOVA with Turkey’s multiple comparisons test.
b, FACS plots of PM gp350 and ICAM-1 abundances in MUTU I cells that expressed the indicated sgRNAs and that were treated with acyclovir (50 μg/ml) to block new EBV genome synthesis by the viral polymerase. The indicated populations from sgControl versus sgUHRF1 expressing cells were sorted and used for 5 mC MeDIP-qPCR analysis. n=3 biologically independent experiments.
c, 5 mC MeDIP was performed on chromatin from sorted sgControl (black bars) or sgUHRF1 (gray bars) followed by qPCR for Cp, Wp or Qp. Mean ± SEM for n=3 biologically independent replicates are shown. p-values were calculated by unpaired two-sided student’s t-test with equal variance assumption.
d, 5 mC MeDIP was performed on chromatin from sorted sgControl (black bars) or sgUHRF1 (gray bars) followed by qPCR for the host STAT3 or TRAF1 promoters (n=3 of biologically independent experiments). Shown also are normalized mRNA reads from n=3 of biologically independent RNAseq datasets of MUTU I expressing control or UHRF1 sgRNAs. p-values were calculated by unpaired two-sided student’s t-test with equal variance assumption.
Extended Data Fig. 6. UHRF1 depletion induced lytic reactivation in a small percentage of cells.
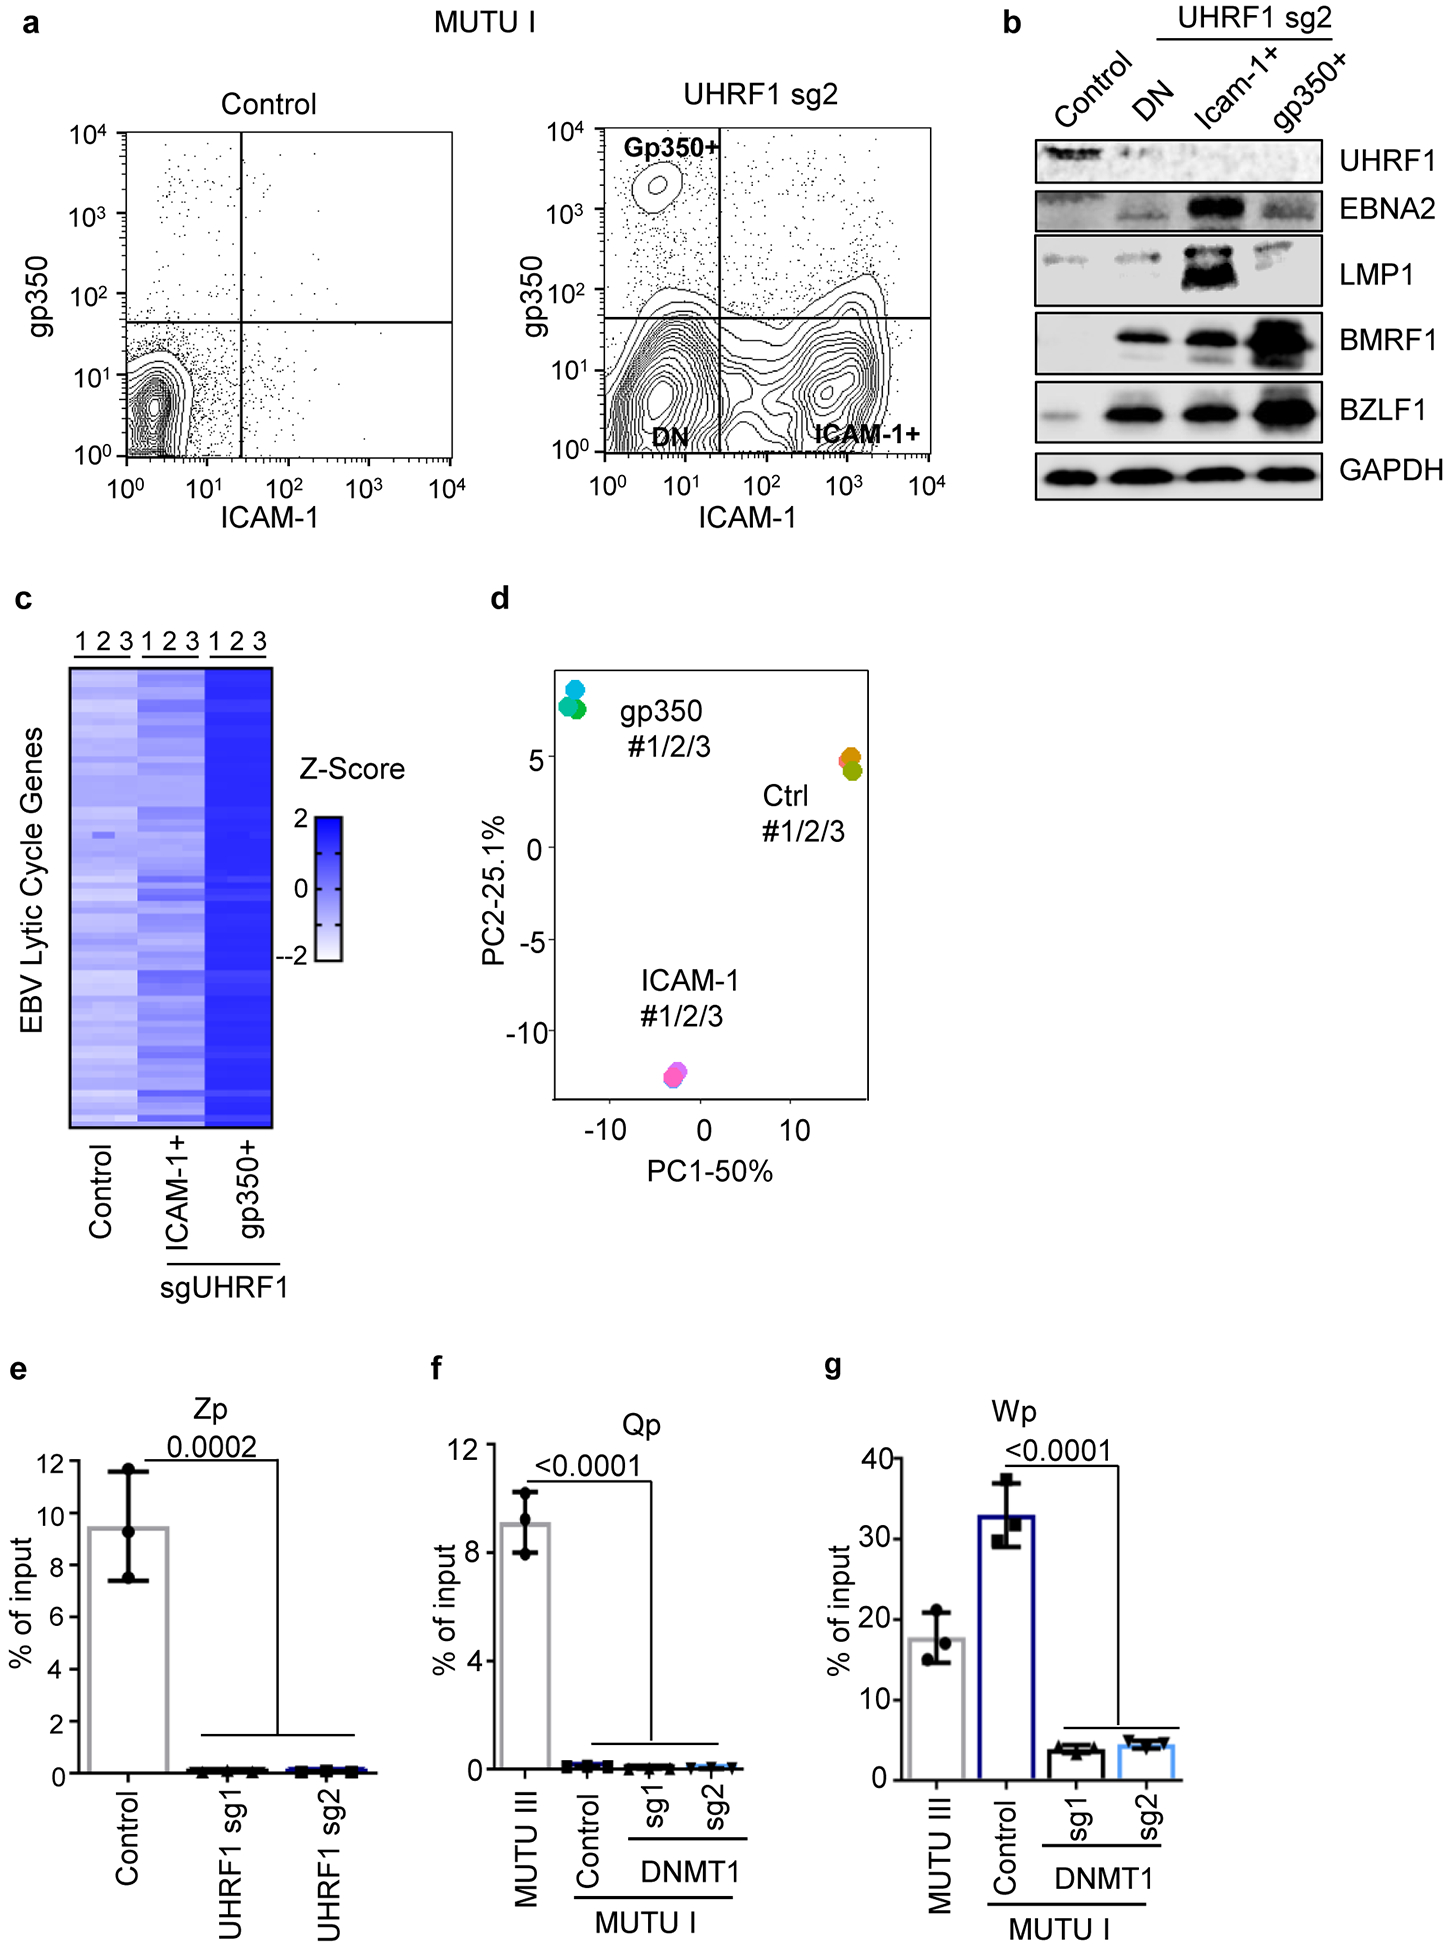
a, FACS analysis of ICAM-1 and gp350 plasma membrane abundances in MUTU I cells with control or UHRF1 sgRNAs. DN = double negative. Plots are representative of n=3 biologically independent replicates.
b, Immunoblot analysis of WCL from the indicated populations of FACSorted MUTU I cells, representative of n=3 biologically independent replicates.
c, Heatmap of EBV gene expression in the indicated FACSorted MUTU I populations. Heatmap values displace Z-score values of mRNAs of EBV lytic genes, which describe the standard deviation variation from the mean value of each gene. Individual data from n=3 biologically independent samples are shown.
d, Principal component (PC) analysis of mRNA expression in sorted MUTU I populations. RNAseq of n=3 biologically independent replicates was performed.
e-g 5 mC MeDIP was performed on chromatin isolated from MUTU I cells followed by qPCR using primers specific for Zp (e), Qp (f), or Wp (g). Mean ± SEM are shown for n=3 biologically independent replicates. p-values were calculated using one-way ANOVA with Sidak’s multiple comparisons test.
Extended Data Fig. 7. Effects of UHRF1 or DNMT1 depletion in EBV+ primary effusion lymphoma, gastric carcinoma or nasopharyngeal carcinoma cells.
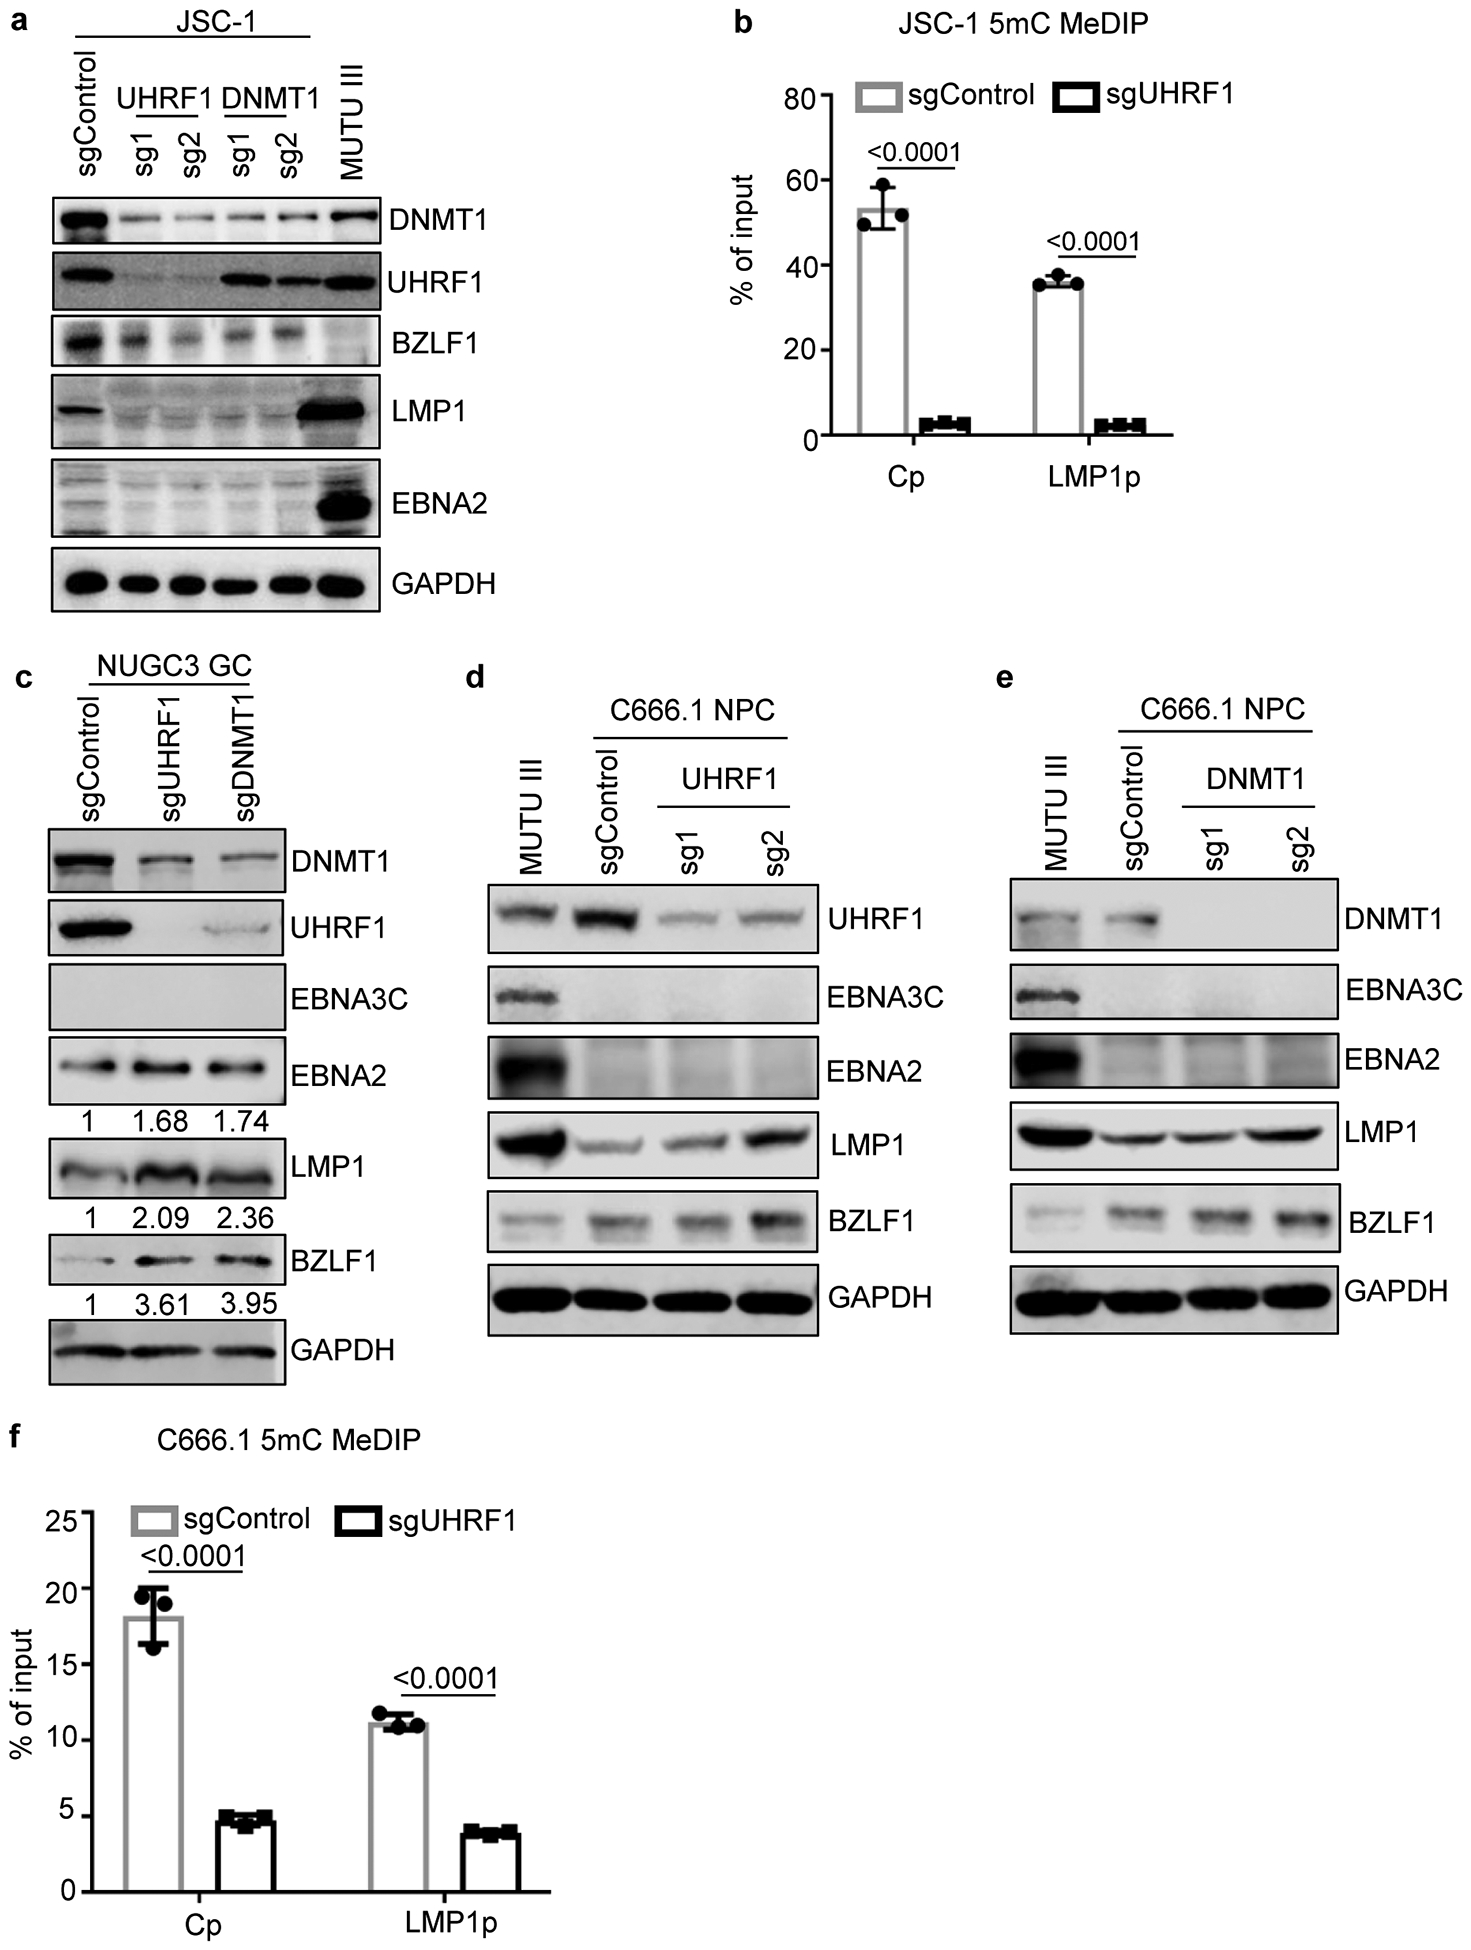
a, Immunoblot analysis of WCL from EBV+ and KSHV+ primary effusion cell line JSC-1 that expressed the indicated control, UHRF1 or DNMT1 sgRNAs or from MUTU III WCL as a control.
b, 5 mC MeDIP analysis of chromatin from JSC-1 expressing control or UHRF1 sgRNA #2 followed by qPCR using primers specific for Cp or LMP1p. Mean ± SEM are shown for n=3 biologically independent replicates. p-values were calculated by unpaired two-sided student’s t-test with equal variance assumption.
c, Immunoblot analysis of WCL from EBV+ NUGC3 gastric carcinoma cells that expressed the indicated sgRNAs. Quantification of EBNA2:GAPDH and LMP1:GAPDH ratios are indicated.
d, Immunoblot analysis of WCL from EBV+ C666.1 nasopharyngeal carcinoma (NPC) cells that expressed the indicated control or UHRF1 sgRNAs or from MUTU III as a control.
e, Immunoblot analysis of WCL from EBV+ C666.1 nasopharyngeal carcinoma (NPC) cells that expressed the indicated control or DNMT1 sgRNAs or from MUTU III as a control.
f, 5mC MeDIP analysis of chromatin from C666.1 cells that expressed sgControl (gray boxes) or sgUHRF1 (black boxes) followed by qPCR using primers specific for Cp or LMP1p. Mean ± SEM are shown for n=3 biologically independent replicates. p-values were calculated by unpaired two-sided student’s t-test with equal variance assumption.
Blots in a, c, d, and e are representative of n=3 biologically independent replicates.
Extended Data Fig. 8. Initiator DNA methyltransferase expression in human tonsil B-cell subsets and overexpression effects on LCL growth and survival.
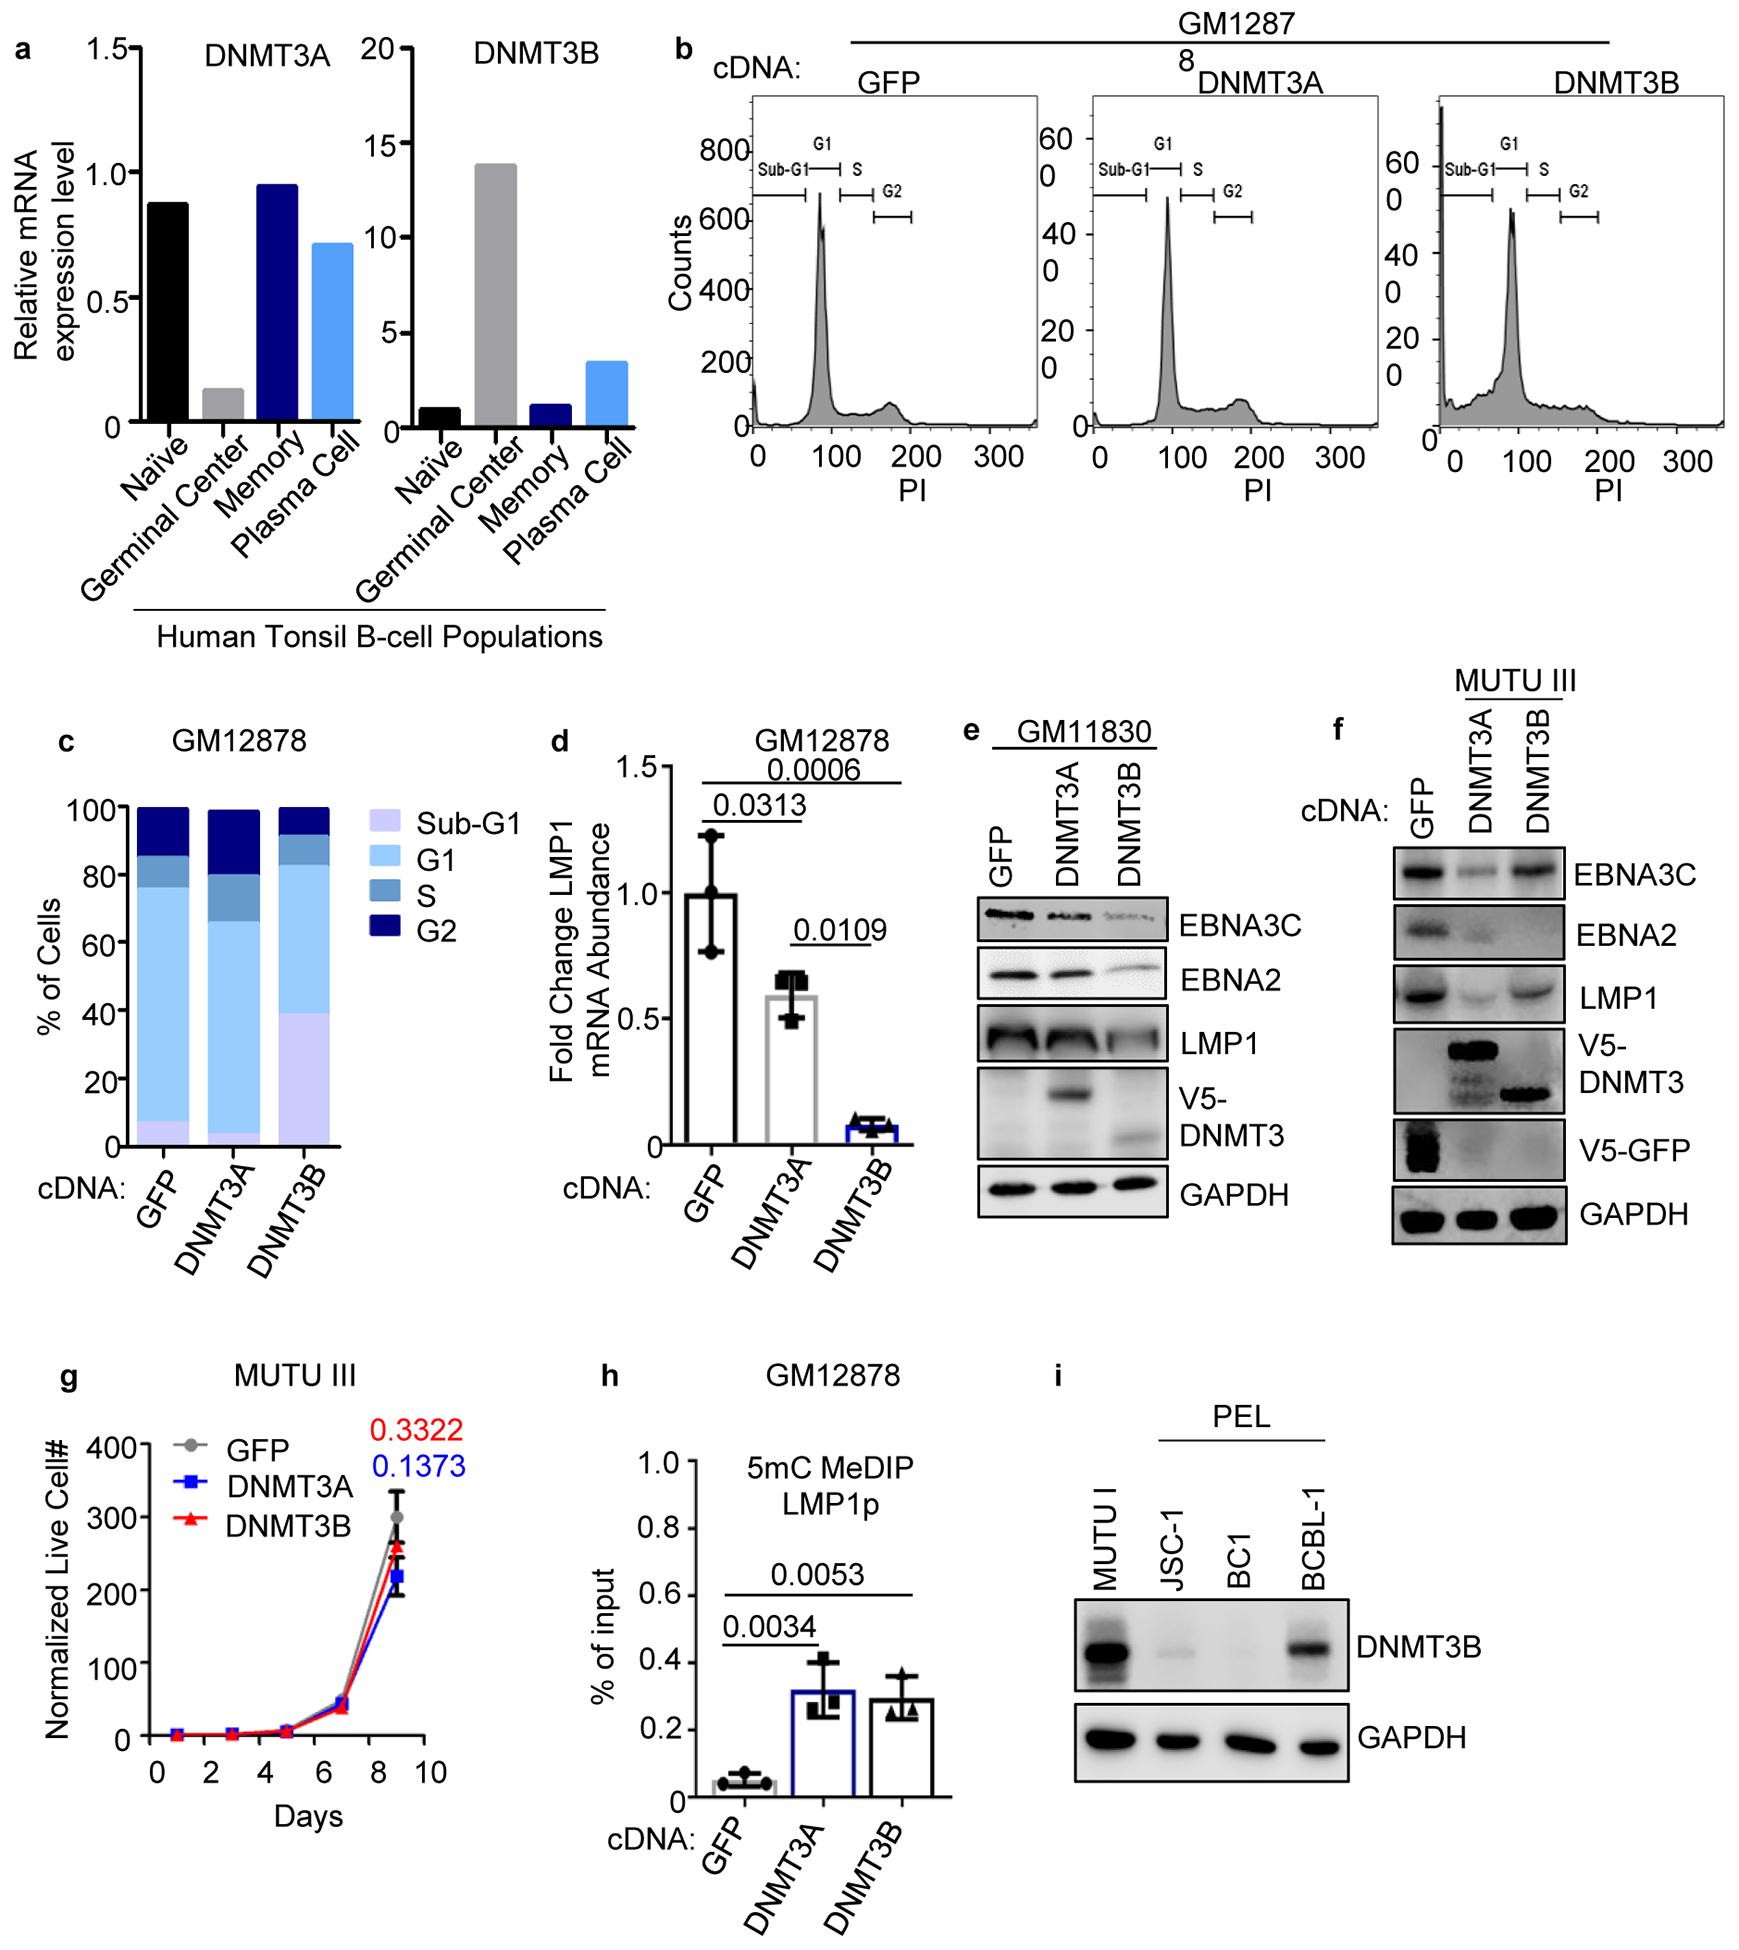
a. DNMT3A and 3B mRNA expression in published microarray analysis of human tonsil B-cell naïve, GC, memory or plasma cell subsets53.
b, Propidium iodide (PI) cell cycle analysis of GM12878 LCLs that expressed control GFP, DNMT3A or DNMT3B. Data are representative of n=2 biologically independent replicates.
c, Percentages of the indicated cell populations in GM12878 that expressed GFP, DNMT3A or DNMT3B. Data are the average of n=2 biologically independent replicates.
d, qPCR analysis of LMP1 mRNA abundances in GM12878 that expressed the indicated GFP, DNMT3A or DNMT3B cDNAs. Mean ± SEM from n=3 biologically independent replicates are shown. p-values were calculated using one-way ANOVA with Turkey’s multiple comparisons test.
e, Immunoblot analysis of WCL from GM11380 LCLs that expressed GFP, DNMT3A or DNMT3B cDNAs, as indicated.
f, Immunoblot analysis of WCL from MUTU III that expressed GFP, DNMT3A or DNMT3B cDNAs.
g, Normalized MUTU III live cell numbers at the indicated timepoints after expression of GFP, DNMT3A or DNMT3B. Mean ± SEM from n=3 biologically independent replicates are shown. p-values were calculated by two-sided student’s t-test with equal variance assumption.
h, 5 mC MeDIP analysis of chromatin from GM12878 expressing GFP (gray box), DNMT3A (blue box) or DNMT3B (black box) followed by qPCR using a second primer set specific for LMP1p (from the same experiment as in Fig. 4f). Mean ± SEM are shown for n=3 biologically independent replicates. p-values were calculated using two-way ANOVA with Sidak’s multiple comparisons test.
i, Immunoblot analysis of WCL from MUTU I, from the EBV+/KSHV+ PELs JSC-1 or BC-1, or from the EBV-/KSHV+ PEL BCBL-1.
Blots in e, f, and i are representative of n=3 biologically independent replicates.
Extended Data Fig. 9. PRC1 is a BL host factor important for silencing of LMP1 and LMP2a expression.
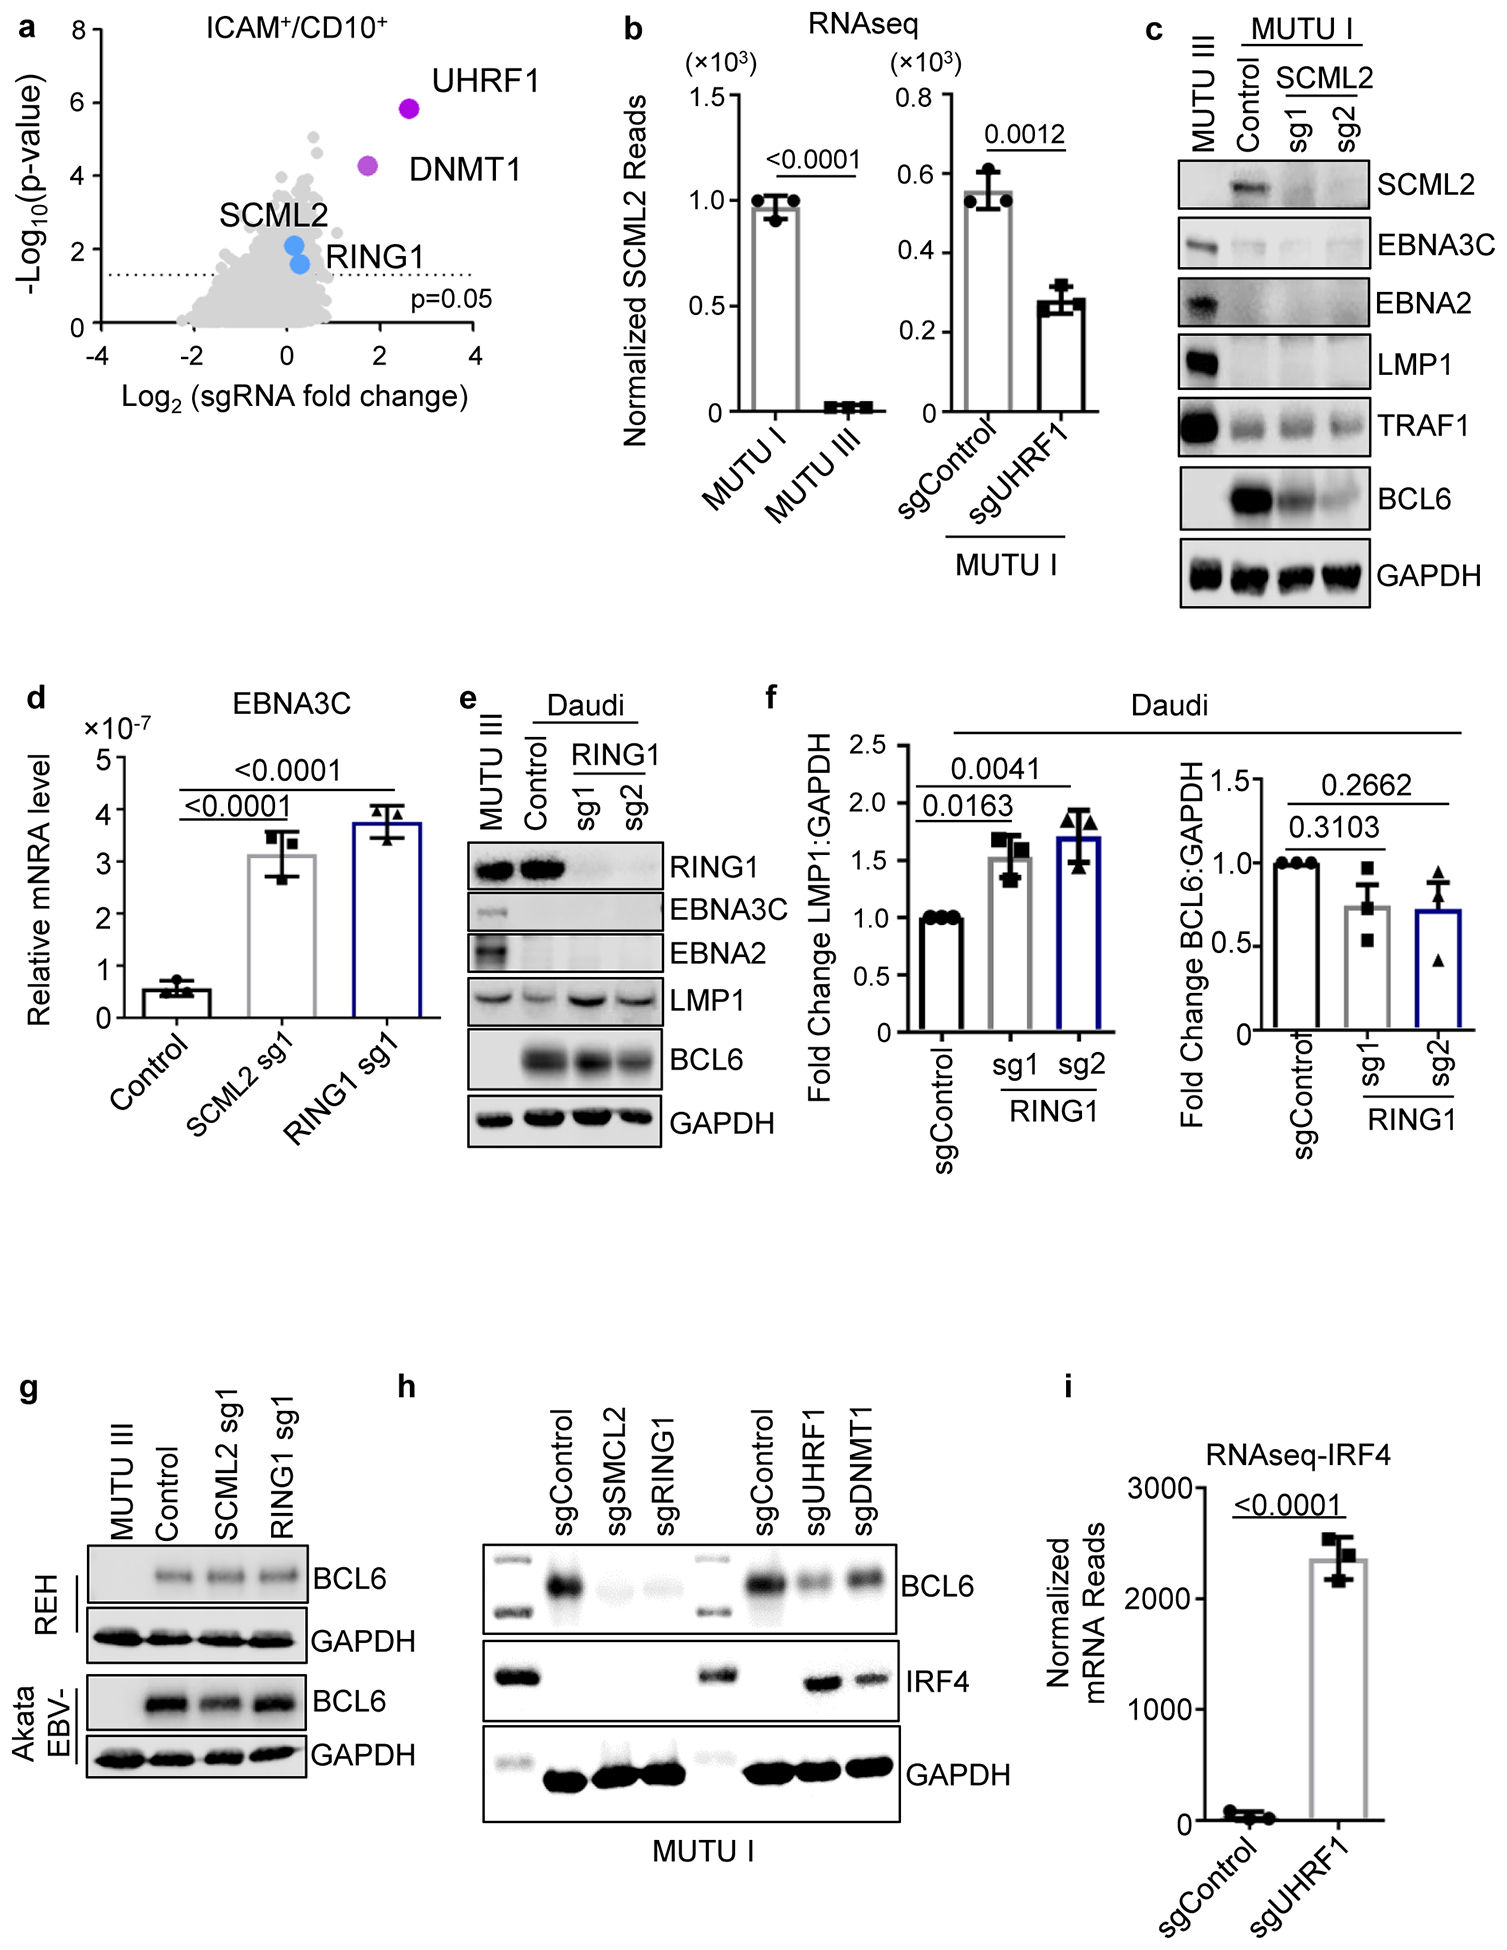
a, Volcano plots showing the -Log10 (p-value) statistical significance (y-axis) and Log2 fold-change (x-axis) calculated by STARS analysis of sgRNA abundance in the input versus FACSorted ICAM-1high/CD10low population. Values for genes encoding the PRC1 subunits SCML2 and RING1 are highlighted in blue, and values for genes encoding UHRF1 and DNMT1 are shown in purple for comparison. n=3 of biologically independent replicates. P-values were determined by one-sided Fisher’s exact test.
b, Mean + SEM normalized SCML2 mRNA reads from triplicate RNAseq analysis of MUTU I versus III (left) or of MUTU I that expressed control or UHRF1 sgRNA (right). n=3 of biologically independent replicates. p-values were calculated by unpaired two-sided student’s t-test with equal variance assumption.
c, Immunoblot analysis of WCL from MUTU III or from MUTU1 that expressed the indicated sgRNAs.
d, qPCR analysis of EBNA3C expression. Values were normalized by 18s rRNA qPCR levels and the ratio in control cells was set to 1. Mean ± SEM from n=3 biologically independent replicates are shown. p-values were calculated using one-way ANOVA with Sidak’s multiple comparisons.
, Immunoblot analysis of WCL from MUTU III or Daudi that expressed the indicated sgRNAs.
f, Fold change of the LMP1:GAPDH immunoblot ratio (left) or BCL6:GAPDH immunoblot ratio (right) from n=3 of biologically independent replicates, as in ED Fig. 9e. p-values were calculated using one-way ANOVA with Sidak’s multiple comparisons.
g, Immunoblot analysis of WCL from MUTU III or from REH acute lymphoblastic leukemia EBV-negative B-cells or from Akata EBV-negative BL expressing the indicated sgRNAs.
h, Immunoblot analysis of WCL from MUTU I that expressed the indicated sgRNAs.
i, Normalized IRF4 mRNA reads from n=3 of biologically independent triplicate RNAseq datasets of MUTU I cells that expressed sgControl or sgUHRF1. p-values were calculated by unpaired two-sided student’s t-test with equal variance assumption.
Blots in c, e, g and h are representative of at least 3 biologically independent replicates.
Extended Data Fig. 10. PRC1 effects on latency III expression and EBV H2Ak119 monoubiquitylation.
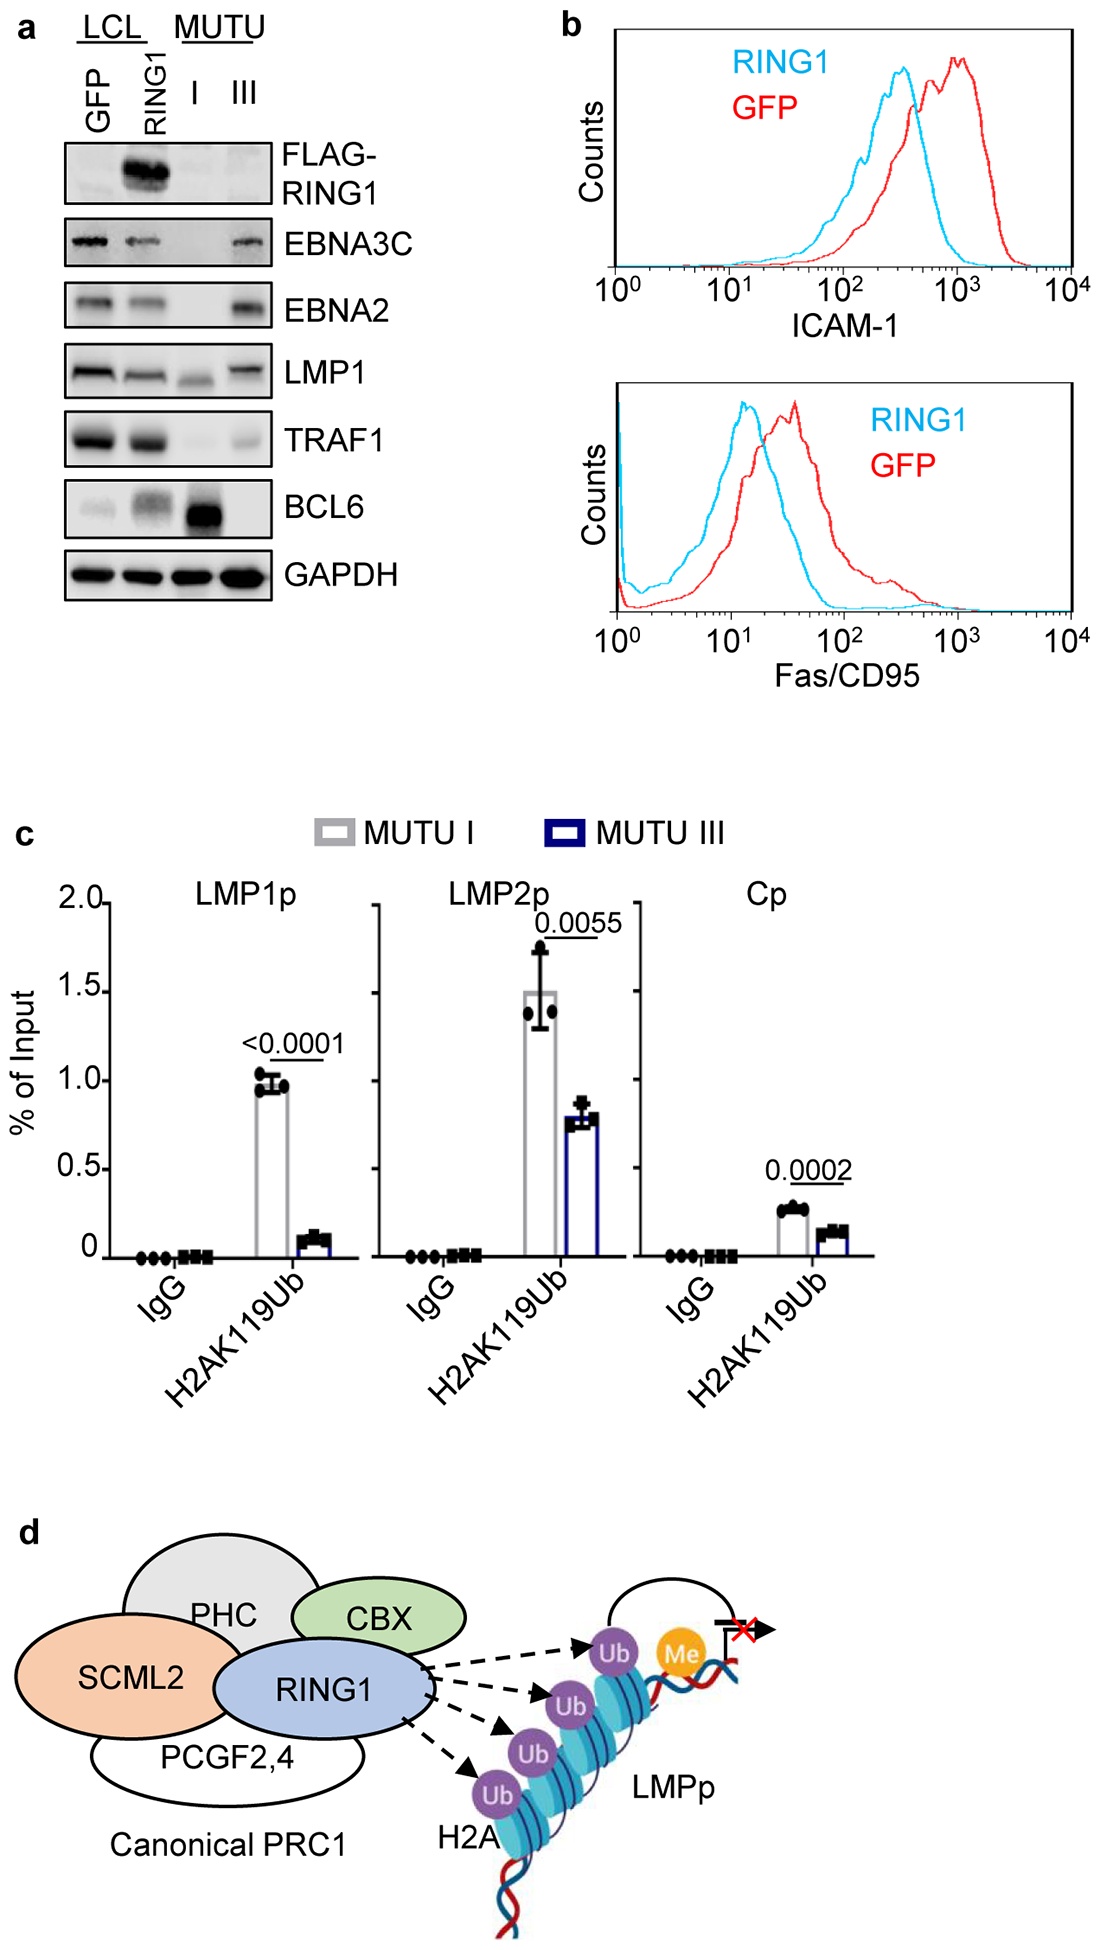
a, Immunoblot analysis of WCL from GM12878 LCLs that expressed GFP versus RING1 cDNAs or from MUTU I or III as controls.
b, FACS analysis of PM abundances of LMP1/NF-kB targets Fas/CD95 (left) and ICAM-1 (right) in GM21878 LCL expressing GFP (blue) versus RING1 (red).
c, ChIP analysis of chromatin from MUTU 1 (black bar) or MUTU III (blue bar) using control IgG versus anti-H2A lysine 119 monoubiquitin (H2AK119Ub) followed by qPCR with primers specific for LMP1p, LMP2p or Cp. Mean ± SEM from n=3 biologically independent replicates are shown, p-values were calculated by unpaired two-sided student’s t-test with equal variance assumption.
d, Schematic model of PRC1 complex-mediated ubiquitination of chromatin.
a and b are representative of n=3 biologically independent replicates.
Supplementary Material
Acknowledgements
This work was supported by NIH RO1s AI137337 and CA228700 (BEG) and CA047006 (BZ), Starr Cancer Foundation Project # I11-0043 (LGR, BEG, EC and RJO), Burroughs Wellcome Career Award in Medical Sciences and American Cancer Society Research Scholar Award (BEG), Leukemia and Lymphoma Society SCOR grant (EC and LGR), and the Next Generation Fund at the Broad Institute (JGD). We thank Jeff Sample for KEM I, MUTU I and MUTU III. We thank Raymond Reynolds, Tanner Dalton, Leah Kottyan, Carmy Forney, Matt Weirauch, Paul Wade and Adam Chicoine for technical and bioinformatic assistance.
Footnotes
Competing Interests
The authors declare no competing financial interests. LGR is a consultant for Janssen, ADC Therapeutics.
References
- 1.Longnecker RM, Elliott K; Cohen Jeffrey I. Epstein-barr virus Fields Virology Sixth Edition Vol. 1 Wolters Kluwer Health Adis (ESP) (2013). [Google Scholar]
- 2.Cohen JI Epstein-Barr virus infection. N Engl J Med 343, 481–492, doi: 10.1056/nejm200008173430707 (2000). [DOI] [PubMed] [Google Scholar]
- 3.Thorley-Lawson DA EBV Persistence--Introducing the Virus. Current topics in microbiology and immunology 390, 151–209, doi: 10.1007/978-3-319-22822-8_8 (2015). [DOI] [PMC free article] [PubMed] [Google Scholar]
- 4.Price AM & Luftig MA To Be or Not IIb: A Multi-Step Process for Epstein-Barr Virus Latency Establishment and Consequences for B Cell Tumorigenesis. PLOS Pathogens 11, e1004656, doi: 10.1371/journal.ppat.1004656 (2015). [DOI] [PMC free article] [PubMed] [Google Scholar]
- 5.Woellmer A & Hammerschmidt W Epstein-Barr virus and host cell methylation: regulation of latency, replication and virus reactivation. Current opinion in virology 3, 260–265, doi: 10.1016/j.coviro.2013.03.005 (2013). [DOI] [PMC free article] [PubMed] [Google Scholar]
- 6.Price AM, Messinger JE & Luftig MA c-Myc Represses Transcription of Epstein-Barr Virus Latent Membrane Protein 1 Early after Primary B Cell Infection. J Virol 92, doi: 10.1128/jvi.01178-17 (2018). [DOI] [PMC free article] [PubMed] [Google Scholar]
- 7.Mrozek-Gorska P et al. Epstein-Barr virus reprograms human B lymphocytes immediately in the prelatent phase of infection. Proceedings of the National Academy of Sciences of the United States of America 116, 16046–16055, doi: 10.1073/pnas.1901314116 (2019). [DOI] [PMC free article] [PubMed] [Google Scholar]
- 8.Wang LW et al. Epstein-Barr-Virus-Induced One-Carbon Metabolism Drives B Cell Transformation. Cell metabolism, doi: 10.1016/j.cmet.2019.06.003 (2019). [DOI] [PMC free article] [PubMed] [Google Scholar]
- 9.Seifert M, Scholtysik R & Kuppers R Origin and pathogenesis of B cell lymphomas. Methods Mol Biol 971, 1–25, doi: 10.1007/978-1-62703-269-8_1 (2013). [DOI] [PubMed] [Google Scholar]
- 10.Westhoff Smith D & Sugden B Potential cellular functions of Epstein-Barr Nuclear Antigen 1 (EBNA1) of Epstein-Barr Virus. Viruses 5, 226–240, doi: 10.3390/v5010226 (2013). [DOI] [PMC free article] [PubMed] [Google Scholar]
- 11.Sugden B Epstein-Barr virus: the path from association to causality for a ubiquitous human pathogen. PLoS biology 12, e1001939, doi: 10.1371/journal.pbio.1001939 (2014). [DOI] [PMC free article] [PubMed] [Google Scholar]
- 12.Schaefer BC, Strominger JL & Speck SH Host-cell-determined methylation of specific Epstein-Barr virus promoters regulates the choice between distinct viral latency programs. Molecular and Cellular Biology 17, 364, doi: 10.1128/MCB.17.1.364 (1997). [DOI] [PMC free article] [PubMed] [Google Scholar]
- 13.Masucci MG et al. 5-Azacytidine up regulates the expression of Epstein-Barr virus nuclear antigen 2 (EBNA-2) through EBNA-6 and latent membrane protein in the Burkitt’s lymphoma line rael. J Virol 63, 3135–3141 (1989). [DOI] [PMC free article] [PubMed] [Google Scholar]
- 14.Kalla M, Schmeinck A, Bergbauer M, Pich D & Hammerschmidt W AP-1 homolog BZLF1 of Epstein-Barr virus has two essential functions dependent on the epigenetic state of the viral genome. Proceedings of the National Academy of Sciences of the United States of America 107, 850–855, doi: 10.1073/pnas.0911948107 (2010). [DOI] [PMC free article] [PubMed] [Google Scholar]
- 15.Robertson KD, Hayward SD, Ling PD, Samid D & Ambinder RF Transcriptional activation of the Epstein-Barr virus latency C promoter after 5-azacytidine treatment: evidence that demethylation at a single CpG site is crucial. Molecular and Cellular Biology 15, 6150, doi: 10.1128/MCB.15.11.6150 (1995). [DOI] [PMC free article] [PubMed] [Google Scholar]
- 16.Niller HH, Szenthe K & Minarovits J Epstein-Barr virus-host cell interactions: an epigenetic dialog? Frontiers in genetics 5, 367, doi: 10.3389/fgene.2014.00367 (2014). [DOI] [PMC free article] [PubMed] [Google Scholar]
- 17.Hughes DJ et al. Contributions of CTCF and DNA Methyltransferases DNMT1 and DNMT3B to Epstein-Barr Virus Restricted Latency. Journal of Virology 86, 1034, doi: 10.1128/JVI.05923-11 (2012). [DOI] [PMC free article] [PubMed] [Google Scholar]
- 18.Gregory CD, Rowe M & Rickinson AB Different Epstein—Barr virus—B cell interactions in phenotypically distinct clones of a Burkitt's lymphoma cell line. Journal of General Virology 71, 1481–1495, doi:doi: 10.1099/0022-1317-71-7-1481 (1990). [DOI] [PubMed] [Google Scholar]
- 19.Babcock GJ, Hochberg D & Thorley-Lawson DA The Expression Pattern of Epstein-Barr Virus Latent Genes In Vivo Is Dependent upon the Differentiation Stage of the Infected B Cell. Immunity 13, 497–506, doi: 10.1016/S1074-7613(00)00049-2 (2000). [DOI] [PubMed] [Google Scholar]
- 20.Carter KL, Cahir-McFarland E & Kieff E Epstein-barr virus-induced changes in B-lymphocyte gene expression. Journal of virology 76, 10427–10436, doi: 10.1128/jvi.76.20.10427-10436.2002 (2002). [DOI] [PMC free article] [PubMed] [Google Scholar]
- 21.Peng M & Lundgren E Transient expression of the Epstein-Barr virus LMP1 gene in B-cell chronic lymphocytic leukemia cells, T cells, and hematopoietic cell lines: cell-type-independent-induction of CD23, CD21, and ICAM-1. Leukemia 7, 104–112 (1993). [PubMed] [Google Scholar]
- 22.Kis LL, Takahara M, Nagy N, Klein G & Klein E IL-10 can induce the expression of EBV-encoded latent membrane protein-1 (LMP-1) in the absence of EBNA-2 in B lymphocytes and in Burkitt lymphoma- and NK lymphoma-derived cell lines. Blood 107, 2928–2935, doi: 10.1182/blood-2005-06-2569 (2006). [DOI] [PubMed] [Google Scholar]
- 23.Doench JG et al. Optimized sgRNA design to maximize activity and minimize off-target effects of CRISPR-Cas9. Nature Biotechnology 34, 184, doi:10.1038/nbt.343710.1038/nbt.3437https://www.nature.com/articles/nbt.3437#supplementary-informationhttps://www.nature.com/articles/nbt.3437#supplementary-information (2016). [DOI] [PMC free article] [PubMed] [Google Scholar]
- 24.Bostick M et al. UHRF1 plays a role in maintaining DNA methylation in mammalian cells. Science 317, 1760–1764, doi: 10.1126/science.1147939 (2007). [DOI] [PubMed] [Google Scholar]
- 25.Sharif J et al. The SRA protein Np95 mediates epigenetic inheritance by recruiting Dnmt1 to methylated DNA. Nature 450, 908–912, doi: 10.1038/nature06397 (2007). [DOI] [PubMed] [Google Scholar]
- 26.Avvakumov GV et al. Structural basis for recognition of hemi-methylated DNA by the SRA domain of human UHRF1. Nature 455, 822–825, doi: 10.1038/nature07273 (2008). [DOI] [PubMed] [Google Scholar]
- 27.Bashtrykov P, Jankevicius G, Jurkowska RZ, Ragozin S & Jeltsch A The UHRF1 protein stimulates the activity and specificity of the maintenance DNA methyltransferase DNMT1 by an allosteric mechanism. J Biol Chem 289, 4106–4115, doi: 10.1074/jbc.M113.528893 (2014). [DOI] [PMC free article] [PubMed] [Google Scholar]
- 28.Chen C et al. Uhrf1 regulates germinal center B cell expansion and affinity maturation to control viral infection. The Journal of Experimental Medicine 215, 1437, doi: 10.1084/jem.20171815 (2018). [DOI] [PMC free article] [PubMed] [Google Scholar]
- 29.Shaknovich R et al. DNA methyltransferase 1 and DNA methylation patterning contribute to germinal center B-cell differentiation. Blood 118, 3559–3569, doi: 10.1182/blood-2011-06-357996 (2011). [DOI] [PMC free article] [PubMed] [Google Scholar]
- 30.Wang LW, Jiang S & Gewurz BE Epstein-Barr Virus LMP1-Mediated Oncogenicity. J Virol 91, doi: 10.1128/jvi.01718-16 (2017). [DOI] [PMC free article] [PubMed] [Google Scholar]
- 31.Kieser A & Sterz KR The Latent Membrane Protein 1 (LMP1). Current topics in microbiology and immunology 391, 119–149, doi: 10.1007/978-3-319-22834-1_4 (2015). [DOI] [PubMed] [Google Scholar]
- 32.Wang C et al. RNA Sequencing Analyses of Gene Expression during Epstein-Barr Virus Infection of Primary B Lymphocytes. Journal of Virology 93, e00226–00219, doi: 10.1128/JVI.00226-19 (2019). [DOI] [PMC free article] [PubMed] [Google Scholar]
- 33.Price AM et al. Analysis of Epstein-Barr virus-regulated host gene expression changes through primary B-cell outgrowth reveals delayed kinetics of latent membrane protein 1-mediated NF-kappaB activation. J Virol 86, 11096–11106, doi: 10.1128/jvi.01069-12 (2012). [DOI] [PMC free article] [PubMed] [Google Scholar]
- 34.Minamitani T et al. Mouse model of Epstein-Barr virus LMP1- and LMP2A-driven germinal center B-cell lymphoproliferative disease. Proc Natl Acad Sci U S A 114, 4751–4756, doi: 10.1073/pnas.1701836114 (2017). [DOI] [PMC free article] [PubMed] [Google Scholar]
- 35.Cohen JI, Wang F, Mannick J & Kieff E Epstein-Barr virus nuclear protein 2 is a key determinant of lymphocyte transformation. Proceedings of the National Academy of Sciences of the United States of America 86, 9558–9562, doi: 10.1073/pnas.86.23.9558 (1989). [DOI] [PMC free article] [PubMed] [Google Scholar]
- 36.Pei Y, Banerjee S, Jha HC, Sun Z & Robertson ES An essential EBV latent antigen 3C binds Bcl6 for targeted degradation and cell proliferation. PLoS Pathog 13, e1006500, doi: 10.1371/journal.ppat.1006500 (2017). [DOI] [PMC free article] [PubMed] [Google Scholar]
- 37.Vaughan RM et al. Chromatin structure and its chemical modifications regulate the ubiquitin ligase substrate selectivity of UHRF1. Proceedings of the National Academy of Sciences 115, 8775–8780, doi: 10.1073/pnas.1806373115 (2018). [DOI] [PMC free article] [PubMed] [Google Scholar]
- 38.Maenohara S et al. Role of UHRF1 in de novo DNA methylation in oocytes and maintenance methylation in preimplantation embryos. PLOS Genetics 13, e1007042, doi: 10.1371/journal.pgen.1007042 (2017). [DOI] [PMC free article] [PubMed] [Google Scholar]
- 39.Bronner C, Alhosin M, Hamiche A & Mousli M Coordinated Dialogue between UHRF1 and DNMT1 to Ensure Faithful Inheritance of Methylated DNA Patterns. Genes 10, 65, doi: 10.3390/genes10010065 (2019). [DOI] [PMC free article] [PubMed] [Google Scholar]
- 40.Cheng J et al. Structural insight into coordinated recognition of trimethylated histone H3 lysine 9 (H3K9me3) by the plant homeodomain (PHD) and tandem tudor domain (TTD) of UHRF1 (ubiquitin-like, containing PHD and RING finger domains, 1) protein. J Biol Chem 288, 1329–1339, doi: 10.1074/jbc.M112.415398 (2013). [DOI] [PMC free article] [PubMed] [Google Scholar]
- 41.Arita K et al. Recognition of modification status on a histone H3 tail by linked histone reader modules of the epigenetic regulator UHRF1. Proceedings of the National Academy of Sciences 109, 12950–12955, doi: 10.1073/pnas.1203701109 (2012). [DOI] [PMC free article] [PubMed] [Google Scholar]
- 42.Harrison JS et al. Hemi-methylated DNA regulates DNA methylation inheritance through allosteric activation of H3 ubiquitylation by UHRF1. eLife 5, e17101, doi: 10.7554/eLife.17101 (2016). [DOI] [PMC free article] [PubMed] [Google Scholar]
- 43.Robertson KD et al. CpG methylation of the major Epstein-Barr virus latency promoter in Burkitt’s lymphoma and Hodgkin’s disease. Blood 88, 3129–3136 (1996). [PubMed] [Google Scholar]
- 44.Kretzmer H et al. DNA methylome analysis in Burkitt and follicular lymphomas identifies differentially methylated regions linked to somatic mutation and transcriptional control. Nature genetics 47, 1316–1325, doi: 10.1038/ng.3413 (2015). [DOI] [PMC free article] [PubMed] [Google Scholar]
- 45.Bhende PM, Seaman WT, Delecluse HJ & Kenney SC The EBV lytic switch protein, Z, preferentially binds to and activates the methylated viral genome. Nature genetics 36, 1099–1104, doi: 10.1038/ng1424 (2004). [DOI] [PubMed] [Google Scholar]
- 46.Bergbauer M et al. CpG-methylation regulates a class of Epstein-Barr virus promoters. PLoS Pathog 6, e1001114, doi: 10.1371/journal.ppat.1001114 (2010). [DOI] [PMC free article] [PubMed] [Google Scholar]
- 47.Smits AH et al. Biological plasticity rescues target activity in CRISPR knock outs. Nature methods 16, 1087–1093, doi: 10.1038/s41592-019-0614-5 (2019). [DOI] [PubMed] [Google Scholar]
- 48.Giffin L & Damania B KSHV: pathways to tumorigenesis and persistent infection. Advances in virus research 88, 111–159, doi: 10.1016/b978-0-12-800098-4.00002-7 (2014). [DOI] [PMC free article] [PubMed] [Google Scholar]
- 49.Lurain K et al. Viral, immunologic, and clinical features of primary effusion lymphoma. Blood 133, 1753–1761, doi: 10.1182/blood-2019-01-893339 (2019). [DOI] [PMC free article] [PubMed] [Google Scholar]
- 50.Anastasiadou E et al. Epigenetic mechanisms do not control viral latency III in primary effusion lymphoma cells infected with a recombinant Epstein-Barr virus. Leukemia 19, 1854–1856, doi: 10.1038/sj.leu.2403895 (2005). [DOI] [PubMed] [Google Scholar]
- 51.Goll MG & Bestor TH Eukaryotic cytosine methyltransferases. Annual review of biochemistry 74, 481–514, doi: 10.1146/annurev.biochem.74.010904.153721 (2005). [DOI] [PubMed] [Google Scholar]
- 52.Barwick BG et al. B cell activation and plasma cell differentiation are inhibited by de novo DNA methylation. Nature communications 9, 1900, doi: 10.1038/s41467-018-04234-4 (2018). [DOI] [PMC free article] [PubMed] [Google Scholar]
- 53.Lai AY et al. DNA methylation profiling in human B cells reveals immune regulatory elements and epigenetic plasticity at Alu elements during B-cell activation. Genome research 23, 2030–2041, doi: 10.1101/gr.155473.113 (2013). [DOI] [PMC free article] [PubMed] [Google Scholar]
- 54.Leonard S et al. Epigenetic and transcriptional changes which follow Epstein-Barr virus infection of germinal center B cells and their relevance to the pathogenesis of Hodgkin’s lymphoma. J Virol 85, 9568–9577, doi: 10.1128/jvi.00468-11 (2011). [DOI] [PMC free article] [PubMed] [Google Scholar]
- 55.Kelly G, Bell A & Rickinson A Epstein-Barr virus-associated Burkitt lymphomagenesis selects for downregulation of the nuclear antigen EBNA2. Nature medicine 8, 1098–1104, doi: 10.1038/nm758 (2002). [DOI] [PubMed] [Google Scholar]
- 56.Allday MJ EBV finds a polycomb-mediated, epigenetic solution to the problem of oncogenic stress responses triggered by infection. Frontiers in genetics 4, 212, doi: 10.3389/fgene.2013.00212 (2013). [DOI] [PMC free article] [PubMed] [Google Scholar]
- 57.Arvey A et al. An atlas of the Epstein-Barr virus transcriptome and epigenome reveals host-virus regulatory interactions. Cell host & microbe 12, 233–245, doi: 10.1016/j.chom.2012.06.008 (2012). [DOI] [PMC free article] [PubMed] [Google Scholar]
- 58.Sterlin D et al. Genetic, Cellular and Clinical Features of ICF Syndrome: a French National Survey. J Clin Immunol 36, 149–159, doi: 10.1007/s10875-016-0240-2 (2016). [DOI] [PubMed] [Google Scholar]
- 59.Salamon D et al. Protein-DNA binding and CpG methylation at nucleotide resolution of latency-associated promoters Qp, Cp, and LMP1p of Epstein-Barr virus. J Virol 75, 2584–2596, doi: 10.1128/jvi.75.6.2584-2596.2001 (2001). [DOI] [PMC free article] [PubMed] [Google Scholar]
- 60.Simon JA & Kingston RE Occupying chromatin: Polycomb mechanisms for getting to genomic targets, stopping transcriptional traffic, and staying put. Mol Cell 49, 808–824, doi: 10.1016/j.molcel.2013.02.013 (2013). [DOI] [PMC free article] [PubMed] [Google Scholar]
- 61.Taylor GS, Long HM, Brooks JM, Rickinson AB & Hislop AD The immunology of Epstein-Barr virus-induced disease. Annual review of immunology 33, 787–821, doi: 10.1146/annurev-immunol-032414-112326 (2015). [DOI] [PubMed] [Google Scholar]
- 62.Ahmed M et al. TCR-mimic bispecific antibodies targeting LMP2A show potent activity against EBV malignancies. JCI insight 3, doi: 10.1172/jci.insight.97805 (2018). [DOI] [PMC free article] [PubMed] [Google Scholar]
- 63.Ma Y et al. CRISPR/Cas9 Screens Reveal Epstein-Barr Virus-Transformed B Cell Host Dependency Factors. Cell Host Microbe 21, 580–591.e587, doi: 10.1016/j.chom.2017.04.005 (2017). [DOI] [PMC free article] [PubMed] [Google Scholar]
- 64.Lu F et al. Coordinate Regulation of TET2 and EBNA2 Controls the DNA Methylation State of Latent Epstein-Barr Virus. Journal of virology 91, doi: 10.1128/jvi.00804-17 (2017). [DOI] [PMC free article] [PubMed] [Google Scholar]
- 65.Dobin A et al. STAR: ultrafast universal RNA-seq aligner. Bioinformatics (Oxford, England) 29, 15–21, doi: 10.1093/bioinformatics/bts635 (2013). [DOI] [PMC free article] [PubMed] [Google Scholar]
- 66.Liao Y, Smyth GK & Shi W featureCounts: an efficient general purpose program for assigning sequence reads to genomic features. Bioinformatics (Oxford, England) 30, 923–930, doi: 10.1093/bioinformatics/btt656 (2014). [DOI] [PubMed] [Google Scholar]
- 67.Love MI, Huber W & Anders S Moderated estimation of fold change and dispersion for RNA-seq data with DESeq2. Genome biology 15, 550, doi: 10.1186/s13059-014-0550-8 (2014). [DOI] [PMC free article] [PubMed] [Google Scholar]
- 68.Chen EY et al. Enrichr: interactive and collaborative HTML5 gene list enrichment analysis tool. BMC bioinformatics 14, 128, doi: 10.1186/1471-2105-14-128 (2013). [DOI] [PMC free article] [PubMed] [Google Scholar]
Associated Data
This section collects any data citations, data availability statements, or supplementary materials included in this article.
Supplementary Materials
Data Availability Statement
CRISPR screen results are available in Extended Data Table 2. The accession numbers for RNA-seq datasets reported in this paper are NIH GEO GSE136596, GSE136597, and GSE136609. Published microarray analysis53 of human tonsil B-cell naïve, GC, memory or plasma cell subsets were also used and are available at NIH GEO accession number GSE24919. The data that support the findings of this study are available from the corresponding author upon request.


