

Abstract
When the number of baseline covariates whose imbalance needs to be controlled in a sequential randomized controlled trial is large, minimization is the most commonly used method for randomizing treatment assignments. The lack of allocation randomness associated with the minimization method has been the source of controversy, and the need to reduce even minor imbalances inherent in the minimization method has been challenged. The minimal sufficient balance (MSB) method is an alternative to the minimization method. It prevents serious imbalance from a large number of covariates while maintaining a high level of allocation randomness. In this study, the two treatment allocation methods are compared with regards to the effectiveness of balancing covariates across treatment arms and allocation randomness in equal allocation clinical trials. The MSB method proves to be equal or superior in both respects. In addition, type I error rate is preserved in analyses for both balancing methods, when using a binary endpoint.
Keywords: allocation randomness, baseline covariate imbalance, clinical trial, minimal sufficient balance, minimization
1 |. INTRODUCTION
In randomized controlled clinical trials, variables other than the treatment effect, known as covariates, are not randomized and can confound the relationship between the treatment and the outcome. McEntegart1 argues that controlling imbalance in covariates is important for maintaining the credibility of a trial, making interpretations easier than adjustment alone, and protecting against model misspecification. Important baseline covariates may confound the estimation of treatment effects and, therefore, should be prespecified based on strong clinical rationale and adjusted for in the primary analysis.2 In addition, serious baseline covariate imbalances may lead to suspicions of selection bias.3 Therefore, to reduce confounding and isolate treatment effect, controlling imbalance in important baseline covariates is desirable.4,5
When the number of covariates is small, stratified restrictive randomization methods are commonly used to control covariate imbalances.1 When the number of baseline covariates is large, stratification can become impractical, and the minimization method, independently proposed by Taves6 and Pocock and Simon,7 can be used to control imbalance.8,9 The minimization method effectively controls the marginal imbalances of many categorical baseline covariates. However, use of minimization for subject randomization in clinical trials has been criticized because (for a given subject in a study) it does not preserve complete allocation randomness,10,11 namely equal or even near-equal probability of allocation to treatment arms. The method has also been criticized due to the potential inflation of type I error rate when applied to trials with unequal allocations.12 However, Kuznetsova and Tymofyeyev have developed a method for addressing this issue.13
The Minimal Sufficient Balance (MSB) method proposed by Zhao et al, as an alternative to minimization, aims to preserve treatment allocation randomness while preventing serious imbalances in a large number of baseline covariates.14 MSB’s ability to control covariate imbalance while preserving a high level of allocation randomness has been demonstrated in simulation studies and real trial experiences.14–16 However, a direct, quantitative comparison of statistical properties between MSB and minimization has not been reported in a realistic trial situation where biased coin treatment assignments are made. This study does not aim to establish the MSB method as the ultimate method for controlling covariate imbalances, but to explore the way the MSB method’s properties compare to the most commonly used method of controlling imbalance on a large number of covariates, which is minimization. Other methods exist for controlling covariate imbalances, such as those of Begg and Iglewicz17 and Atkinson,18 but none of these methods are commonly used in practice, and thus are not the focus of this study. In Section 2, differences between MSB and minimization are discussed based on their philosophical objectives as well as technical aspects. In Sections 3 and 4, properties of the minimization method and MSB are compared via simulations based on the NINDS rt-PA trial data,19 followed by a discussion in Section 5.
2 |. BACKGROUND
The fundamental basis for statistical inference from randomized control trials is the true random allocation of subjects. In spite of its vast popularity, minimization has had a mixed response from researchers in the field of statistics.14,20–23 The frequent adoption of minimization as a method of promoting covariate balance in clinical trials is problematic because minimization does not preserve a strong rate of allocation randomness.11,24 The three criteria to determine the effectiveness of a method in promoting covariate balance in clinical trials include allocation randomness, effectiveness in controlling imbalance on specified covariates, and ease of implementation. Thus, the background section includes an exploration of the two methods that comprise this study followed by a consideration of these three criteria.
2.1 |. MSB implementation
Implementation of MSB simulations begins with a 20 subject run-in period where the assignments are completely random. This run-in period can be modified based on target sample size. For all subsequent assignments, two treatments are considered, A and B. Assume a subject is prepared to be randomized to a treatment arm. Let nA and nB be the number of subjects who have received treatment A or B, respectively. If covariate j is continuous, a t test is used to determine the imbalance. Let xj be the value of the jth covariate for the incoming subject. Let and be the means of covariate j among the subjects who had previously received A or B, respectively. Let tj and tj* be the test statistic and positive critical values of the independent two-sample t test comparing the values of covariate j within treatments A and B, respectively. Let pj be the P-value associated with the t test comparing and and γj be the minimum tolerable P-value for covariate j.
As a result of these statistics, no vote is made on covariate j if pj ≥ γj. Otherwise, a vote is made in favor of A if the following criteria are met: (a) tj < −tj* and or (b) tj > tj* and . Otherwise, if: (a) tj < −tj* and or (b) tj > tj* and , a vote is made for treatment B. If none of these conditions is met, no vote is made. Votes are tabulated after all covariates have been observed to determine whether one treatment should be favored in order to reduce covariate imbalance across treatment arms.
If, on the other hand, covariate j is categorical with G levels, a Chi-square test is used to determine the level of imbalance. Let njgA and njgB be the number of subjects who have previously been polychotomized in category g of covariate j in treatments A and B, respectively. Let EjgA and EjgB be the expected number of subjects in category g of covariate j under the null hypothesis for treatments A and B, respectively. Let pj be the P-value associated with the Chi-square test statistic with (G − 1) degrees of freedom comparing the levels of covariate j and γj be the minimum tolerable P-value of covariate j.
Assume that the next subject is in category g of covariate j. As a result of these statistics, no vote is made on covariate j if pj ≥ γj. Otherwise a vote is made for A if the following criteria are met: pj < γj and EjgA > njgA. Otherwise, if pj < γj and EjgB > nj,gB, a vote is made against A.
After all of the baseline covariates have been examined, votes are tabulated; and if there are more votes for A than against A, the next subject is assigned to treatment A with a probability of ξ, where ξ is the biased coin probability. If there are more votes against A than for A, the next subject is assigned to treatment B with probability ξ. Otherwise, the allocation probability is 0.5. Although Zhao et al14 suggest using ξ between 0.65 and 0.7, other values are possible in the range of (0.5, 1), depending on the investigator’s comfort with imbalances in baseline covariates and the desired level of allocation predictability. The values of γ1, … , γG indicate the lowest allowable P-values for each covariate. Smaller P-values allow greater imbalance in the covariates; however, they promote more completely random treatment assignments. Zhao et al14 suggest 0.2 ≤ γ1, … , γG ≤ 0.3.
2.2 |. Minimization implementation
In order to implement Pocock and Simon’s minimization,7 continuous covariates must first be polychotomized into two or more categories. Thus, all imbalances is measured in the context of the new, categorical variables. Consider two treatments, A and B, where controlling imbalance on J categorical variables is desired. The first subject is assigned to either to treatment A or B with probability of 0.5. For all subjects following the first subject, total imbalance under hypothetical assignment to treatment A or B must be calculated before the allocation probabilities are determined. Prior to assignment, let xij represent the value of the jth covariate of the ith subject. Let xTij represent the value of the jth covariate of the ith subject in group T (where T is A or B). To calculate the absolute imbalance if subject k is assigned to treatment T, the following equation is used, where Im (k,T) is referred to as the total imbalance if subject k is assigned to treatment T:
where I{} is the identity function and is the opposite treatment than T (ie, B or A). Thus, to determine the allocation probability, first it must be determined if the total imbalance can be reduced by assigning subject k to a particular treatment. Thus, for k > 1, if Im(k, A) < Im(k, B), then subject k is assigned to treatment A with probability ξ, where ξ is the biased coin probability. If Im(k, A) > Im(k, B), then subject k is assigned to treatment B with probability ξ. Otherwise if Im(k, A) = Im(k, B), subject k is assigned to treatment A with probability 0.5.
2.3 |. Allocation randomness
Preserving allocation randomness is paramount to any randomization method because the premise of most statistical inference methods assumes data represent random samples where each subject is equally likely to be assigned to each of the treatments in the trial and subjects’ assignments are independent of one another. Thus, all forms of randomization may have implications for analysis. It has been advocated to use permutation tests,25,26 however, while permutation tests are assumption-free, they are not practical for complex modeling situations.27
Many clinicians conflate concealment of allocation with randomness of allocation.28 These concepts must be distinguished because randomization is the basis for inference. Random allocation guarantees asymptotic balance on all measured and unmeasured covariates; thus, any departure from allocation randomness can bias the treatment effect due to imbalances in measured and unmeasured covariates. The trade-off between allocation randomness and covariate balance exists in all randomization methods; nonetheless, the fact that randomization is necessary for inference must not be dismissed.14 Zhao et al14 and Sajobi et al15 have shown that MSB has a high proportion of completely random treatment assignments (over 50%) due to the method’s ability to correct only for major covariate imbalances. The correct guess probability is also used to measure allocation randomness. The correct guess probability is the probability of successfully guessing the treatment assignment for an unblinded clinician who understands the randomization technique.29 Thus, if α is the proportion of completely random treatment assignments, the correct guess probability is G = (0.5)α + (1 − α)ξ.
Frequent use of constrained randomization, when only minor covariate imbalances are present, is philosophically problematic because the space of all potential randomization schemes has often been markedly reduced, making it sensitive to selection bias. It has been stated and shown that true minimization is not randomization, because the method calls for deterministic assignment for each subject (to the arm that would yield the most balance). As a result, many “randomized” clinical trials are not truly randomized, yet are analyzed as if they were.10,30 Minimization by design “forfeits the theoretical certainty that is guaranteed by randomization and instead relies on the potentially fallible judgment of statisticians and clinicians”.20 Properties of minimization using a biased coin do not significantly improve allocation randomness, especially when biased coin probabilities as high as 0.85 are often used in practice.26 Under completely random design, the distribution of P-values comparing the distribution of covariates among treatment groups is expected to be marginally uniform (although they behave differently from independent uniforms); however this may not be the case in minimization-based clinical trials due to the lack of randomization inherent in minimization.12 Although statistical tests comparing covariates across treatment arms are in disfavor, such comparisons are often used in evaluating the validity of a trial.25
Preserving allocation randomness is particularly important in trials where the treatment assignments are not able to be blinded. Due to the lack of completely random treatment assignments, selection biases can conceivably be found in minimization-based trials. One other major role of randomization is to eliminate the ability to predict future assignments,14,30–32 but it is possible that this feature may be lost almost entirely when minimization is employed. Although this is a potential drawback of minimization, it is difficult to determine whether selection bias actually occurs in minimization-based trials. Nonetheless, the potential for selection bias should be a concern to those who use this randomization method. Even when a biased coin is used for randomization, an unblinded clinician can have a probability of correctly guessing a subject’s treatment assignment which is bounded only by the biased coin probability. It should be noted that some issues related to selection bias may not apply in multicenter trials where randomization is not stratified by center because investigators may only know the sequence of treatment assignments at their center. Nonetheless, decreased randomness can seriously impact the imbalance in measured and unmeasured covariates.
2.4 |. Effectiveness in controlling imbalance on specified covariates
Minimization was designed to control imbalance in categorical covariates and can do so effectively.6,7 In fact, Burman33 showed that when minimization is used, marginal covariate imbalance is of the order Op 1. Nonetheless, when minimization is used with stratified continuous covariates (as is common in clinical trials34–36), imbalance within strata is of the order .27 Both MSB and completely random design result in marginal imbalance that is of the order .27 However, covariate-adaptive methods of covariate balance are generally recommended for use in small and medium-sized trials.14 Thus, asymptotic results should be considered alongside results from simulation studies to fully compare the properties of these methods with respect to covariate balance when covariate-adaptive randomization is used in practice. MSB has been shown in simulation studies to control imbalance in categorical and continuous variables and it has the advantage of controlling imbalance on continuous variables without having to polychotomize them.14
Although Taves6 and Pocock and Simon7 claim minimization is effective at limiting the imbalance between covariates across treatment groups, there are several issues that prevent it from working consistently. First, minimization uses a mixed target because it attempts to minimize the total imbalance, rather than the imbalance in each covariate. In addition, due to the need to polychotomize (eg, dichotomize, trichotomize) all covariates, minimization often does not lead to balance for continuous covariates, because the method is sensitive to the threshold(s) used for the continuous variable.21,37 This issue is a particularly important consideration in clinical trials because many covariates are continuous. In addition, when little information is known about the distribution of the covariates, polychotomization can be done in a way that does not reflect the distribution of the covariate. Even though the randomization methods may balance the polychotomized version of the continuous variables, imbalance is generally assessed on the original scale, which can result in bias. The MSB method, however, controls imbalance in a way that does not depend on the distribution of the variable. As a result, no covariate information is lost in the process of assessing covariate information. No theoretical or simulation-based comparison of the performance of the minimization and MSB methods has been performed to examine the ability of the methods to balance on 10 or more continuous and categorical covariates.
2.5 |. Ease of implementation
One of the challenges with implementing minimization or any other method requiring stratification is that imbalance becomes less efficient when continuous covariates are recoded as categorical covariates causing imbalance reduction in the categorical version of the variable. This process may not lead to desired balance in the continuous variable. The MSB method does not require polychotomization and can use a t test, Wilcoxon Rank Sum test, Chi-square test, or Fisher’s Exact Test to assess the balance between the treatment arms. Some Bayesian adaptive methods require frequent use of a statistician in the allocation process throughout the trial. However, once the thresholds for imbalance (minimization) and the weights of the covariates (MSB and minimization) are specified, the allocations could be and have been successfully automated.15,16
3 |. METHOD
The MSB method for covariate balance14 is a strategy in which biased coin treatment assignments are made only in the presence of a serious imbalance that could be reduced via biased coin treatment assignment. Otherwise, completely random assignments are made. The MSB method is flexible to allow for a variety of methods of measuring imbalance. Typically, the P-value is used as a measure of imbalance due to its prevalence in the literature for determining balance.14 A cautionary note is that P-values of covariate imbalance are intended to be used as a tool for measuring imbalance, but not for inference in a clinical trial. Thus, P-values should not be reported in Table 1 for any given study. Because this article focuses on two-arm, equal allocation trials, it is appropriate to use a t test to determine balance for continuous variables and a Chi-square (or Fisher’s exact) test to determine balance for categorical variables.
TABLE 1.
Results from simulations controlling imbalance in five covariates
| Observed P-values in the original study | |||||||||||
|---|---|---|---|---|---|---|---|---|---|---|---|
| Clinical center | NIHSS | Age | OTT | Glucose | Stroke subtype | Sex | Fibrinogen | Weight | Systolic BP | Diastolic BP | |
| .999 | .140 | .029 | .866 | .780 | .073 | .627 | .181 | .011 | .597 | .281 | |
| Minimization | |||||||||||
| P-Value percentiles | Included in randomization method | Not included in randomization method | |||||||||
| Clinical center | NIHSS | Age | OTT | Glucose | Stroke subtype | Sex | Fibrinogen | Weight | Systolic BP | Diastolic BP | |
| 2.5% | .469 | .223 | .225 | .266 | .115 | .047 | .026 | .023 | .035 | .026 | .026 |
| 5% | .601 | .300 | .303 | .336 | .178 | .082 | .052 | .051 | .065 | .053 | .050 |
| 10% | .733 | .397 | .386 | .422 | .261 | .143 | .105 | .104 | .125 | .100 | .098 |
| Median | .962 | .737 | .721 | .760 | .653 | .542 | .500 | .507 | .526 | .499 | .504 |
| Minimal sufficient balance | |||||||||||
| Included in randomization method | Not included in randomization method | ||||||||||
| Clinical center | NIHSS | Age | OTT | Glucose | Stroke subtype | Sex | Fibrinogen | Weight | Systolic BP | Diastolic BP | |
| 2.5% | .210 | .268 | .266 | .269 | .261 | .037 | .030 | .031 | .033 | .029 | 0.26 |
| 5% | .269 | .297 | .295 | .293 | .291 | .071 | .057 | .055 | .063 | .056 | .052 |
| 10% | .314 | .335 | .330 | .329 | .320 | .131 | .103 | .108 | .114 | .106 | .099 |
| Median | .666 | .629 | .610 | .623 | .623 | .533 | .500 | .504 | .522 | .494 | .501 |
3.1 |. Simulation study
Simulations for studying the characteristics of the MSB and minimization were modeled after a dataset from the NINDS rt-PA Stroke study obtained from the National Technical Information Service.19 The cohort of 624 subjects in that study was included in the development of the simulations. Covariates included from this cohort are three categorical variables (clinical center, sex, and stroke subtype) and eight continuous variables (National Institute of Health Stroke Scale [NIHSS], age, onset-to-treatment time, glucose level, fibrinogen level, weight, systolic blood pressure, and diastolic blood pressure). In the original study, only imbalances in onset-to-treatment time (0–90 minutes vs 91–180 minutes) and clinical center were controlled using a stratified permuted block randomization scheme. Although several outcomes were measured in the original dataset, for the purposes of this study, the pattern set out by Johnson38 will be followed by classifying scores of 95 or 100 on the Barthel index, ≤1 on the NIHSS and the modified Rankin scale, and 1 on the Glasgow outcome scale as indicative of a favorable outcome. Data that support the findings of this study can be purchased from the National Technical Information Service (http://www.ntis.gov/).
For this simulation study, the biased coin probability used is 0.65 and the imbalance control limit P-value (or P-value cutoff) is .3, unless otherwise specified. When applying minimization, continuous covariates were polychotomized according to quartiles. This was done to allow minimization to perform as well as possible in the absence of a clinician input.
Because methods used to analyze data assume completely random design, comparisons included permutation tests to examine whether important distributional assumptions were violated by the randomization methods used in the study.39 Thus, permutation tests were performed to examine whether the desired type I error rates of 0.05 for a two-sided hypothesis test were preserved for simulations involving minimization and MSB methods.
In the calculation of rate of false-positive trials, adjusting for covariate effects used to balance with MSB or minimization, the outcome associated with each simulation corresponding to the treatment assignment for each individual was binary. Wald-type 95% confidence intervals were generated for empirical type I error rates in the course of the simulations for both methods.
3.2 |. Distribution of covariates included in the randomization method
Under completely random design, it is expected that the distribution of the P-values for all covariates are marginally uniformly distributed between 0 and 1. Not all subjects have equal probability of being in the treatment or the control groups because both the MSB and minimization method use biased coin assignments, Thus, this study investigates the distribution of the P-values for the covariates included in the randomization methods to better understand the impact that biased coin treatment assignments have on the distribution of specified covariates across treatment groups. The distribution of covariates were evaluated by considering 5000 simulations, where clinical center, NIHSS, age, onset-to-treatment time, and glucose levels were included in the randomization methods and stroke subtype, sex, fibrinogen, weight, systolic blood pressure, and diastolic blood pressure were only observed, without being included in the randomization methods. A P-value under the null hypothesis of balance between treatments on each of these 11 covariates was calculated using t tests or Chi-square tests, as appropriate, for each of the 5000 simulations.
3.3 |. Effect of a large number of covariates on covariate imbalance
Due to philosophical and real data arguments suggesting that minimization does not perform well with a large number of covariates (eg, 10 or more),7 this study explores the effect of having a large number of covariates on the ability to control imbalance in covariates during randomization for each of the methods considered in this study. P-Values were used to determine imbalance and performance of both methods in reducing covariate imbalance. As a result, a P-value under the null hypothesis on each of these 11 covariates was calculated using t tests and Chi-squared tests, as appropriate, for each of the 1000 simulations. Fewer simulations were considered with 11 covariates due to the computational challenges posed by the sample size and the 11 covariates.
3.4 |. Impact of biased coin probability on allocation randomness and covariate imbalance
To investigate the potential impact of selection bias, the proportion of pure random assignments under biased coin probabilities of 0.55, 0.6, 0.65, 0.7, 0.8, 0.9, and 1 and the overall covariate balance was assessed using MSB and minimization. For each biased coin probability considered, 1000 simulations were performed using each method. The correct guess probability was calculated to determine the potential for selection bias.29 For each simulation study, the fifth percentile boundary on the balance test (t test, or Chi-square test, for imbalance across treatment arms, as appropriate) for each covariate included in the randomization method was considered to assess the effectiveness of the method at controlling covariate imbalances across treatment arms. The covariates considered for this part of the analysis include: Clinical center, NIHSS, age, onset-to-treatment time, and glucose level.
3.5 |. Impact of P-value on MSB
To investigate the potential impact of the P-value cutoff in the MSB method on allocation randomness and covariate balance, the proportion of pure random assignments under P-value cutoffs of 0.1, 0.2, 0.3, and 0.4 and the overall covariate balance were assessed using MSB. For each biased coin probability considered, 1000 simulation studies were conducted. The correct guess probability was calculated to determine the potential for selection bias.29 For each simulation study, the fifth percentile boundary on the balance test (t test, or Chi-square test, as appropriate) for each covariate included in the randomization method was considered to assess the effectiveness of the method at promoting balance across treatment arms. The covariates that were considered for this part of the analysis include: Clinical center, NIHSS, age, onset-to-treatment time, and glucose level.
4 |. RESULTS
4.1 |. Distribution of covariates included in the randomization method
In general, the P-values to measure covariate balance tend to be larger for MSB for those variables included in the randomization method compared to minimization, especially for continuous variables. The 2.5th, 5th, 10th, and 50th percentiles of P-values comparing covariate distributions across treatment arms from the simulations demonstrate superior balance in MSB for a biased coin probability of .65 (see Table 1). For example, the 2.5th, 5th, and 10th percentiles of P-values for glucose level for minimization were .115, .178, and .261, respectively, and for MSB were .261, .291, and .320, respectively. Values for MSB are consistently close to or greater than the imbalance threshold of .3.
4.2 |. Effect of having a large number of covariates on covariate imbalance
Minimization performs poorly in controlling covariate imbalance, particularly for continuous variables. This can be seen by considering 2.5th, 5th, 10th, and 50th percentiles of P-values from the simulations (see Table 2). The analysis found major differences in the performance of the methods. For example, the 2.5th, 5th, and 10th percentiles of P-values for glucose levels using minimization were .060, .102, and .159, respectively, and for MSB were .256, .283, and .311, respectively. Minimization is inferior at controlling imbalance when the number of covariates becomes large, whereas MSB controls imbalance more consistently regardless of the number of covariates when biased coin probability is fixed. The MSB method had some P-values for imbalance below .2 for categorical variables when the number of categories is large (clinical center and stroke subtype) at the 2.5th percentile; however, at the 5th percentile, all of them were above .2, which is generally acceptable and considered as a minor covariate imbalance. Nonetheless, the performance of the covariates overall are better for MSB than for minimization when biased coin probability is fixed. It should be noted that minimization balanced categorical variables to a much greater degree than continuous variables, resulting in greater P-values than MSB for these variables. However, overall balance is superior using MSB.
TABLE 2.
Results from simulations controlling imbalance in 11 covariates
| Observed P-values in the original study | |||||||||||
|---|---|---|---|---|---|---|---|---|---|---|---|
| Clinical center | NIHSS | Age | OTT | Glucose | Stroke subtype | Sex | Fibrinogen | Weight | Systolic BP | Diastolic BP | |
| .999 | .140 | .029 | .866 | .780 | .073 | .627 | .181 | .011 | .597 | .281 | |
| Minimization | |||||||||||
| P-Value boundary | Included in randomization method | ||||||||||
| Clinical center | NIHSS | Age | OTT | Glucose | Stroke subtype | Sex | Fibrinogen | Weight | Systolic BP | Diastolic BP | |
| 2.5% | .257 | .151 | .118 | .152 | .060 | .231 | .229 | .097 | .138 | .125 | .102 |
| 5% | .376 | .194 | .177 | .229 | .102 | .289 | .338 | .143 | .183 | .185 | .152 |
| 10% | .512 | .279 | .249 | .334 | .159 | .411 | .457 | .225 | .263 | .269 | .225 |
| Median | .894 | .687 | .612 | .706 | .566 | .812 | .804 | .619 | .630 | .641 | .633 |
| Minimal sufficient balance | |||||||||||
| Included in randomization method | |||||||||||
| Clinical center | NIHSS | Age | OTT | Glucose | Stroke subtype | Sex | Fibrinogen | Weight | Systolic BP | Diastolic BP | |
| 2.5% | .158 | .263 | .261 | .260 | .256 | .156 | .256 | .254 | .244 | .241 | .250 |
| 5% | .249 | .288 | .286 | .300 | .283 | .226 | .288 | .278 | .288 | .267 | .283 |
| 10% | .318 | .327 | .328 | .336 | .311 | .293 | .330 | .325 | .326 | .313 | .324 |
| Median | .666 | .618 | .615 | .604 | .617 | .587 | .651 | .624 | .632 | .632 | .634 |
4.3 |. Permutation tests
Means and Wald-type confidence intervals for the empirical type I error rates of treatment effect from simulations involving five covariates in the randomization method resulted in 95% confidence intervals of .048, (.042, .053) and .052, (.046, .058), for minimization and MSB, respectively. Means and Wald-type confidence intervals for the empirical type I error rates of treatment effect simulations involving 11 covariates in the randomization method resulted in 95% confidence intervals of .046, (.033, 0.059) and .054, (.040, .068), for minimization and MSB, respectively. These results suggest that the nominal type I error rate of 5% was preserved in general for both MSB and minimization.
4.4 |. Impact of biased coin probability on allocation randomness and covariate imbalance
Imbalance and allocation randomness were analyzed for a variety of biased coin probabilities (see Table 3). The P-values for covariate imbalance tests were obtained from a list compiling all Chi-squared tests and t tests in each simulation study and reflects overall balance, rather than imbalance on certain covariates. The results indicate three significant findings. First, minimization was inferior when compared to MSB at controlling covariate imbalance for fixed biased coin probabilities of .55, .6, and .65. Second, the overwhelming majority of minimization-based treatment assignments were made using a biased coin favoring balance between treatment groups. Even for a biased coin probability of 1.0, less than 20% of the treatment assignments were purely random, as opposed to 82.3% of the assignments for MSB (see Figure 1). Third, in minimization, the correct guess probability was high, especially as the biased coin probability increased. On the other hand, the correct guess probability for MSB increased as the biased coin probability increased but at a fraction of the rate (see Figure 2). When five covariates were balanced using biased coin probabilities of .7, .8, .9, and 1.0, the fifth percentile of the P-values from balance tests for minimization was above both the corresponding value from the MSB method and the imbalance threshold of .3.
TABLE 3.
Results from simulations related to allocation randomness when biased coin probability is varied
| Minimization | |||||||||
|---|---|---|---|---|---|---|---|---|---|
| Biased coin probability | ξ | 0.5 | 0.55 | 0.6 | 0.65 | 0.7 | 0.8 | 0.9 | 1.0 |
| Proportion of pure random assignments | α | 1.00 | .095 | .119 | .137 | .153 | .172 | .184 | .192 |
| Correct guess probabilitya | G | .500 | .545 | .588 | .629 | .669 | .748 | .826 | .904 |
| Balance test P-value fifth percentile | P0.05 | .053 | .121 | .207 | .280 | .352 | .396 | .432 | .434 |
| Minimal sufficient balance | |||||||||
| Biased coin probability | ξ | 0.5 | 0.55 | 0.6 | 0.65 | 0.7 | 0.8 | 0.9 | 1.0 |
| Proportion of pure random assignments | α | 1.00 | .421 | .534 | .613 | .667 | .736 | .789 | .823 |
| Correct guess probabilitya | G | .500 | .529 | .547 | .558 | .567 | .579 | .584 | .589 |
| Balance test P-value fifth percentile | P0.05 | .056 | .169 | .255 | .288 | .297 | .313 | .319 | .318 |
G = (0.5)α + (1−α)ξ.
FIGURE 1.
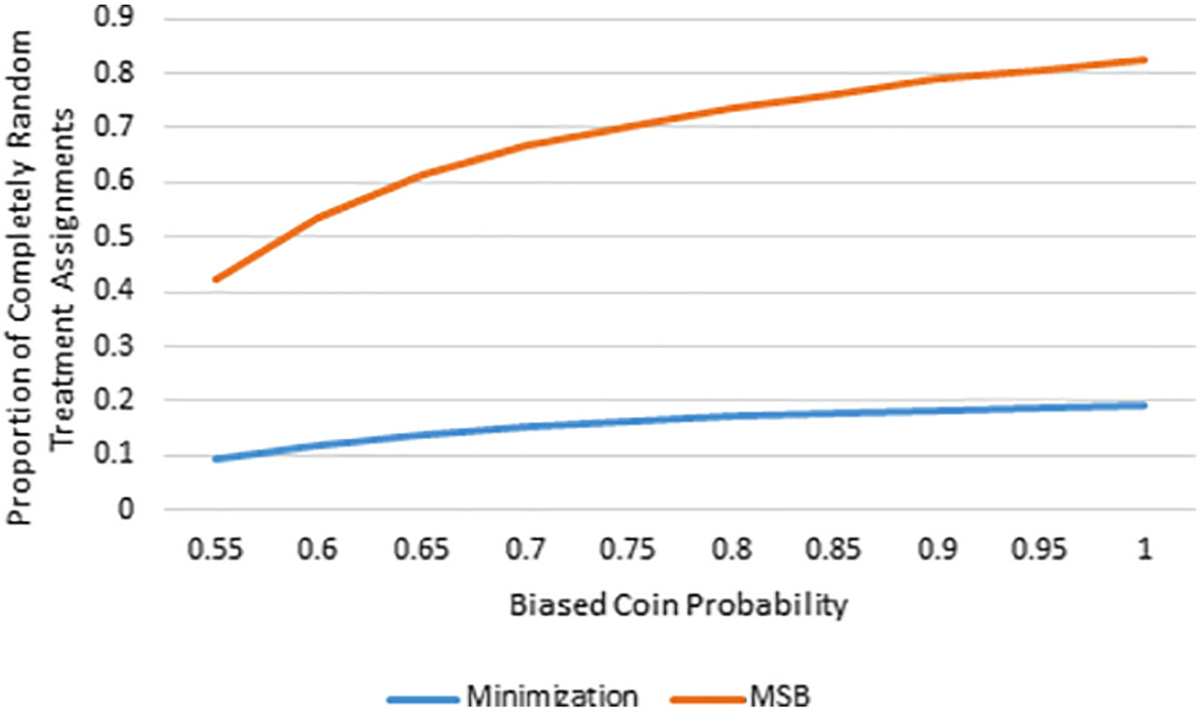
Biased coin probability vs proportion of completely random treatment assignments for MSB and minimization
FIGURE 2.
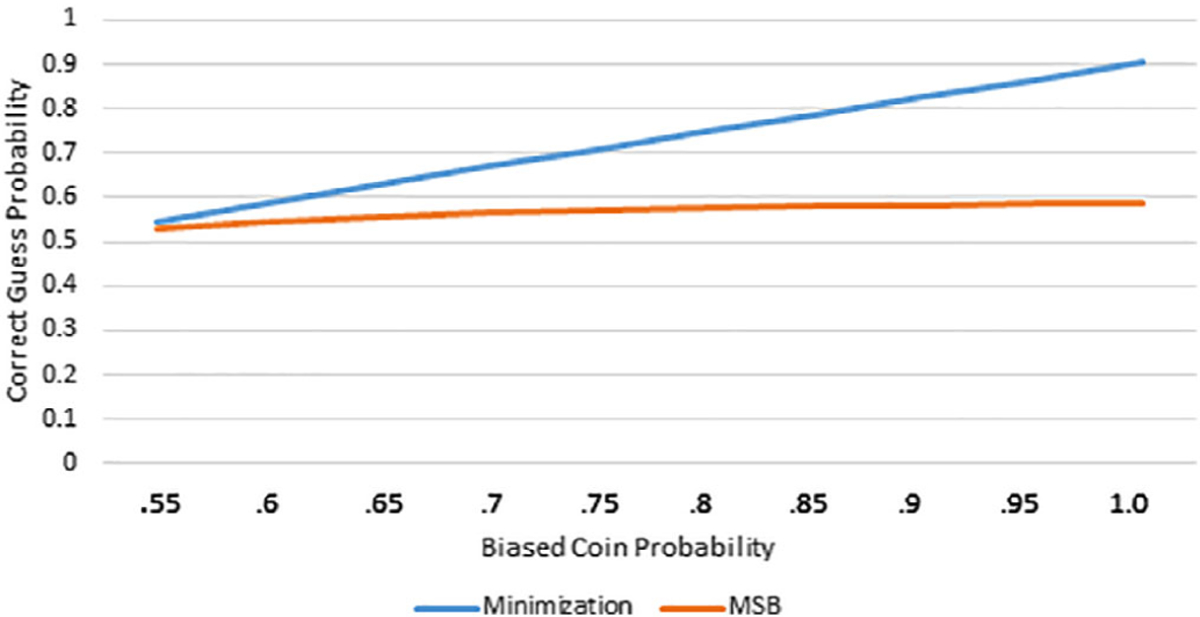
Biased coin probability vs correct guess probability for MSB and minimization
4.5 |. Impact of P-value threshold in MSB
When implementing the MSB method, larger P-value cutoffs resulted in improved covariate balance and fewer completely random treatment assignments (see Table 4). The proportion of pure random assignments under MSB was much greater than minimization in all cases, including the P-value cutoff of .4 (see Table 3).
TABLE 4.
Results from simulations varying the P-value cutoff in MSB
| P-Value cutoff | P | .1 | .2 | .3 | .4 |
|---|---|---|---|---|---|
| Proportion of pure random assignments | α | .839 | .755 | .675 | .601 |
| Correct guess probability | G | .524 | .537 | .549 | .560 |
| Balance test P-value fifth percentile | P0.05 | .129 | .208 | .292 | .367 |
5 |. DISCUSSION
The results of this study indicate that MSB was able to control covariate balance across treatment arms in equal allocation sequential clinical trials. In all cases where the biased coin probability was equal or less than .65, overall covariate balance is better in MSB than in minimization. However, superior balance existed for minimization for biased coin probabilities of .7 and above. In all cases where minimization showed superior overall balance for a fixed biased coin probability, the fifth percentile of the P-values for the imbalance tests was near or above the prespecified threshold for MSB of .3. As a result, it should be interpreted that both methods were effective at controlling imbalance using biased coin probabilities of .7, .8, .9, and 1.0. This is because imbalances P-values below .3 were rare (ie, present less than 5% of the time) using both methods. In addition to MSB having superior or equal balance when compared to minimization for a fixed biased coin probability, the loss of efficiency when balancing 11 covariates compared to 5 was less significant when using MSB than when using minimization. Thus, MSB is better able to control imbalance on many covariates than is minimization.
In this study, MSB consistently performed well at balancing continuous covariates. Minimization balanced categorical variables to a much greater degree than continuous variables when biased coin probability was fixed, resulting in better balance of categorical covariates across treatment arms. It should be noted that Kuhn et al24 have shown that when deterministic minimization is used with four categorical covariates, minimization asymptotically controlled serious imbalances better than the MSB method. However, minimization is commonly used with continuous covariates11,34–36 and deterministic treatment assignments are discouraged in practice. In this study, minimization did not perform well at balancing continuous covariates. The reason for this is because, although covariates are balanced according to the categorical form of the variables, balance is measured at the continuous scale.10 Polychotomization required in the minimization method contributes to a major loss of efficiency when controlling imbalance in continuous variables. In this study, continuous variables were polychotomized at quartiles into four approximately equally-sized groups. Polychotomization of continuous variables is generally a subjective process and is not applied consistently in clinical trials.11 Some clinicians use preliminary data to inform the process of polychotimization, yet often dichotimization or some other form of polychotomization is performed with little consistency across trials. In this study, authors considered using two and four categories with different cut points for dichotomization and results were generally similar. However, some variables showed better balance with two categories and others showed better balance with four categories. On average, however, balance was somewhat better with four categories and these results are presented in Tables 1–3.
MSB is less sensitive to selection bias than minimization because the correct guess probability is extremely low for all biased coin probabilities considered. Thus, if clinicians become unblinded, major selection bias can take place in minimization-based trials. Pure randomization is an important aspect of a clinical trial which can protect against imbalance, especially on unknown or unobserved prognostic variables. However, this study found that when minimization is used for assigning subjects to treatments, less than 20% of treatment assignments are completely random.
The simulation study on MSB is a guide for researchers on how to manage the tradeoff between allocation randomness and covariate balance when implementing MSB (see Table 4). To reduce the potential for selection bias, the P-value cutoff should be made as small as possible (assuming P-values are used to make decisions in the MSB method) to avoid potential for serious imbalances. The P-value cutoff of 0.3 was used in this study for all simulations, unless otherwise specified. This was done to keep all or almost all covariate imbalance P-values above 0.2 because these are considered minor imbalances.14 However, even if a P-value cutoff were set to 0.4, the allocation randomness would be much greater for MSB than for minimization.
The MSB method of covariate balance coincides with the philosophical reason for balancing covariates: completely random design is ideal, but not feasible for small clinical trials and interim analyses. Thus, MSB does not interfere with randomization unless there is a serious imbalance. In addition, MSB is not recommended over completely random design for large sample sizes (greater than 500 subjects) when random occurrence of serious imbalances is unlikely. However for interim analyses of large clinical trials, MSB can help guarantee that a decision to stop for futility or efficacy is based upon strong inference.
With small or medium sample sizes, MSB proves to be a covariate balance method that is more effective at balancing covariates and more effective at maintaining allocation randomness, when compared to minimization. Minimization seeks to balance even the most minimal differences between treatment groups and does so by minimizing the overall imbalance, becoming less effective when the number of covariates increases. In addition, minimization does not have the flexibility that is present in MSB. Although the MSB method proposed by Zhao et al14 is relatively new, it has been used in clinical trials such as in the ESCAPE trial40 and in the SHINE trial16 and may be used more widely as research is conducted on the limitations of stratified permuted blocks and minimization.
Permutation tests suggest that type I error rates were preserved in general, for each of the randomization methods considered. However, further exploration to examine the effect that each method might additionally have on the power and bias in estimates of treatment effects is warranted. This exploration is especially important, because sample size and power calculations typically assume a completely random design, which may not be appropriate if minimization or MSB methods are used for randomization. This is currently being explored and the results will be presented in subsequent publications. Additional investigations will extend these results to the case of unequal allocations. In doing so, a more global comparison of minimization and MSB may be observed in order extend the results found to the analysis phase of a trial and to cases of unequal allocation to further showcase properties of MSB as they compare to other commonly used methods of covariate-adaptive randomization.
ACKNOWLEDGEMENTS
This work was funded, in part, by the National Institutes of Health (NCATS grant # UL1-TR001450, NIAMS grant # P30-AR072582, NIGMS grant # U54-GM104941 and P20GM109040), the NIH/NINDS grants U01NS0059041 (NETT), and U01NS087748 (StrokeNet).
Footnotes
DATA AVAILABILITY STATEMENT
Data that support the findings of this study can be purchased from the National Technical Information Service (http://www.ntis.gov/).
REFERENCES
- 1.Mcentegart DJ. The pursuit of balance using stratified and dynamic randomization techniques: an overview. Drug Inf J. 2003;37(3):293–308. 10.1177/009286150303700305. [DOI] [Google Scholar]
- 2.Group EMA. Use C for MP for H. Guideline on Adjustment for Baseline Covariates in Clinical Trials; 2015. [Google Scholar]
- 3.Berger VW. Selection Bias and Covariate Imbalances in Randomized Clinical Trials. Chichester, UK: John Wiley & Sons, Ltd.; 2005. [Google Scholar]
- 4.C R, Torgerson D. Understanding controlled trials: baseline imbalance in randomised controlled trials. BMJ. 1999;319(185):1. [DOI] [PMC free article] [PubMed] [Google Scholar]
- 5.Lin Y, Zhu M, Su Z. The pursuit of balance: an overview of covariate-adaptive randomization techniques in clinical trials. Contemp Clin Trials. 2015;45:21–25. 10.1016/j.cct.2015.07.011. [DOI] [PubMed] [Google Scholar]
- 6.Taves DR. Minimization: a new method of assigning patients to treatment and control groups. Clin Pharmacol Ther. 1974;15(5):443–453. 10.1002/cpt1974155443. [DOI] [PubMed] [Google Scholar]
- 7.Pocock SJ, Simon R. Sequential treatment assignment with balancing for prognostic factors in the controlled clinical trial. Biometrics. 1975;31(1):103–115. [PubMed] [Google Scholar]
- 8.Taves DR. The use of minimization in clinical trials. Contemp Clin Trials. 2010;31(2):180–184. 10.1016/j.cct.2009.12.005. [DOI] [PubMed] [Google Scholar]
- 9.McPherson GC, Campbell MK, Elbourne DR. Use of randomisation in clinical trials: a survey of UK practice. Trials. 2012;13:1–7. 10.1186/1745-6215-13-198. [DOI] [PMC free article] [PubMed] [Google Scholar]
- 10.Berger VW. Minimization, by its nature, precludes allocation concealment, and invites selection bias. Contemp Clin Trials. 2010;31(5):406 10.1016/j.cct.2010.05.001. [DOI] [PMC free article] [PubMed] [Google Scholar]
- 11.Berger VW. Minimization: not all it’s cracked up to be. Clin Trials. 2011;8:443 10.1177/1740774511409769. [DOI] [PubMed] [Google Scholar]
- 12.Proschan M, Brittain E, Kammerman L. Minimize the use of minimization with unequal allocation. Biometrics. 2011;67(3):1135–1141. 10.1111/j.l541-0420.2010.01545.x. [DOI] [PubMed] [Google Scholar]
- 13.Kuznetsova OM, Tymofyeyev Y. Preserving the allocation ratio at every allocation with biased coin randomization and minimization in studies with unequal allocation. Stat Med. 2012;31(8):701–723. 10.1002/sim.4447. [DOI] [PubMed] [Google Scholar]
- 14.Zhao W, Hill MD, Palesch Y. Minimal sufficient balance-a new strategy to balance baseline covariates and preserve randomness of treatment allocation. Stat Methods Med Res. 2015;24(6):989–1002. 10.1177/0962280212436447. [DOI] [PMC free article] [PubMed] [Google Scholar]
- 15.Sajobi TT, Singh G, Lowerison MW, et al. Minimal sufficient balance randomization for sequential randomized controlled trial designs: results from the ESCAPE trial. Trials. 2017;18:1–6. 10.1186/s13063-017-2264-1. [DOI] [PMC free article] [PubMed] [Google Scholar]
- 16.Johnston KC, Bruno A, Pauls Q, et al. Intensive vs standard treatment of hyperglycemia and functional outcome in patients with acute ischemic stroke: the SHINE randomized clinical trial. JAMA. 2019;322(4):326–335. 10.1001/jama.2019.9346. [DOI] [PMC free article] [PubMed] [Google Scholar]
- 17.Begg CB, Iglewicz B. A treatment allocation procedure for sequential clinical trials. Biometrics. 1980;36(1):81–90. [PubMed] [Google Scholar]
- 18.Atkinson AC. Optimum biased coin designs for sequential clinical trials with prognostic factors. Biometrika. 1982;69(1):61–67. [Google Scholar]
- 19.Group T National institute of neurological disorders and stroke rt-P stroke study. Tissue plasminogen activator for acute ischemic stroke. NEJM. 2005;333(24):1581–1587. 10.1056/NEJM199512143332401. [DOI] [PubMed] [Google Scholar]
- 20.Day S, Grouin J-M, Lewis JA. Achieving balance in clinical trials. Appl Clin Trials. 2005;13:41–43. [Google Scholar]
- 21.Atkinson AC. The comparison of designs for sequential clinical trials with covariate information. J R Stat Soc. 2002;165(2):349–373. [Google Scholar]
- 22.Atkinson AC. Faulty assumptions in Atkinson’s criteria for clinical trial design. J R Stat Soc. 2004;167(1):179–181. [Google Scholar]
- 23.Yu F. Randomization, stratification, and minimization. Principles of Clinical Trials: Bias and Precision Control. Switzerland: Springer Nature Switzerland AG; 2020:1–27. [Google Scholar]
- 24.Kuhn J, Sheldrick RC, Broder-Fingert S, et al. Simulation and minimization: technical advances for factorial experiments designed to optimize clinical interventions. BMC Med Res Methodol. 2019;19(1):239 10.1186/s12874-019-0883-9. [DOI] [PMC free article] [PubMed] [Google Scholar]
- 25.Ciolino JD, Martin RH, Zhao W, Jauch EC, Hill MD, Palesch YY. Covariate imbalance and adjustment for logistic regression analysis of clinical trial data. J Biopharm Stat. 2011;23(6):1383–1402. 10.1080/10543406.2013.834912. [DOI] [PMC free article] [PubMed] [Google Scholar]
- 26.Scott NW, McPherson GC, Ramsay CR, Campbell MK. The method of minimization for allocation to clinical trials. A review. Control Clin Trials. 2002;23(6):662–674. [DOI] [PubMed] [Google Scholar]
- 27.Hu F, Hu Y, Ma Z, Rosenberger WF. Adaptive randomization for balancing over covariates. Wiley Interdiscip Rev Comput Stat. 2014;6(4):288–303. 10.1002/wics.1309. [DOI] [Google Scholar]
- 28.Senn S Seven myths of randomisation in clinical trials. Stat Med. 2013;32(9):1439–1450. 10.1002/sim.5713. [DOI] [PubMed] [Google Scholar]
- 29.Zhao W, Everett CC, Weng Y, Berger VW. Guessing strategies for treatment prediction under restricted randomization with unequal allocation. Contemp Clin Trials. 2017;59(May):118–120. 10.1016/j.cct.2017.05.009. [DOI] [PubMed] [Google Scholar]
- 30.Berger VW. The reverse propensity score to detect selection bias and correct for baseline imbalances. Stat Med. 2005;24(18):2777–2787. 10.1002/sim.2141. [DOI] [PubMed] [Google Scholar]
- 31.Salama I, Ivanova A, Qaqish B. Efficient generation of constrained block allocation sequences. Stat Med. 2008;27:1421–1428. 10.1002/sim. [DOI] [PubMed] [Google Scholar]
- 32.Morris T Rank minimization with a two-step analysis should not replace randomization in clinical trials. J Clin Epidemiol. 2012;65(7):810–811. 10.1016/j.jclinepi.2012.02.005. [DOI] [PubMed] [Google Scholar]
- 33.Burman C On Sequential Treatment Allocations in Clinical Trials. Gothenburg, Sweden: Chalmers University of Technology; 1996. [Google Scholar]
- 34.Dean LT, Ransome Y, Frasso-Jaramillo L, et al. Drivers of cost differences between US breast cancer survivors with or without lymphedema. J Cancer Surv. 2019;13(5):804–814. 10.1007/s11764-019-00799-1. [DOI] [PMC free article] [PubMed] [Google Scholar]
- 35.Reilmann R, McGarry A, Grachev ID, et al. Safety and efficacy of pridopidine in patients with Huntington’s disease (PRIDE-HD): a phase 2, randomised, placebo-controlled, multicentre, dose-ranging study. Lancet Neurol. 2019;18(2):165–176. 10.1016/S1474-4422(18)30391-0. [DOI] [PubMed] [Google Scholar]
- 36.Goadsby PJ, Dodick DW, Leone M, et al. Trial of galcanezumab in prevention of episodic cluster headache. N Engl J Med. 2019;381(2):132–141. 10.1056/NEJMoa1813440. [DOI] [PubMed] [Google Scholar]
- 37.Altman DG, Royston P. The cost of dichotomising continuous variables. Br Med J. 2006;332(7549):1080. [DOI] [PMC free article] [PubMed] [Google Scholar]
- 38.Johnson A Tissue plasminogen activator for acute ischemic stroke. N Engl J Med. 1995;333(24):1581–1587. [DOI] [PubMed] [Google Scholar]
- 39.Hasegawa T, Tango T. Permutation test following covariate-adaptive randomization in randomized controlled trials. J Biopharm Stat. 2009;19(1):106–119. 10.1080/10543400802527908. [DOI] [PubMed] [Google Scholar]
- 40.Goyal M, Demchuk AM, Menon BK, et al. Randomized assessment of rapid endovascular treatment of ischemic stroke. N Engl J Med. 2015;372(11):1019–1030. 10.1056/NEJMoa1414905. [DOI] [PubMed] [Google Scholar]