Abstract
Purpose:
Spatial and temporal patterns of response of human glioblastoma to fractionated chemoradiation are described by changes in the bioscales of residual tumor volume, tumor cell volume fraction and tumor cell kill, as derived from tissue sodium concentration measured by quantitative sodium magnetic resonance imaging at 3 Tesla. These near real-time patterns during treatment are compared with overall survival.
Methods:
Bioscales were mapped during fractionated chemoradiation therapy in patients with glioblastomas (n=20) using tissue sodium concentration obtained from serial quantitative sodium magnetic resonance imaging at 3 Tesla and a two-compartment model of tissue sodium distribution. The responses of these parameters in newly diagnosed human glioblastomas undergoing treatment were compared to times to disease progression and survival.
Results:
Residual tumor volume following tumor resection showed decreased cell volume fraction due to disruption of normal cell packing by edema and infiltrating tumor cells. Cell volume fraction showed either increases back towards normal as infiltrating tumor cells were killed, or decreases as cancer cells continued to infiltrate and extend tumor margins. These highly variable tumor responses showed no correlation with time to progression or overall survival.
Discussion:
These bioscales indicate that fractionated chemoradiotherapy of glioblastomas produces variable responses with low cell killing efficiency. These parameters are sensitive to real-time changes within the treatment volume while remaining stable elsewhere, highlighting the potential to individualize therapy earlier in management, should alternative strategies be available.
Keywords: glioblastoma, chemoradiation, sodium, MRI, human, cell kill
Statement of Translation Relevance
Quantitative sodium MR imaging and the two-compartment model of sodium distribution in the brain provide biologically relevant objective measures of residual tumor volume, cell volume fraction and tumor cell kill in near real-time during chemoradiation of human glioblastomas. The variable responses and low efficiency of cell kill were not prognostic of survival time or time to first disease progression but were consistent with the failure of this treatment and the need for subsequent treatment including multiple surgical resections. These parameters offer a means of tailoring patient management to real-time biological responses of tumors to treatment and may justify changing management if alternative treatments are available. These parameters may also offer better treatment outcome measures for clinical trials, measuring biological response of the tumor to the specific therapy rather than its contribution to the global outcome of patient survival.
Introduction
Glioblastoma is the most common malignant primary brain tumor in adults, classified as grade IV by the World Health Organization (WHO). This infiltrating astrocytic tumor retains an abysmal prognosis of less than 5% survival at 5 years [1,2] despite decades of research and multiple clinical trials and despite trimodal treatment with surgery, radiation and chemotherapy. Prognosis depends on clinical and genetic factors as well as extent of resection and adjuvant treatment [2,3]. However, glioblastoma is a heterogeneous entity with four genetically characterized subtypes (classical, mesenchymal, proneural and neural) exhibiting different behaviors and treatment responses [4]. Despite the genetic complexity, all glioblastomas are treated with the same protocol.
The infiltrating nature of this tumor has been known for decades [2,5,6]. Pre-treatment biopsies aligned with contrast enhanced MRI images have shown that significant numbers of viable tumor cells infiltrate the non-enhancing tissue beyond the enhancing tumor [7]. Such infiltrating behavior explains why residual tumor volume (RTV) has been reported as a better prognostic indicator than the extent of resection [8]. The biology of glioblastoma has been reviewed elsewhere [6,9,10].
The low sensitivity of sodium MR imaging [11–16], required 3 Tesla clinical MR scanners [17] and efficient twisted projection imaging acquisitions [18] to make human applications feasible. The quantification of the MR signal was an important advancement to obtain metabolic information [21] that was validated in animal models of normal brain tissue [22] and brain tumors [23]. Quantification has now been reported in human brain by a number of groups [reviewed in 20].
Changes in tissue sodium ion concentration provide information about tissue viability and microstructure [21]. The two-compartment model allows the MR-based measurement of tissue sodium concentration (TSC) to be interpreted as cell volume fraction (CVF), a tightly conserved parameter of adult brains across normal ageing [22]. Tumors disrupt normal cell packing and have an expanded extracellular matrix with reduced CVF, as confirmed by a number of techniques [23, reviewed in 20]. The difference in CVF between brain parenchyma and tumors provides an objective way to measure RTV as the infiltrated tissue surrounding the surgical resection site. As the measurements are quantitative, the temporal change in CVF within the changing RTV determines the tumor cell kill (TCK). The CVF of normal tissue away from the treatment site provides the internal control for the longitudinal reproducibility of the measurements.
Changes in RTV, CVF and TCK bioscales during treatment as derived from TSC measurements from quantitative sodium MR imaging on a 3 Tesla clinical scanner are now reported for assessment of the therapeutic efficiency of intensity modulated radiation therapy with concurrent temozolomide chemotherapy in the residual tumor bed following resection of human glioblastoma. These parameters indicate that this treatment produces highly variable tumor cell kill that does not correlate with survival. The low efficiency of tumor cell kill emphasizes the need for better treatment protocols.
Material and Methods
Demographics:
Patients (N=20; age = 58.6±8.6 years) with new diagnosis of primary glioblastoma (WHO grade IV) signed consent forms approved by the IRB using the rules of the Declaration of Helsinki, the Belmont Report and the U.S. Common Rule for entry into this protocol for quantitative sodium MR imaging at 3.0 Tesla during chemoradiation treatment with clinical follow-up. All but two patients had undergone surgical resection shortly (n=18, 35±12 days) prior to radiation treatment and all were treated with fractionated radiation (60Gy over 6 weeks delivered on 5 out of 7 days with 2Gy fractions with only small variations) with low dose concurrent chemotherapy (temozolomide) given as per standard dosing schedule of 75mg/m2 daily. Tumors were distributed between the cerebral hemispheres (frontal 4, parietal 6, temporal 8, occipital 2) without involving deep brain structures, brainstem or cerebellum. Patients were followed until death with survival time (days) taken from the date of resection (n=18) or first radiation treatment if not resected (n=2). The Karnofsky performance scores (KPS) were assessed prior to radiation as greater than 70 for all subjects (KPS=87±10). Only limited genetic marker results were available at the time of this study. The MGMT methylation status was negative for all but four participants. The IDH1 status was negative for 15 participants and not tested in the remaining 5 subjects. The chemotherapy following radiation included adjuvant temozolomide (150-200 mg/m2), but was variable across patients following recurrence but most often included bevacizumab. Repeat resections were performed in some patients (n=8).
Imaging Protocol:
All MR imaging was performed on a 3 Tesla clinical scanner (Signa HDx, GE Healthcare, Milwaukee, WI) equipped for sodium imaging and conventional multi-channel proton imaging. The sodium radiofrequency (RF) coil was a high-pass, single-tuned, quadrature, birdcage, head volume coil (26cm diameter, 8 rung) that could be exchanged, without moving the patient’s head, with a geometrically identical proton RF coil that allowed B0 shimming and mapping to correct magnetic field inhomogeneities [19]. Exchanging coils was accomplished using a cantilevered head support that was independent of the RF coils yet centered the patient’s head within the coils.
The three-dimensional (3D) flexible twisted projection imaging (flexTPI) provided an efficient acquisition pulse sequence with minimum TE (0.26ms) in less than 10 minutes, as described elsewhere [19]. Image reconstruction was performed after gridding the projection time domain data onto a Cartesian grid and fast Fourier transformation as described in detail elsewhere [18,19]. The sodium signal quantification was performed using an imaging protocol that included B0 and B1 correction for the inhomogeneities in signal sensitivity across the field of view, described elsewhere [18,19]. The calibration phantom was a plastic sphere (16cm diameter) containing three calibration cylinders (30, 70 110 mM NaCl in 3% agar surrounded by KCl, 60mM) that had the same electrical loading as a human head, and was imaged separately under the same imaging conditions as the patient.
The protocol over the 6-week chemoradiation treatment period included pre- and post-radiation imaging examinations and between one to three additional imaging examinations during this period depending on patient tolerance (6 studies in 1 patient, 5 studies in each of 2 patients, 4 studies in each of 9 patients, 3 studies in each of 7 patients, 2 studies only in one patient).
Bioscale Determination:
Image processing was performed using customized software (MathLab R2015b, Natick, MA) with B0 and B1 correction for both human and phantom images, followed by quantification by combining the linear three-point calibration from the phantom with the human images to obtain the TSC bioscale maps [21,25]. Bioscales from the multiple imaging sessions were aligned for each patient using a previously reported alignment strategy that avoids additional image blurring [26]. Using the two-compartment model [19,20,25], the TSC maps were converted to CVF bioscale maps, as discussed below.
Bioscale Analysis:
Multiple (n=3 to 6) TSC bioscale maps of each subject were analyzed for patterns of temporal and spatial changes during the course of radiation treatment using regions of interest (ROI) placed over the tumor and over normal brain tissue away from the treatment site to generate histograms of these regions. The pre-radiation maps served as the baseline histograms for establishing the boundary threshold between normal tissue and the surgical bed. Descriptive statistics (mean, standard deviation SD) established a filter range (filter range = 2SD, i.e., 24<TSC<44mM) for normal tissue (TSC mean = 34±5mM) with a wider filter range (44<TSC<80mM) for tumor (TSC mean = 56±4mM). This threshold of 44mM between tumor and normal parenchyma allowed RTV boundaries to be determined objectively within a rapidly selected ROI, without intensive manual segmentation. This boundary of two standard deviations (±10mM) from the mean value of normal tissue covered sites of likely progression as 90% of recurrence is within 2cm of surgical margins [27].
The two-compartment model assumed intracellular and extracellular sodium concentrations of 12mM (Ci) and 145mM (Ce), respectively, [20] such that:
| {1} |
Although proliferating cells have a higher intracellular sodium concentration than normal tissue, the resultant error is small (~3%) even after doubling this concentration. This small error reflects the much smaller intracellular concentration to the extracellular concentration [20]. Tumor cell kill (TCK) maps were calculated as the fractional difference between the product of initial and final values of RTV (RTVTi and RTVTf, respectively) and CVF (CVFTi and CVFTf, respectively) divided by the product of the RTVTi and CVFTi.
| {2} |
When RTVTf . CVFTf < RTVTi . CVFTi, then 0<TCK < 1 and net tumor cells have been killed. However, when RTVTf . CVFTf > RTVTi .CVFTi, then TCK < 0, indicating that the tumor has progressed with a net gain of cells.
Statistical Analysis:
Linear regressions of changes in TSC, RTV, CVF and TCK as a function of chemoradiation duration were performed separately for each patient. Patients were then divided into Groups 1 and 2 based on decrease and increase in RTV across radiation treatment, respectively, as determined by the negative or positive Pearson coefficients of these regression analyses. Student t-tests, (two-tail, p<0.05 for significance) were used to examine statistical significance of these Pearson coefficients and any differences between the two groups for each of the bioscales, time to first tumor progression and survival. The mean CVF and any change in CVF during treatment in the normal brain away from the treatment site served as an internal control for the stability of the quantification methodology for each patient across multiple examination sessions. Additional correlations were examined between initial tumor RTV, CVF and TCK and survival.
Bioscale Modeling:
The CVF of tumors is much lower than normal brain decreasing from normal tissue (CVF~0.82) at the margin of the tumor to the center of the tumor (CVF~0.55) [28] as illustrated in Figure 1. The RTV in the margin around a surgically resection is infiltrated by tumor cells, inflammation and edema that disrupt normal cell packing (Figure 1a). Surgical resection removes the bulk tumor leaving a cerebrospinal fluid (CSF)-filled cavity (Figure 1b). The desirable response to fractionated chemoradiation treatment is killing of tumor cells with reduced inflammation and edema, resulting in CVF increasing back towards normal values (Figure 1c) with a reduction in volume of the resection cavity. Unsuccessful treatment results in widening infiltration of the tumor that further lowers CVF and expands the RTV (Figure 1d). Although peripheral radiation necrosis may also disrupt normal tissue and expand the volume of abnormal CVF, such radiation changes are only seen on a longer time scale following chemoradiation treatment.
Figure 1.
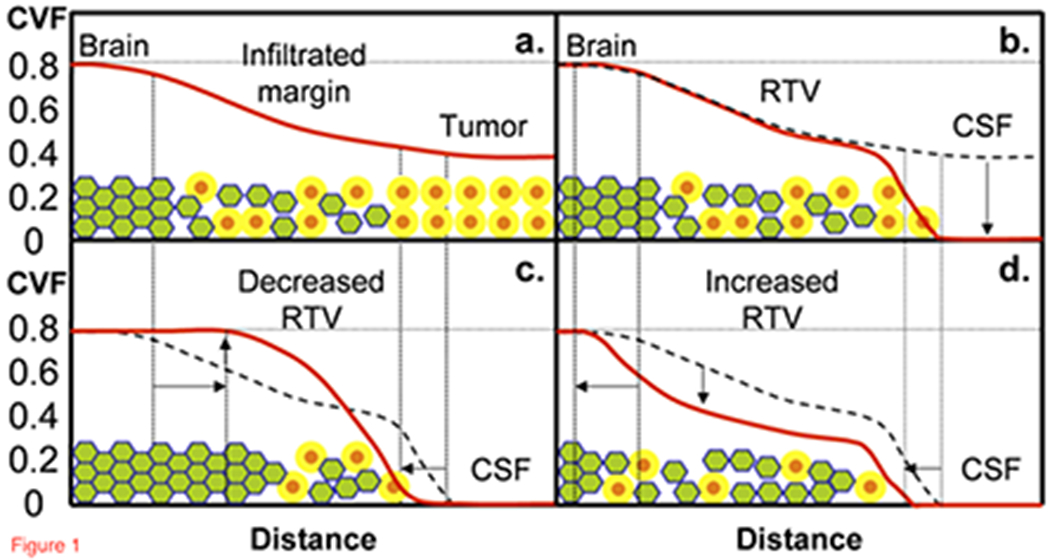
Model for the profile (solid red line) of CVF from normal brain tissue through to the center of the glioblastoma. (a.) Prior to partial surgical resection, CVF in normal brain (CVF=0.82) decreases through the infiltrated margin into the tumor mass (CVF = 0.54 to 0.58). (b.) After surgical resection removes the central tumor mass, CVF is reduced to zero in the CSF-filled cavity but tumor remains in the infiltrated margins known as the residual tumor volume (RTV). The responses to radiation treatment are either (c.) decreasing RTV as the infiltrating tumor is killed and the brain tissue reorganizes with CVF returning towards normal, or (d.) increasing RTV as the unresponsive tumor continues infiltrating and further disrupting normal packing thereby decreasing CVF over a larger volume. The green filled hexagons are well-packed brain cells with a thin extracellular matrix (blue lines around green brain cells), orange filled circles are neoplastic cells with a larger yellow extracellular matrix (yellow annulus around orange tumor cells).
Results
Table I shows the similar demographics for Groups 1 and 2 including age, sex, initial Karnofsky performance scores, number of repeated resections and overall survival times which were not distinguishable statistically (p>0.1). Three of the four MGMT methylation positive subjects belonged to group 1 but numbers were too low to apply statistical comparisons based on genetic differences.
Table I.
Demographics of the patient population in Group 1 (decrease in RTV during chemoradiation) and Group 2 (increase in RTV during chemoradiation) and overall survival. No statistically significant differences were found.
| Group | Age in years (Mean ± SD) | Gender (M:F) | Tumor Grade | Number | Initial KPS | Repeat Resections | Survival (days) |
|---|---|---|---|---|---|---|---|
| 1 | 60 ± 10 | 5:6 | IV | 11 | 86 ± 11 | 4 | 469±385 |
| 2 | 57 ± 7 | 6:3 | IV | 9 | 91 ± 8 | 5 | 514±332 |
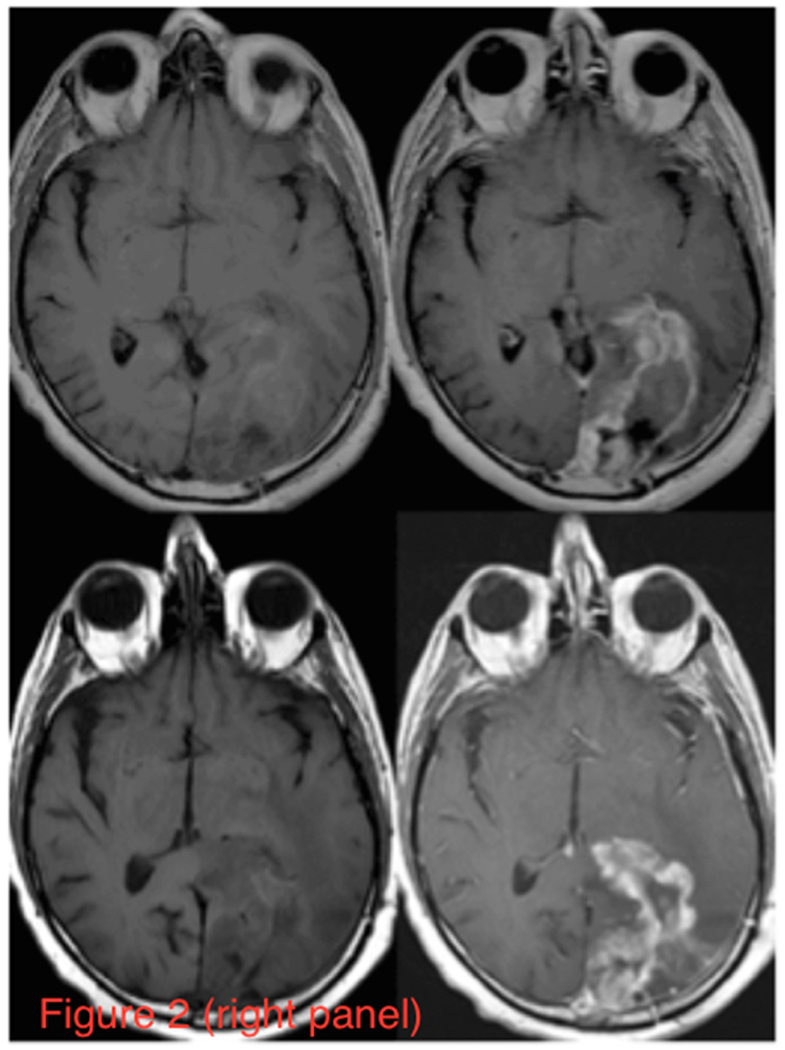
Figure 2 (Left Panel) shows axial partitions from the 3D TSC bioscales through the head of a representative patient prior to (a) and following (b) chemoradiation. The extent of the RTV in the left cerebral hemisphere is reduced with contraction of the resection cavity during chemoradiation treatment. The axial proton images, pre- and post-intravenous gadolinium-based contrast before and after radiation treatment, are shown in Figure 2 (Right Panel). These proton images confirm the decrease in volume of the resection cavity. Although the thick enhancing margins are suspicious for residual tumor, such anatomical images provide no quantitative information about tumor response. Figure 3a shows two representative TSC partitions from Figure 2 (Left Panel, last two partitions on right top row) on which the RTV was determined objectively (gray voxels surrounding the surgical cavity) using the tumor TSC filter (44mM<TSC<80mM) to exclude the central CSF-filled surgical cavity and peripheral normal tissue. The histograms of the TSC values in the RTV and normal control tissue away from the treatment site are shown in Figure 3b. The 44mM boundary (vertical dashed line) separating normal and tumor-infiltrated tissue defined the boundary threshold between normal and abnormal CVF. Whereas the control tissue (solid circles) shows a narrow distribution, the tumor (solid triangles) shows a much broader distribution, consistent with partial volume effects and heterogeneity in microstructure of tumor margins compared to normal brain tissue.
Figure 2.
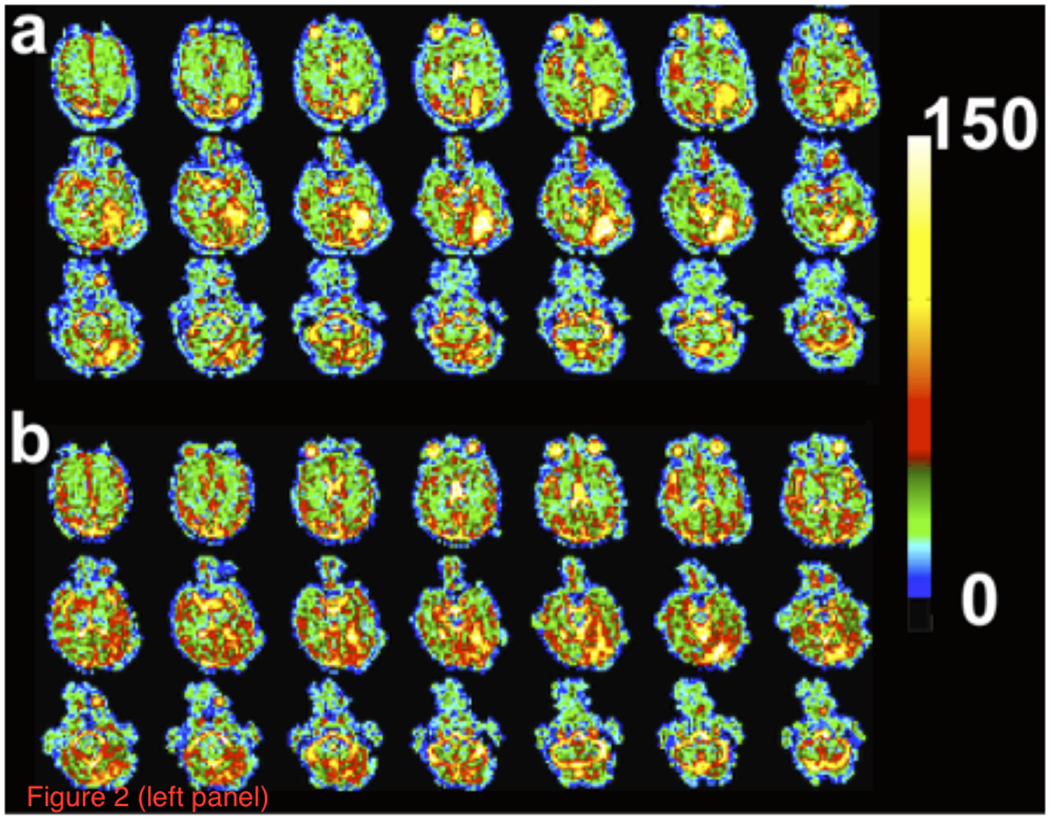
Sodium and proton MR imaging of a representative patient with a resected glioblastoma in the inferior left temporo-occipital region. (Left Panel) Axial partitions of the 3D TSC bioscale of a patient showing increased sodium concentration in the surgical resection site (a) before and (b) after standard chemoradiation treatment. Color scale at right is in units of mM. Note that two partitions on the far right on the top row of Figures 1a and 1b are the partitions displayed in Figure 3.
(Right Panel) T1 weighted images pre- (left column) and post- (right column) intravenous administration of gadolinium contrast for the same patient (upper row) prior to and (lower row) following chemoradiation treatment. The left cerebral hemisphere shows the surgical cavity filled with CSF and surrounding tissue with elevated TSC from tumor infiltration and edema. Radiation treatment shrinks the cavity, but the residual tumor persists in the margins.
Figure 3.
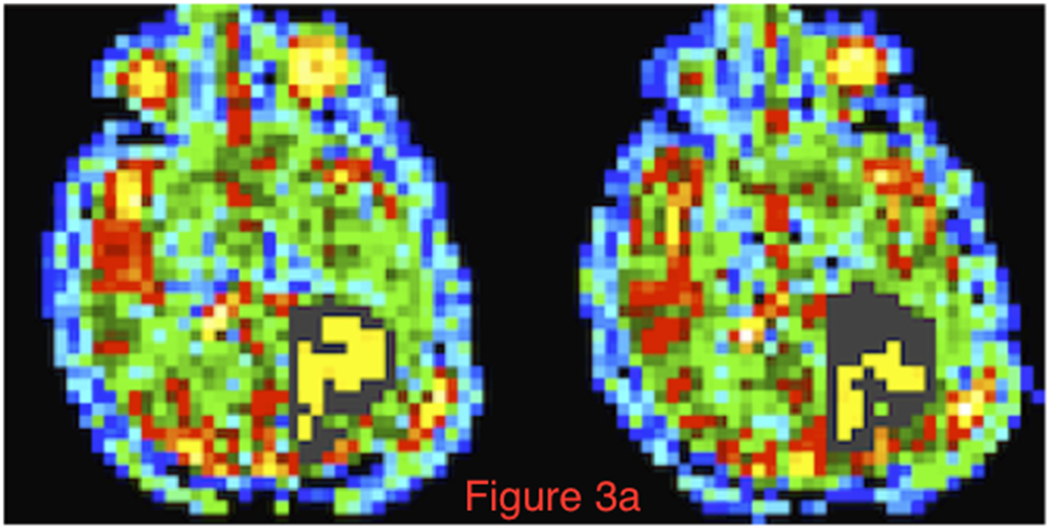
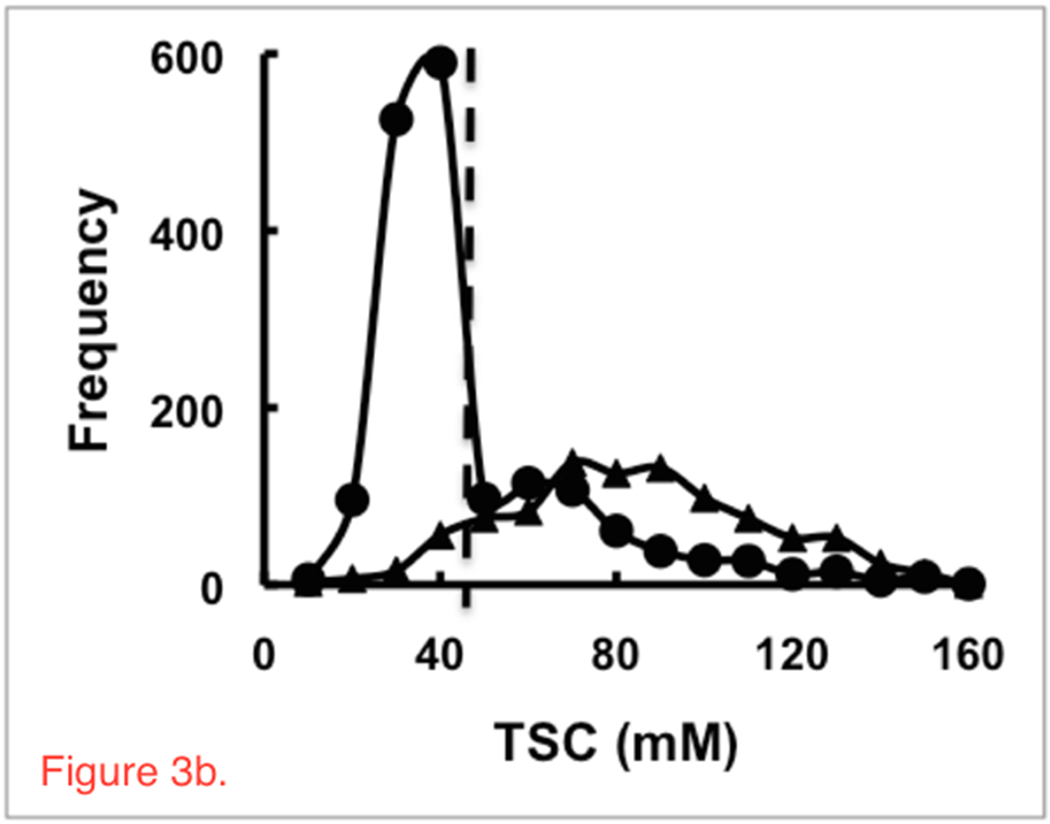
Methodology of the sodium image analysis. (a) Two representative axial partitions from the 3D TSC bioscale of the same patient as in Figure 2 prior to radiation treatment showing the semi-automated selected RTV region (gray area) around the surgical cavity in the left temporo-occipital region. These two partitions are the same far right partitions on the top row of Figures 1a and 1b. (b). Histograms of TSC (mM) in normal brain tissue (solid circles) and tumor (solid triangles) defined the boundary of the peripheral margin (44mM, two standard deviations from normal TSC = 34mM, vertical dashed line) of the RTV. The skew of the normal TSC distribution is due to the partial volume effect of voxels containing both tissue and CSF with the large voxel size (nominal 5x5x5 mm3) of the spherical projection acquisition used for quantitative sodium MR imaging at 3 Tesla.
Table II shows Groups 1 and 2 differences in changes in the bioscales of CVF, RTV and TCK for the treatment site, time to disease progression and CVF of control tissue away from the radiation treatment sites. Regression analyses of CVF in control regions across the multiple sessions of chemoradiation treatment for each patient in each group showed longitudinal stability (Group 1: CVF=0.81±0.01; Group 2: CVF=0.82±0.03) with no statistical difference (p>0.1) across time for each patient and between groups. In contrast, the CVF values for the RTV (Group 1: CVF=0.57±0.03; Group 2: CVF=0.53±0.04) were statistically lower (p<0.001) than those of normal regions for each and all patients. There were no significant (p>0.1) differences in initial residual tumor volumes or in the linear regressions of change in RTV and TCK as a function of time to first progression (Group 1: R<0.5, p>0.1; Group 2: R<0.3, p>0.1) for either group despite differences reflected in the bioscales. Hence, despite Group 2 having a statistically significant increase (p<0.0002) in RTV and decreased (p<0.00005) TCK compared to Group 1, the difference in time to progression was not significant. The large variances in these bioscales reflect heterogeneity in tumor responses. The two groups show significant differences for the CVF (p<0.05) within the tumor-infiltrated volumes. The negative value for fractional TCK for Group 2 indicated tumor expansion with increases of the RTV during treatment.
Table II.
Therapeutic responses in bioscales for Groups 1 and 2 to chemoradiation as indicated by initial RTV, changes in RTV and CVF, fractional TCK and time to first disease progression.
| Group | Brain Region | CVF | Initial RTV (ml) | RTV Change (ml) | RTV Change (%) | Fractional TCK | Progression Time (days) (Mean±SD) |
|---|---|---|---|---|---|---|---|
| 1 | Tumor | 0.57±0.03* | 47±37 | −17±16# | −34±23# | +0.31±0.22## | 205±191 |
| Control | 0.81±0.01** | - | - | - | - | ||
| 2 | Tumor | 0.53±0.04 | 37±21 | +39±25# | +98±91# | −0.80±0.66## | 283±432 |
| Control | 0.82±0.03** | - | - | - | - |
p<0.05 for comparison of tumor CVF between Groups 1 and 2,
p<0.001 for comparison of CVF of Tumor to Control within each Group,
p<0.0002 for comparison of change in RTV between Groups 1 and 2,
p<0.00005 for comparison of fractional TCK across chemoradiation for Groups 1 and 2.
Figure 4a shows regression plots of CVF during radiation treatment for two representative patients showing either statistically significant (R>±0.95, p<0.04) decrease (solid circles, dashed line) or increase (solid squares, dotted line) in CVF in the RTV compared to a stable CVF in normal tissue (open circles and squares, solid lines). The patient with a significant increase in CVF within the RTV showed decreasing RTV while the patient with a decrease in CVF showed increasing RTV (Figure 4b). Similar plots for all patients with significant changes in RTV are given in the Supplementary Materials (Figure S1).
Figure 4.
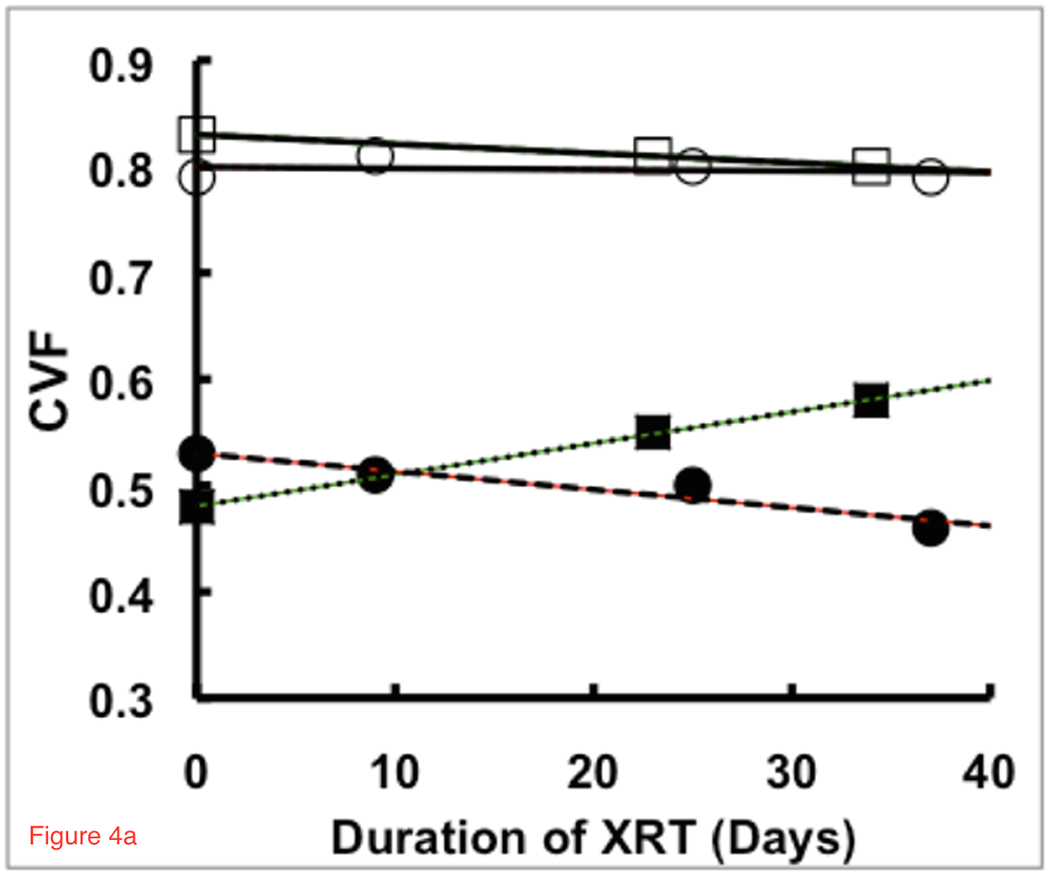
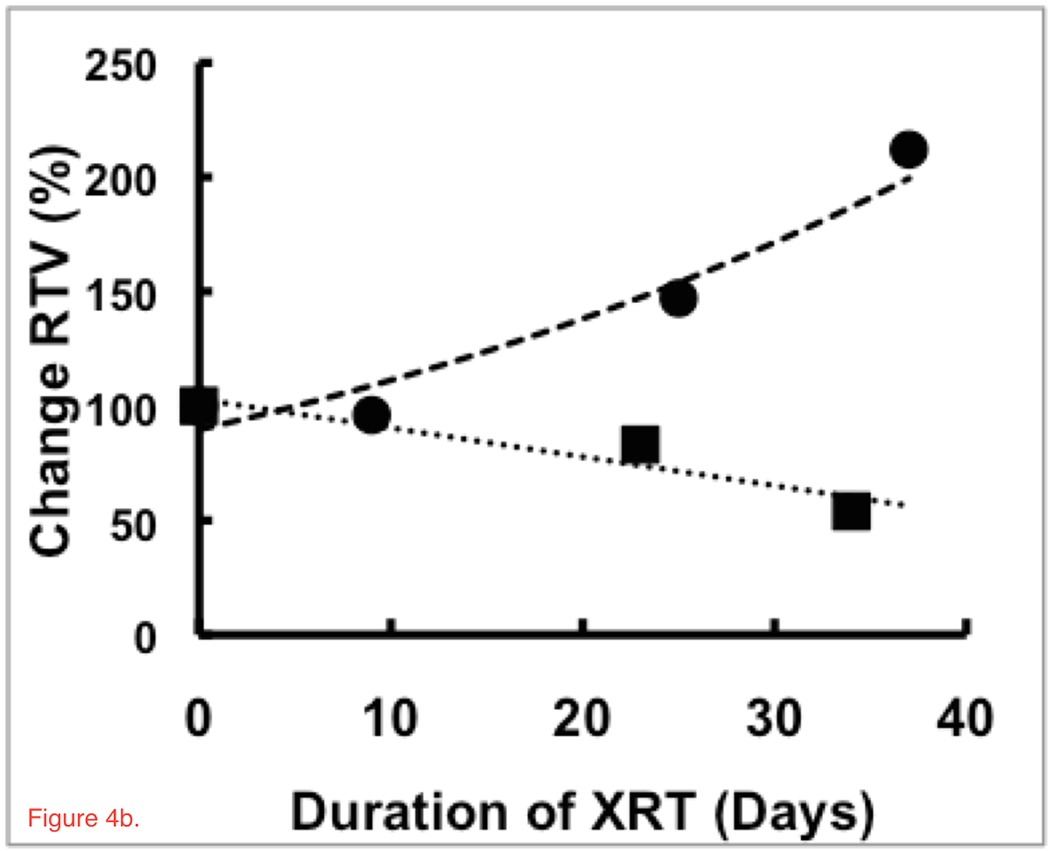
Trends in (a) CVF and (b) RTV for treatment regions of two patients with responses that show statistically significant (R>±0.95, p<0.04) increases (solid squares, dotted line) and decreases (solid circles, dashed line) in CVF during chemoradiation treatment whereas the control regions remain stable (open squares and circles, solid lines). These patients showed significant inverse responses between RTV and CVF, matching the model in Figure 1. The patient with the decrease in CVF had an increasing RTV and a survival time of 344 days. The patient with an increasing CVF and decreasing RTV returning towards normal values had a longer survival time of 547 days. These patients were of similar age with similar sized glioblastomas initially but showed very different responses and survival under the same treatment protocol.
Discussion
The continued abysmal prognosis of glioblastoma indicates that the current aggressive and costly trimodal treatment of surgery, radiation and chemotherapy is inadequate for cure.
The results of this study indicate that fractionated chemoradiation has a widely variable effectiveness in destroying glioblastoma cells which may be reflected in the widely variable survival times (Group 1: 469±385 days; Group 2: 514±332 days). The range of TCK varied greatly, from values as high as 80% for one patient (Group 1: mean TCK= +31±0.22%; mean RTV decrease = 34±23%) while other tumors continued to grow increasing tumor volume by as much as almost 100% (Group 2: mean TCK= -80±66%; mean RTV increase = 98±91%) across the 6 weeks of treatment. Changes in CVF, TCK and RTV during fractionated chemoradiation were not correlated with patient prognosis, either as days of survival or in days to disease progression. This great variability is not a result of inaccurate measurement, as the control regions away from radiation treatment showed persistently accurate values with little biological variation (<1%) across the multiple studies of each patient and among patients. Rather, the large biological variances in the treatment region must reflect the highly variable responses of these tumors to treatment, possibly reflecting the heterogeneity in the four subtypes of glioblastoma (classical, mesenchymal, proneural, neural) in this cohort. The genetic information was limited for this cohort and insufficient for statistical analysis.
The variability within the treatment volume, but not the control region during the six-week treatment protocol suggests that these bioscales are responsive in real-time to biological processes occurring during fractionated chemoradiation. The temporal changes in the bioscales during radiation show consistent trends for individual patients indicating that the biological changes are monotonic and not random. The low efficiency of cell kill for many of the patients may explain the apparent lack of prognostic value of these parameters in this setting and is consistent with the poor outcome of glioblastoma. Presumably, subsequent events in the clinical course and in the variable genetics of the remaining tumor cells have greater impact on survival time than the fractionated chemoradiation. The repeated resections also reflect the poor response to this therapy.
The poor cell kill of tumor cells within the brain by fractionated chemoradiation is at odds with in vitro studies of cell suspensions where even low dose radiation is effective. This difference in efficiency supports the need for in vivo measurements to understand therapeutic response. Clinical trials often use global outcome measures of survival to compare different treatment arms. Bioscales that assess the treatment efficiency in real-time may provide a more economically favorable outcome measure, not only by shortening clinical trials but also for management of individual patients. The goal is to maximize TCK while normalizing CVF within the RTV for each patient. Treatment response can be monitored for each patient rather than employing the surveillance approach as in current practice. Treatments can be changed rapidly when a particular treatment fails to yield a favorable response (low TCK, increasing RTV, decreasing CVF) for a specific patient. Such personalize management should be more effective than using population based protocols from clinical trials.
Limitations of this study include the small number of patients, limited by funding that restricted recruitment to 3 years so that 3-year survival follow-up data would be available. Bioscales were measured only during the six weeks of chemoradiation whereas longer term quantitative sodium MR imaging, perhaps at the same time as the first follow-up proton clinical MR imaging may have been informative. These bioscales were not corrected for partial volume effects despite the low spatial resolution. However, such blurring of bioscale values is unlikely to result in the observed heterogeneous results. Patient tolerance of multiple MR imaging examinations during the already arduous commitment to fractionated chemoradiation treatment was variable. This may be of less concern if such imaging became a routine part of clinical practice, especially if an ineffective therapy was shortened. The specific genetics of the glioblastomas were not available for this cohort. The sodium-based bioscales were not compared to perfusion MR imaging parameters that have long been reported as being a useful indicator of tumor progression [29–31] as this modality is not used clinically during treatment.
The addition of radiation to gross total resection increased survival from 3-4 months to 7-12 months [5] and the addition of temozolomide chemotherapy further increased median survival to about 14.6 months [32]. As the follow-up chemotherapy increased survival times significantly, the lack of survival prediction based on early fractionated chemoradiation responsiveness measured by the sodium bioscales is not surprising. The fact that the bioscales are sensitive to radiation-induced tumor responses during treatment, including continued growth, suggests that these bioscales should be examined for real-time responses of subsequent chemotherapy. Such real-time responses could be used in individual patient management as well as in clinical trials of new treatments and for other tumor types.
An important aspect of this study is that the quantitative sodium MR imaging was performed on a busy clinical service by clinical MR technologists using a clinical 3T scanner, indicating that such measurements can be performed in a clinical environment without specialized personnel, once the hardware and software are made available.
Supplementary Material
Acknowledgments:
The authors acknowledge financial grant support from PHS NIH RO1 CA1295531A1.
Financial support: The authors acknowledge financial grant support from PHS NIH RO1 CA1295531A1.
Abbreviations:
- CSF
cerebrospinal fluid
- CVF
cell volume fraction
- EGFR
epidermal growth factor receptor
- FlexTPI
flexible twisted projection imaging
- IDH
isocitrate dehydrogenase
- IRB
institutional review board
- KCl
potassium chloride
- MGMT
O-6-methylguanine-DNA methyltransferase
- MR
magnetic resonance
- NaCl
sodium chloride
- RF
radiofrequency
- ROI
region of interest
- RTV
residual tumor volume
- TCK
tumor cell kill
- TE
time to echo
- TSC
tissue sodium concentration
- WHO
World Health Organization
- 3D
three-dimensional
Footnotes
Conflict of Interest Statement: The authors declare no potential conflicts of interest.
References cited:
- 1.McLendon RE, Halperin EC. Is the long-term survival of patients with intracranial glioblastoma multiforme overstated? Cancer 2003;98(8):1745–8. [DOI] [PubMed] [Google Scholar]
- 2.Mineo JF, Bordron A, Baroncini M, Ramirez C, Maurage CA, Blond S, et al. Prognosis factors of survival time in patients with glioblastoma multiforme: a multivariate analysis of 340 patients. Acta Neurochir (Wien) 2007;149(3):245–52. [DOI] [PubMed] [Google Scholar]
- 3.Lacroix M, Abi-Said D, Fourney DR, Gokaslan ZL, Shi W, DeMonte F, et al. A multivariate analysis of 416 patients with glioblastoma multiforme: prognosis, extent of resection, and survival. J Neurosurg 2001;95(2):190–8. [DOI] [PubMed] [Google Scholar]
- 4.Verhaak RG, Hoadley KA, Purdom E, Wang V, Qi Y, Wilkerson MD, Miller CR, et al. Cancer Genome Atlas Research Network. Integrated genomic analysis identifies clinically relevant subtypes of glioblastoma characterized by abnormalities in PDGFRA, IDH1, EGFR, and NF1. Cancer Cell 2010;17(1):98–110. [DOI] [PMC free article] [PubMed] [Google Scholar]
- 5.Young RM, Jamshidi A, Davis G, Sherman JH. Current trends in the surgical management and treatment of adult glioblastoma. Ann Transl Med 2015;3(9):121–36. doi: 10.3978/j.issn.2305-5839.2015.05.10. [DOI] [PMC free article] [PubMed] [Google Scholar]
- 6.Giese A, Bjerkvig R, Berens ME, Westphal M. Cost of migration: invasion of malignant gliomas and implications for treatment. J Clin Oncol 2003;21(8):1624–36. [DOI] [PubMed] [Google Scholar]
- 7.Eidel O, Burth S, Neumann JO, Kieslich PJ, Sahm F, Jungk C, et al. Tumor Infiltration in Enhancing and Non-Enhancing Parts of Glioblastoma: A Correlation with Histopathology. PLoS One 2017;12(1):e0169292. doi: 10.1371/journal.pone.0169292. eCollection 2017. [DOI] [PMC free article] [PubMed] [Google Scholar]
- 8.Grabowski MM, Recinos PF, Nowacki AS, Schroeder JL, Angelov L, Barnett GH, et al. Residual tumor volume versus extent of resection: predictors of survival after surgery for glioblastoma. J Neurosurg 2014;121(5):1115–23. [DOI] [PubMed] [Google Scholar]
- 9.Xie Q, Mittal S, Berens ME. Targeting adaptive glioblastoma: an overview of proliferation and invasion. Neuro Oncol 2014;16(12):1575–84. [DOI] [PMC free article] [PubMed] [Google Scholar]
- 10.Iacob G, and Dinca EB. Current data and strategy in glioblastoma multiforme. J Med Life 2009;2(4): 386–393. [PMC free article] [PubMed] [Google Scholar]
- 11.Feinberg DA, Crooks LA, Kaufman L, Brant-Zawadzki M, Posin JP, Arakawa M, et al. Magnetic resonance imaging performance: a comparison of sodium and hydrogen. Radiology 1985;156(1):133–8. [DOI] [PubMed] [Google Scholar]
- 12.Hilal SK, Maudsley AA, Ra JB, Simon HE, Roschmann P, Wittekoek S, et al. In vivo NMR imaging of sodium-23 in the human head. J Comput Assist Tomogr 1985;9(1):1–7. [DOI] [PubMed] [Google Scholar]
- 13.Perman WH, Turski PA, Houston LW, Glover GH, Hayes CE. Methodology of in vivo human sodium MR imaging at 1.5 T. Radiology 1986;160(3):811–20. [DOI] [PubMed] [Google Scholar]
- 14.Turski PA, Houston LW, Perman WH, Hald JK, Turski D, Strother CM, Sackett JF. Experimental and human brain neoplasms: detection with in vivo sodium MR imaging. Radiology 1987:163(1):245–9. [DOI] [PubMed] [Google Scholar]
- 15.Ra JB, Hilal SK, Oh CH, Mun IK. In vivo magnetic resonance imaging of sodium in the human body. Magn Reson Med 1988;7(1):11–22. [DOI] [PubMed] [Google Scholar]
- 16.Perman WH, Thomasson DM, Bernstein MA, Turski PA. Multiple short-echo (2.5-ms) quantitation of in vivo sodium T2 relaxation. Magn Reson Med 1989;9(2):153–60. [DOI] [PubMed] [Google Scholar]
- 17.Thulborn KR. Clinical rationale for very high field (3.0 Tesla) functional MR imaging. Topics Magn Reson Imaging 1999;10:37–50. [DOI] [PubMed] [Google Scholar]
- 18.Boada FE, Gillen JS, Shen GX, Chang SY, Thulborn KR. Fast three dimensional sodium imaging. Magn Reson Med 1997;37(5):706–15. [DOI] [PubMed] [Google Scholar]
- 19.Lu A, Atkinson IC, Claiborne TC, Damen FC, Thulborn KR. Quantitative sodium imaging with a flexible twisted projection pulse sequence. Magn Reson Med 2010;63(6):1583–93. [DOI] [PMC free article] [PubMed] [Google Scholar]
- 20.Thulborn KR. Quantitative sodium MR imaging: A review of its evolving role in medicine. Neuroimage. 2018;168:250–68. [DOI] [PMC free article] [PubMed] [Google Scholar]
- 21.Thulborn KR and Atkinson IC. From standardization to quantification: beyond biomarkers towards bioscales as neuro MR imaging surrogates of clinical endpoints. AJNR Am J Neuroradiol 2013;34: 2241–9.24136644 [Google Scholar]
- 22.Christensen JD, Barrère BJ, Boada FE, Vevea JM, Thulborn KR. Quantitative tissue sodium concentration mapping of normal rat brain. Magn Reson Med 1996;36(1):83–9. [DOI] [PubMed] [Google Scholar]
- 23.Thulborn KR, Davis D, Adams H, Gindin T, Zhou J. Quantitative tissue sodium concentration mapping of the growth of focal cerebral tumors with sodium magnetic resonance imaging. Magn Reson Med 1999;41(2):351–9. [DOI] [PubMed] [Google Scholar]
- 24.Thulborn KR, Gindin TS, Davis D, Erb P. Comprehensive MR imaging protocol for stroke management: tissue sodium concentration as a measure of tissue viability in nonhuman primate studies and in clinical studies. Radiology 1999;213(1):156–66. [DOI] [PubMed] [Google Scholar]
- 25.Thulborn K, Lui E, Guntin J, Jamil S, Sun Z, Claiborne TC, Atkinson IC. Quantitative sodium MRI of the human brain at 9.4 T provides assessment of tissue sodium concentration and cell volume fraction during normal aging. NMR Biomed. 2016;29(2):137–43. [DOI] [PMC free article] [PubMed] [Google Scholar]
- 26.Atkinson IC, Lu A, Thulborn KR. Preserving the Accuracy and Resolution of the Sodium Bioscale from Quantitative Sodium MRI during Intra-Subject Alignment across Longitudinal Studies. Magn Reson Med 2012;68(3):751–61. [DOI] [PMC free article] [PubMed] [Google Scholar]
- 27.Wallner KE, Galicich JH, Krol G, Arbit E, Malkin MG. Patterns of failure following treatment for glioblastoma multiforme and anaplastic astrocytoma. Int J Radiat Oncol Biol Phys 1989;16(6):1405–9. [DOI] [PubMed] [Google Scholar]
- 28.Bruehlmeier M, Roelcke U, Bläuenstein P, Missimer J, Schubiger PA, Locher JT, et al. Measurement of the extracellular space in brain tumors using 76Br-bromide and PET. J Nucl Med 2003;44(8):1210–8. [PubMed] [Google Scholar]
- 29.Siegal T, Rubinstein R, Tzuk-Shina T, Gomori JM. Utility of relative cerebral blood volume mapping derived from perfusion magnetic resonance imaging in the routine follow up of brain tumors. J Neurosurg 1997:86(1):22–7. [DOI] [PubMed] [Google Scholar]
- 30.Hu LS, Eschbacher JM, Heiserman JE, Dueck AC, Shapiro WR, Liu S, et al. Reevaluating the imaging definition of tumor progression: perfusion MRI quantifies recurrent glioblastoma tumor fraction, pseudoprogression, and radiation necrosis to predict survival. Neuro Oncol 2012;14(7):919–30. [DOI] [PMC free article] [PubMed] [Google Scholar]
- 31.Gasparetto EL, Pawlak MA, Patel SH, Huse J, Woo JH, Krejza J, et al. Posttreatment recurrence of malignant brain neoplasm: accuracy of relative cerebral blood volume fraction in discriminating low from high malignant histologic volume fraction. Radiology 2009;250(3):887–96. [DOI] [PubMed] [Google Scholar]
- 32.Stupp R, Mason WP, van den Bent MJ, Weller M, Fisher B, Taphoorn MJ, et al. , European Organisation for Research and Treatment of Cancer Brain Tumor and Radiotherapy Groups; National Cancer Institute of Canada Clinical Trials Group. Radiotherapy plus concomitant and adjuvant temozolomide for glioblastoma. N Engl J Med 2005;352(10):987–96. [DOI] [PubMed] [Google Scholar]
Associated Data
This section collects any data citations, data availability statements, or supplementary materials included in this article.


