Abstract
Purpose
The oncogenic role of long non-coding RNA (lncRNA) DLG1-AS1 has been studied in cervical cancer, but its involvement in triple negative breast cancer (TNBC) is unknown. Here, we aimed to investigate the possible role and underlying mechanism of DLG1-AS1 in TNBC.
Methods
The differential expression of DLG1-AS1 and miR-203 in TNBC tissues and cells was determined using quantitative polymerase chain reaction assays. Correlations between DLG1-AS1 and miR-203 expression across TNBC tissues and non-tumor tissues were analyzed using Spearman rank correlation test. The effects of DLG1-AS1 and miR-203 overexpression, and DLG1-AS1 knockdown on the metastasis of BT-549 and MDA-MB-157 cells were evaluated using a transwell assay. The effects of DLG1-AS1 and miR-203 overexpression on the proliferation of BT-549 and MDA-MB-157 cells were evaluated using Cell Counting Kit-8 and cell colony formation assays.
Results
We found that DLG1-AS1 was upregulated whereas miR-203 was downregulated in tumor tissues of patients and in TNBC cells compared to the adjacent healthy tissues of patients with TNBC and in normal breast MCF-10A cells, respectively. Further, DLG1-AS1 and miR-203 were inversely correlated in tumor tissues. DLG1-AS1 overexpression mediated downregulation of miR-203, whereas miR-203 overexpression had no significant effects on DLG1-AS1 expression. DLG1-AS1 expression was increased, whereas miR-203 levels were decreased with advancing clinical stages. TNBC cell migration was promoted by DLG1-AS1 overexpression and inhibited by miR-203 overexpression or DLG1-AS1 knockdown. Moreover, TNBC cell proliferation was promoted by DLG1-AS1 overexpression and inhibited by miR-203 overexpression. Further, miR-203 overexpression reduced the effects of DLG1-AS1 overexpression.
Conclusion
These results indicate that DLG1-AS1 may promote cancer cell proliferation in TNBC by downregulating the tumor suppressor miR-203.
Keywords: Cell proliferation; Oncogene; RNA, long noncoding; Triple negative breast neoplasms
INTRODUCTION
Breast cancer is the most common type of malignancy for both incidence and mortality among females worldwide [1]. In 2016, breast cancer caused 626,679 deaths, accounting for 6.6% of all cancer-related deaths. In the same year, 2,088,849 new cases of breast cancer were recorded, accounting for 11.6% of all newly diagnosed cancer cases [2]. Triple negative breast cancer (TNBC) is a common subtype of breast cancer that accounts for about 10-20% of all cases [3]. Based on immunohistochemistry (IHC), TNBC tissues are negative for epidermal growth factor receptor 2, progesterone receptor, and estrogen receptor [4]. Currently, systemic chemotherapy is still the most commonly used treatment for patients with TNBC in both the early and advanced stages [5]. The lack of more effective targeted therapies results in poor outcomes [6].
Studies on the molecular pathogenesis of TNBC have revealed the involvement of a considerable number of genetic alterations [7,8]. Identification of oncogenes and tumor suppressors has provided novel insights into the development of novel targeted therapies [9]. Besides protein coding genes, development of TNBC also requires the involvement of non-coding RNAs (ncRNAs) such as long (> 200 nt) non-coding RNAs (lncRNAs) and microRNAs (miRNAs) [10,11]. LncRNA DLG1-AS1 is a recently identified oncogenic lncRNA in cervical cancer [12]. By analyzing a The Cancer Genome Atlas (TCGA) dataset we observed upregulation of DLG1-AS1 in breast cancer tissues compared to that in non-tumor tissues (0.16 vs. 0.06). Our preliminary RNA-sequencing analysis demonstrated altered expression of DLG1-AS1 in TNBC and its close correlation with miR-203, which is a well characterized tumor suppressive miRNA that plays important roles in TNBC [13]. This study was therefore conducted to analyze the possible interactions between DLG1-AS1 and miR-203 in TNBC.
METHODS
Collection of paired tissues
Fresh paired TNBC and non-tumor tissue samples were obtained from 66 patients with TNBC (44 to 67 years old, mean age 55.4 ± 4.9 years old) through biopsies. These patients were admitted to the aforementioned hospital between March 2015 and March 2018. All patients were newly diagnosed with TNBC. Patients with recurrent TNBC were not included in this study. No therapies were innititaed before the admission of patients. Based on the American Joint Committee on Cancer staging system, the 66 patients included 12, 18, 19, and 17 TNBC cases at clincal stage I, II, III, and IV, respectively. This study was approved by the review board of the Ethics Committee of Yantai Mountain Hospital (No. YMH20150122#TNBC32544). The research has been carried out in accordance with the World Medical Association Declaration of Helsinki as revised in 2013. All patients were informed of the experimental principle of this study and all patients signed the infromed consent.
TNBC cells and cell culture
Two human TNBC cell lines BT-549 and MDA-MB-157 (ATCC) were used in this study. The cells were grown in culture medium composed of 10% fetal bovine serum (FBS) and 90% RPMI-1640 medium. Normal breast cell line MCF-10A and TNBC cell lines MDA-MB-231, MDA-MB-468, BT20, and CAL51 were purchased from the cell bank of the Type Culture Collection of the Chinese Academy of Sciences, which were grown in DMEM (Gibco, Grand Island, USA) supplemented with 10% fetal bovine serum. Cell culture conditions were 37°C, 5% CO2, and 95% humidity.
Transient transfection
The DLG1-AS1 expression vector was constructed using a pcDNA3.1 vector (Invitrogen, Carlsbad, USA) as the backbone. miR-203 mimic and negative control (NC) miRNA were synthesized by Invitrogen. BT-549 and MDA-MB-157 cells were harvested at 75%–85% confluence and cells were counted, followed by transfection with 10 nM vector or 50 nM miRNA into 106 cells. Control (C) cells were untransfected. NC cells were cells transfected with the control vector. The cells used in the subsequent experiments were harvested at 48 hours post-transfection.
Transfection and Lentivirus packaging
The pCDH-CMV-DLG1-AS1 and pCDH-miR-203 expression vectors and pLKO.1-puro-shDLG1-AS1 (DLG1-AS1 short hairpin [sh] RNA: 5′-CAGCATAAGAGGTTGCTGTCGGA-3′) were constructed by Sangon (Shanghai, China). These vectors were transfected into HEK-293T cells with the psAX2 packaging plasmid and pMD2G envelope plasmid for 48 hours to obtain the lentivirus supernatant, which was then inoculated into BT549 and MDA-MB-157 TNBC cells. The resulting overexpression or knockdown cell lines were screened using puromycin.
Dual luciferase reporter gene assay
The putative miR-203 target binding sequences in lncRNA DLG1-AS1 containing the putative binding sites of miR-203 were synthesized and cloned into pmirGLO dual luciferase reporter vectors (Promega, Madison, USA). After 24 h of culture, cells were transfected with miR-203 mimic or mock control and co-transfected with the pmirGLO-DLG1-AS1 vector. Luciferase activity was detected in the experimental and control groups using a dual-luciferase reporter assay.
RNA preparation and reverse transcription (RT)-quantitative polymerase chain reaction (qPCR)
The TRIzol Plus RNA Purification Kit (Thermo Fisher Scientific, San Jose, USA) was used to extract total RNA from the paired tissue samples and in vitro cultivated TNBC cells. All RNA samples were treated with LookOut® DNA Erase (Sigma-Aldrich, St. Louis, USA) to remove genomic DNAs. The RNA concentration were measured using a NanoDrop 2000c Spectrophotometer (Thermo Fisher Scientific). With total RNA as the template, RT-qPCR assays were performed using the qScript One-Step RT-qPCR Kit (Quantabio, Beverley, USA). The expression levels of DLG1-AS1 were determined with glyceraldehyde 3-phosphate dehydrogenase (GAPDH) as the endogenous control.
miRNAs were extracted from the aforementioned tissue samples and cells using mirVana miRNA Isolation Kit (Thermo Fisher Scientific). The All-in-One™ miRNA qRT-PCR Detection Kit (Genecopoeia, Rockville, USA) was used to measure the expression levels of mature miR-203. All PCR assays were repeated 3 times. Fold change expression levels of DLG1-AS1 and miR-203 across samples were calculated using the 2−ΔΔCT method. The primers used for qRT-PCR were as follows: DLG1-AS1, 5′-CCGAAACTTTCCGCCAAGATG-3′ (forward) and 5′-CCTCACTTCCCATTGGCTGAG-3′ (reverse); miR-203, 5′-GGGGTGAAATGTTTAGGAC-3′ (forward) and 5′-CAGTGCGTGTCGTGGAGT-3′ (reverse); and GAPDH, 5′-CTCACCGGATGCACCAATGTT-3′ (forward) and 5′-CGCGTTGCTCACAATGTTCAT-3′ (reverse); U6, 5′-CGCAAGGATGACACGCAAATTC-3′.
Cell colony formation assays
BT549 and MDA-MB-157 TNBC cells were placed in 6-well plates (800 cells per well) and cultured in RPMI-1640 medium containing 10% FBS. After 14 days, TNBC cells were fixed with methanol and stained with 0.1% crystal violet. Cell colonies were then imaged and quantified.
Cell migration assay
BT549 and MDA-MB-157 TNBC cells (1 × 10⁴) were subjected to a migration assay using a 24-well Boyden chamber with a non-coated 8-mm pore size filter in the insert chamber (migration; BD Biosciences, Franklin Lakes, USA). Cells suspended in 0.5 mL RPMI-1640 medium without FBS were seeded into the insert chamber and allowed to migrate for 24 hours to the bottom chamber containing 0.5 mL of RPMI-1640 medium with 10% FBS. Migrated cells were counted under a microscope after fixing with carbinol and staining with crystal violet.
Cell proliferation assay
BT-549 and MDA-MB-157 cells were collected at 48 hours post-transfection and Cell Counting Kit-8 (CCK-8) assay was performed to analyze the effects of DLG1-AS1 and miR-203 overexpression on cell proliferation. Each well of a 96-well cell culture plate was seeded with 104 cells in 0.1 mL cell suspension. Cells were cultivated under aforementioned conditions, followed by addition of the CCK-8 solution (Sigma-Aldrich) into each well to a final concentration of 10% at 4 hours before the end of cell culture. Optical density (OD) values of the medium were measured at 450 nm.
Statistical analysis
Three independent biological replicates were included in each experiment. The mean values of 3 replicates were calculated and used for all data analyses. The results are shown as mean ± standard error of the mean. Statistical evaluations were performed with GraphPad Prism ver. 5 (GraphPad Software, San Diego, USA). Differences between TNBC and non-tumor tissues were analyzed by a paired t test. Differences among multiple groups were analyzed by analysis of variance (ANOVA; one-way) and Tukey test. The Spearman rank correlation test and linear regression were applied to analyze the correlations. The p < 0.05 was considered statistically significant.
RESULTS
DLG1-AS1 and miR-203 showed contrasting expression patterns in TNBC
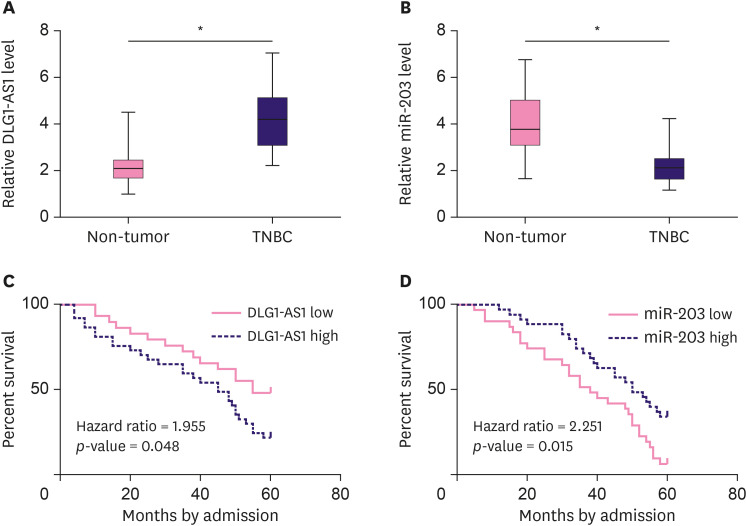
The differential expression of DLG1-AS1 and miR-203 in both TNBC and non-tumor tissues from 66 TNBC patients was analyzed using qPCR assays. Paired t-test results showed that, DLG1-AS1 expression levels were significantly higher in TNBC tissues compared to those in non-tumor tissues (Figure 1A, p < 0.001), consistent with the results of the TCGA database analysis (Supplementary Figure 1). In contrast, significantly lower expression levels of miR-203 were observed in TNBC tissues than those in non-tumor tissues (Figure 1B, p < 0.001).
Figure 1. DLG1-AS1 and miR-203 expression in TNBC tissues and corresponding OS.
The differential expression of (A) DLG1-AS1 and (B) miR-203 in TNBC was analyzed in both TNBC and non-tumor tissues from the 66 TNBC patients using qPCR assays. Data were compared between the 2 types of tissue by a paired t-test. PCR assays were repeated 3 times and mean values are presented. (C) Survival curve analysis showed that patients in the high DLG1-AS1 group showed significantly lower OS compared to that in patients from the low DLG1-AS1 group (p < 0.05). (D) Patients in the low miR-203 group showed significantly lower OS compared to patients in the high miR-203 group.
TNBC = triple negative breast cancer; qPCR = quantitative polymerase chain reaction; OS = overall survival.
*p < 0.001.
LncRNA DLG1-AS1 and miR-203 were prognostic factors for patients with TNBC
Kaplan–Meier survival analysis revealed a close correlation between the expression of lncRNA DLG1-AS1 and overall survival (OS). The data showed that patients in the high (n = 37) lncRNA DLG1-AS1 group had a significantly lower overall survival rate compared to that of patients in the low (n = 29) lncRNA DLG1-AS1 group (Figure 1C, p = 0.048). However, the high (n = 35) miR-203 group had a significantly higher overall survival rate compared to that of patients in the low (n = 31) miR-203 group (Figure 1D, p = 0.015).
DLG1-AS1 and miR-203 levels were inversely correlated in TNBC tissues and TNBC cells
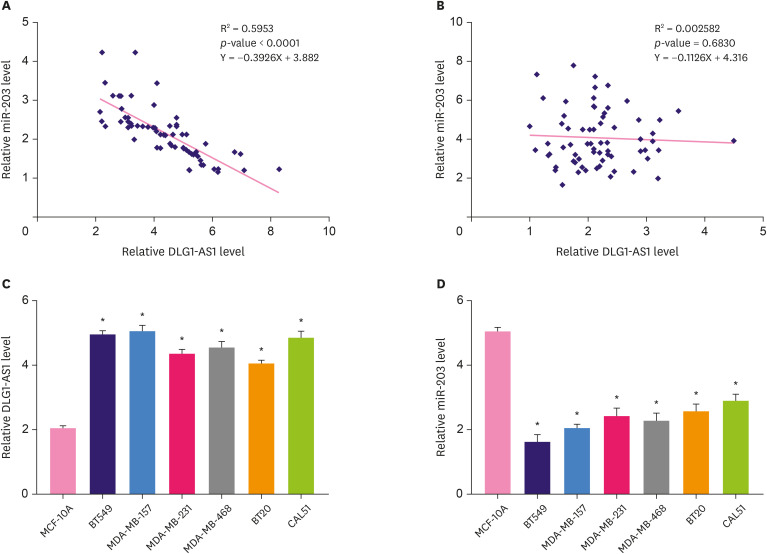
Correlations between the expression levels of DLG1-AS1 and miR-203 in TNBC tissues and non-tumor tissues were analyzed by linear regression. The expression levels of DLG1-AS1 and miR-203 were found to be inversely correlated in TNBC tissue samples (Figure 2A). In contrast, this inverse correlation was not found in non-tumor tissue samples (Figure 2B). Further, in TNBC cells, the expression of DLG1-AS1 was remarkably upregulated compared to that in normal breast cells MCF-10A (Figure 2C, p < 0.05), whereas the expression of miR-203 was significantly down-regulated (Figure 2D, p < 0.05). Similar results were observed in tissue samples. To further test this relationship, a luciferase reporter assay was performed. As shown in Supplementary Figure 2, the miR-203 mimic decreased the luciferase activity of pmirGLO-LncRNA DLG1-AS1 (p < 0.05). These results indicate the possible interactions between DLG1-AS1 and miR-203 in TNBC.
Figure 2. Inverse correlation of DLG1-AS1 and miR-203 in TNBC tissues and cells.
The correlations between DLG1-AS1 and miR-203 expression across TNBC tissues (A) and non-tumor (B) tissues were analyzed using the Spearman rank correlation test. qRT-PCR analysis of DLG1-AS1 levels was performed in normal human breast cells MCF-10A and in BT549, MDA-MB-157, MDA-MB-231, MDA-MB-468, BT20, and CAL51 TNBC cells.
qRT-PCR = quantitative reverse transcription-polymerase chain reaction; TNBC = triple negative breast cancer.
*p < 0.05.
DLG1-AS1 overexpression downregulated miR-203 expression in TNBC cells
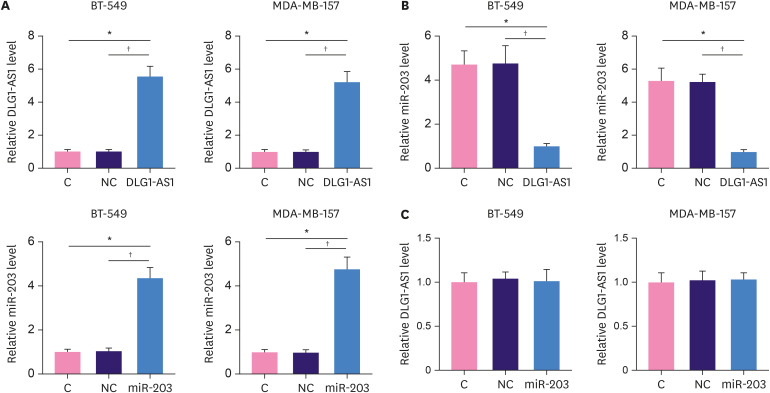
BT-549 and MDA-MB-157 cells were transfected with DLG1-AS1 expression vector or miR-203 mimic to further evaluate the interactions between DLG1-AS1 and miR-203. Overexpression of DLG1-AS1 and miR-203 was confirmed by qPCR at 48 hours post-transfection (Figure 3A, p < 0.05). Compared to the NC and C groups, DLG1-AS1 overexpression led to downregulation of miR-203 in both BT-549 and MDA-MB-157 cells (Figure 3B, p < 0.05). In contrast, cells with the miR-203 overexpression showed no change in DLG1-AS1 expression (Figure 3C).
Figure 3. miR-203 downregulation by DLG1-AS1 overexpression in TNBC cells.
BT-549 and MDA-MB-157 cells were transfected with DLG1-AS1 expression vector or miR-203 mimic to further analyze the interactions between DLG1-AS1 and miR-203. (A) Overexpression of DLG1-AS1 and miR-203 was confirmed by qPCR at 48 hours post-transfection. (B)The effects of DLG1-AS1 overexpression on miR-203 and (C) the effects of miR-203 overexpression on DLG1-AS1 were also analyzed by qPCR at 48 hours post-transfection. The experiments were repeated 3 times and mean values are presented.
TNBC = triple negative breast cancer; qPCR = quantitative polymerase chain reaction; C = control; NC = negative control.
*Compared to C, p < 0.05; †compared to NC, p < 0.05.
DLG1-AS1 and miR-203 expression levels were closely related to the TNBC clinical stages
The 66 patients in this study included 12, 18, 19, and 17 cases of TNBC at clincal stage I, II, III, and IV, respectively. The expression levels of DLG1-AS1 and miR-203 were compared among the 4 clinical stages using ANOVA (one-way) and Tukey test. DLG1-AS1 expression was found to be significantly increased (Figure 4A, p < 0.05), whereas miR-203 expression was significantly decreased (Figure 4B, p < 0.05) with the increase in clinical stages.
Figure 4. Association of DLG1-AS1 and miR-203 expression levels with clinical stages.
The 66 TNBC patients enrolled in this study included 12, 18, 19, and 15 cases at clinical stage I, II, III, and IV, respectively. (A) DLG1-AS1 and (B) miR-203 expression levels were compared among the 4 clinical stages using ANOVA (one-way) and Tukey test.
TNBC = triple negative breast cancer; ANOVA = analysis of variance.
*Stage I compared to stage II, p < 0.05; †stage II compared to stage III, p < 0.05; ‡stage III compared to stage IV, p < 0.05.
Effects of DLG1-AS1 and miR-203 on the migration of TNBC cells
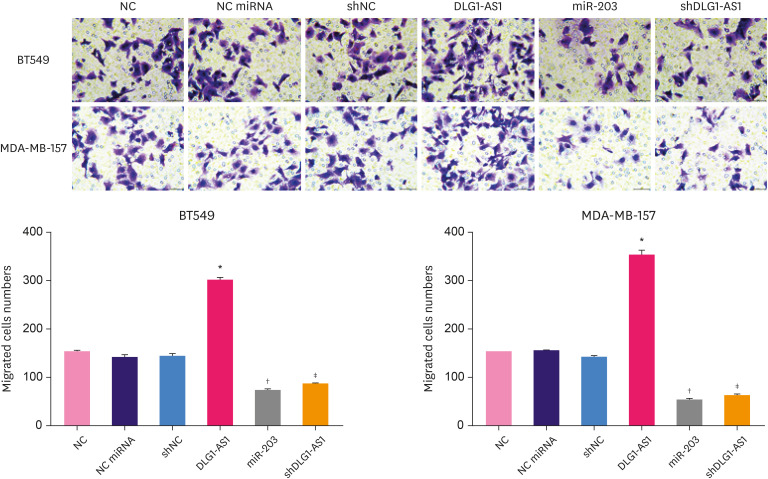
Metastasis is one of the typical features of TNBC, therefore the effects of miR-203 and DLG1-AS1 overexpression, and DLG1-AS1 downregulation on the migration of TNBC cells were assessed. We generated cells overexpressing DLG1-AS1 and miR-203 as well as DLG1-AS1 stable knockdown cells by lentiviral transduction in BT549 and MDA-MB-157 cells. The effects of DLG1-AS1 and miR-203 overexpression on TNBC cell migration was assessed using a transwell assay. As shown in Figure 5, compared with the NC group, the number of migrated cells in the DLG1-AS1 overexpressing group was obviously increased (p < 0.05). On the contrary, the number of migrated cells in the shDLG1-AS1 group was significantly decreased than that in the shNC group (p < 0.05). Further, compared with the NC mimic group, the number of migrated cells in the miR-203 overexpressing group was obviously decreased (p < 0.05). We also generated DLG1-AS1 overexpressing normal MCF-10A breast cells, and verified the promoting effect of DLG1-AS1 overexpression on cell migration (Supplementary Figure 3, p < 0.05). These findings indicate that upregulation of miR-203 and downregulation of DLG1-AS1 could inhibit cell migration, whereas upregulation of DLG1-AS1 promoted cell migration in BT549 and MDA-MB-157 cells.
Figure 5. Effects of DLG1-AS1 and miR-203 upregulation and DLG1-AS1 downregulation on BT549 and MDA-MB-157 cell migration.
A transwell assay was performed to study the effects of upregulated DLG1-AS1 and miR-203, and downregulated DLG1-AS1 on TNBC cell migration.
NC = negative control; sh = short hairpin.
*Compared to NC, p < 0.05; †compared to NC miRNA, p-value; ‡compared to shNC, p < 0.05.
DLG1-AS1 promoted the proliferation of TNBC cells through miR-203
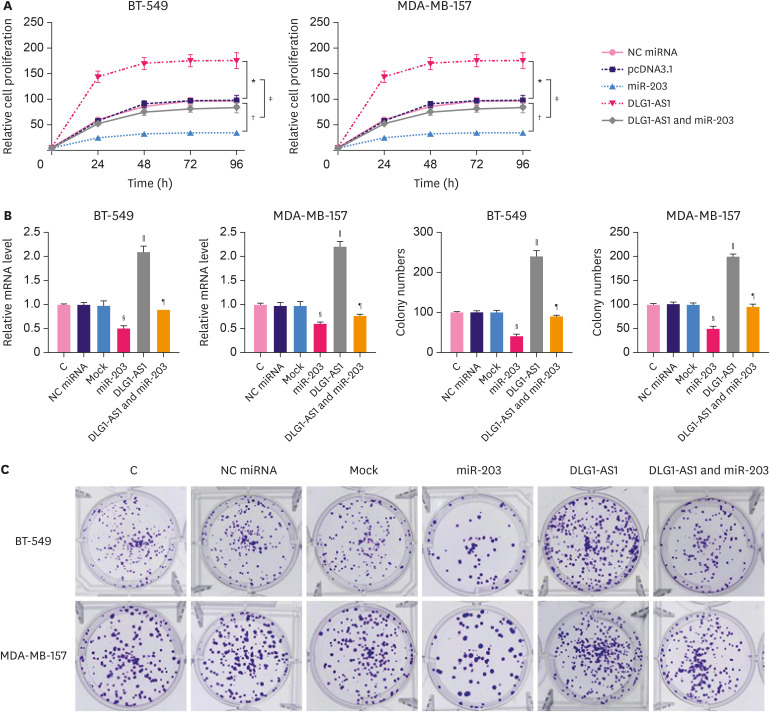
The effects of DLG1-AS1 and miR-203 overexpression on the proliferation of BT-549 and MDA-MB-157 cells were analyzed using CCK-8 assays and cell colony formation assays. As shown in Figure 6, compared with the NC mimic, the cell proliferation rate of the miR-203 mimic group was obviously decreased (p < 0.05, Figure 6A). In contrast, it was significantly increased in the DLG1-AS1 group compared to that in the NC group (p < 0.05, Figure 6A). Moreover, overexpression of miR-203 reduced the effects of DLG1-AS1 overexpression. We also generated DLG1-AS1 and miR-203 overexpressing BT549 and MDA-MB-157 cells using lentiviral transduction to perform cell colony formation assays. As shown in Figure 6B, overexpression of DLG1-AS1 promoted cell colony formation whereas overexpression of miR-203 inhibited cell colony formation, thus weakening the effects of DLG1-AS1 overexpression on cell colony formation.
Figure 6. Promotion of TNBC cell proliferation by DLG1-AS1 through miR-203.
(A) The effects of DLG1-AS1 and miR-203 overexpression on the proliferation of BT-549 and MDA-MB-157 cells were examined using the CCK-8 cell proliferation assay. pCDH-CMV-DLG1-AS1 and pCDH-miR-203 expression vectors, were used to generate the TNBC cells with stable overexpression of DLG1-AS1 and miR-203. (B) The mock group included cells infected with the pCDH-CMV control. The RNA expression levels are shown. (C) Cell colony formation assays using stable overexpressing cells were carried out to study the long-term effect of upregulated DLG1-AS1 and miR203 on cell proliferation. Experiments were repeated 3 times and mean values are presented.
*Compared to the pcDNA3.1 group, p < 0.05; †compared to NC miRNA; ‡compared to pcDNA3.1, p < 0.05; §miR203 group compared to the NC miRNA group, p < 0.05; ∥DLG1-AS1 compared to the mock group; ¶compared to mock, p < 0.05.
DISCUSSION
In this study we mainly investigated the roles of DLG1-AS1 in TNBC. We found that DLG1-AS1 was upregulated in TNBC and may downregulate miR-203 to promote the proliferation and metastasis of TNBC cells.
The expression pattern and functions of DLG1-AS1 have only been investigated in cervical cancer [12]. DLG1-AS1 is upregulated in cervical cancer and can sponge miR-107 to upregulate oncogenic ZHX1, thereby promoting the proliferation of cervical cancer cells [12]. By analyzing a TCGA dataset, we also observed upregulation of DLG1-AS1 in cervical cancer tissues compared to that in paired non-tumor tissues (0.34 vs. 0.03). In this study we first report the upregulation of DLG1-AS1 in TNBC. In addition, we observed increased proliferation rates of TNBC cells after overexpression of DLG1-AS1. Thus, DLG1-AS1 may also play oncogenic roles in TNBC.
Notably, TCGA dataset analysis revealed obvious downregulation of DLG1-AS1 in certain types of malignancies such as tensynovial giant cell tumors (0.05 vs. 6.79) and lung squamous cell carcinoma (0.05 vs. 0.3). Downregulation of DLG1-AS1 may indicate tumor suppressive roles of DLG1-AS1 in these cancers. Future studies thus are needed to explore the involvement of DLG1-AS1 in these types of malignancy.
miR-203 plays different roles in different cancer types [14,15]. For instance, miR-203 is downregulated in renal cell carcinoma and downregulates oncogenic lncRNA HOTAIR to regulate epithelial-to-mesenchymal transition [14]. Another study reported downregulation of miR-203 in head and neck cancer and showed suppressive effects of miR-203 on cancer cell invasion and migration [15]. miR-203 is also reported to interact with survivin to promote the progression of lung cancer [16]. In a recent study miR-203 was reported to inhibit TNBC cell proliferation [13]. Consistently, our study also showed decreased proliferation rates of TNBC cells after miR-203 overexpression. Interestingly, we found that DLG1-AS1 overexpression could downregulate miR-203, whereas miR-203 overexpression did not affect DLG1-AS1 expression. In addition, the miR-203 mimic decreased the luciferase activity for the binding sites of DLG1-AS1. Previous studies have also reported similar cases. For example, Hu et al. [17] and Zhao et al. [18] found that overexpression of miR-19b-3p and miR-203a inhibited the luciferase activity for the binding sites of lncRNA AK015322 and LINC00657, respectively. However, overexpression of these 2 microRNAs did not affect the expression of their respective target lncRNAs [17,18]. In line with these reports, we also speculated that miR-203 mediates a translational suppression-like effect rather than an RNA degradation effect, and that DLG1-AS1 is a miR-203 decoy in TNBC cells.
In conclusion, our results indicate that DLG1-AS1 is upregulated in TNBC and may downregulate tumor suppressive miR-203 to promote cancer cell proliferation.
Footnotes
Conflict of Interest: The authors declare that they have no competing interests.
SUPPLEMENTARY MATERIALS
Expression of DLG1-AS1 in certain types of malignancies. TCGA database showed that expression of DLG1-AS1 in certain types of malignancies was different. Compared with normal tissues, DLG1-AS1 was remarkably up-regulated in tumor tissues of breast cancer, cervical cancer and kidney cancer. However, in lung cancer, tensynovial giant cell cancer and rectum adenocarcinoma, DLG1-AS1 was significantly down-regulated in tumor tissues.
DLG1-AS1 was a direct target of miR-203. Relative luciferase activity is decreased in BT549 and MDA-MB-157 cells transfected with pmirGLO-DLG1-AS1, demonstrating that miR-203 directly binds to lncRNA DLG1-AS1.
Overexpression of DLG1-AS1 increased the proliferation of MCF-10A. Transwell assay was carried out to study the effects of up-regulated DLG1-AS1 on cell migration.
References
- 1.Siegel RL, Miller KD, Jemal A. Cancer statistics, 2019. CA Cancer J Clin. 2019;69:7–34. doi: 10.3322/caac.21551. [DOI] [PubMed] [Google Scholar]
- 2.Bray F, Ferlay J, Soerjomataram I, Siegel RL, Torre LA, Jemal A. Global cancer statistics 2018: GLOBOCAN estimates of incidence and mortality worldwide for 36 cancers in 185 countries. CA Cancer J Clin. 2018;68:394–424. doi: 10.3322/caac.21492. [DOI] [PubMed] [Google Scholar]
- 3.Bianchini G, Balko JM, Mayer IA, Sanders ME, Gianni L. Triple-negative breast cancer: challenges and opportunities of a heterogeneous disease. Nat Rev Clin Oncol. 2016;13:674–690. doi: 10.1038/nrclinonc.2016.66. [DOI] [PMC free article] [PubMed] [Google Scholar]
- 4.Bosch A, Eroles P, Zaragoza R, Viña JR, Lluch A. Triple-negative breast cancer: molecular features, pathogenesis, treatment and current lines of research. Cancer Treat Rev. 2010;36:206–215. doi: 10.1016/j.ctrv.2009.12.002. [DOI] [PubMed] [Google Scholar]
- 5.Wahba HA, El-Hadaad HA. Current approaches in treatment of triple-negative breast cancer. Cancer Biol Med. 2015;12:106–116. doi: 10.7497/j.issn.2095-3941.2015.0030. [DOI] [PMC free article] [PubMed] [Google Scholar]
- 6.Denkert C, Liedtke C, Tutt A, von Minckwitz G. Molecular alterations in triple-negative breast cancer-the road to new treatment strategies. Lancet. 2017;389:2430–2442. doi: 10.1016/S0140-6736(16)32454-0. [DOI] [PubMed] [Google Scholar]
- 7.Weisman PS, Ng CK, Brogi E, Eisenberg RE, Won HH, Piscuoglio S, et al. Genetic alterations of triple negative breast cancer by targeted next-generation sequencing and correlation with tumor morphology. Mod Pathol. 2016;29:476–488. doi: 10.1038/modpathol.2016.39. [DOI] [PMC free article] [PubMed] [Google Scholar]
- 8.Shimelis H, LaDuca H, Hu C, Hart SN, Na J, Thomas A, et al. Triple-negative breast cancer risk genes identified by multigene hereditary cancer panel testing. J Natl Cancer Inst. 2018;110:855–862. doi: 10.1093/jnci/djy106. [DOI] [PMC free article] [PubMed] [Google Scholar]
- 9.Kalimutho M, Parsons K, Mittal D, López JA, Srihari S, Khanna KK. Targeted therapies for triple-negative breast cancer: combating a stubborn disease. Trends Pharmacol Sci. 2015;36:822–846. doi: 10.1016/j.tips.2015.08.009. [DOI] [PubMed] [Google Scholar]
- 10.Shen X, Xie B, Ma Z, Yu W, Wang W, Xu D, et al. Identification of novel long non-coding RNAs in triple-negative breast cancer. Oncotarget. 2015;6:21730–21739. doi: 10.18632/oncotarget.4419. [DOI] [PMC free article] [PubMed] [Google Scholar]
- 11.Turashvili G, Lightbody ED, Tyryshkin K, SenGupta SK, Elliott BE, Madarnas Y, et al. Novel prognostic and predictive microRNA targets for triple-negative breast cancer. FASEB J. 2018;32:5937–5954. doi: 10.1096/fj.201800120R. [DOI] [PubMed] [Google Scholar]
- 12.Rui X, Xu Y, Huang Y, Ji L, Jiang X. lncRNA DLG1-AS1 promotes cell proliferation by competitively binding with miR-107 and up-regulating ZHX1 expression in cervical cancer. Cell Physiol Biochem. 2018;49:1792–1803. doi: 10.1159/000493625. [DOI] [PubMed] [Google Scholar]
- 13.Wang C, Zheng X, Shen C, Shi Y. MicroRNA-203 suppresses cell proliferation and migration by targeting BIRC5 and LASP1 in human triple-negative breast cancer cells. J Exp Clin Cancer Res. 2012;31:58. doi: 10.1186/1756-9966-31-58. [DOI] [PMC free article] [PubMed] [Google Scholar]
- 14.Dasgupta P, Kulkarni P, Majid S, Shahryari V, Hashimoto Y, Bhat NS, et al. MicroRNA-203 inhibits long noncoding RNA HOTAIR and regulates tumorigenesis through epithelial-to-mesenchymal transition pathway in renal cell carcinoma. Mol Cancer Ther. 2018;17:1061–1069. doi: 10.1158/1535-7163.MCT-17-0925. [DOI] [PMC free article] [PubMed] [Google Scholar]
- 15.Obayashi M, Yoshida M, Tsunematsu T, Ogawa I, Sasahira T, Kuniyasu H, et al. microRNA-203 suppresses invasion and epithelial-mesenchymal transition induction via targeting NUAK1 in head and neck cancer. Oncotarget. 2016;7:8223–8239. doi: 10.18632/oncotarget.6972. [DOI] [PMC free article] [PubMed] [Google Scholar]
- 16.Wang T, Li W, Li W, Liu L, Zhang H. MicroRNA-203 promotes the progression of non-small cell lung cancer via surviving. J BUON. 2019;24:591–598. [PubMed] [Google Scholar]
- 17.Hu K, Zhang J, Liang M. LncRNA AK015322 promotes proliferation of spermatogonial stem cell C18-4 by acting as a decoy for microRNA-19b-3p. In Vitro Cell Dev Biol Anim. 2017;53:277–284. doi: 10.1007/s11626-016-0102-5. [DOI] [PubMed] [Google Scholar]
- 18.Zhao L, Liu C, Yan S, Hu G, Xiang K, Xiang H, et al. LINC00657 promotes colorectal cancer stem-like cell invasion by functioning as a miR-203a sponge. Biochem Biophys Res Commun. 2020;529:500–506. doi: 10.1016/j.bbrc.2020.04.049. [DOI] [PubMed] [Google Scholar]
Associated Data
This section collects any data citations, data availability statements, or supplementary materials included in this article.
Supplementary Materials
Expression of DLG1-AS1 in certain types of malignancies. TCGA database showed that expression of DLG1-AS1 in certain types of malignancies was different. Compared with normal tissues, DLG1-AS1 was remarkably up-regulated in tumor tissues of breast cancer, cervical cancer and kidney cancer. However, in lung cancer, tensynovial giant cell cancer and rectum adenocarcinoma, DLG1-AS1 was significantly down-regulated in tumor tissues.
DLG1-AS1 was a direct target of miR-203. Relative luciferase activity is decreased in BT549 and MDA-MB-157 cells transfected with pmirGLO-DLG1-AS1, demonstrating that miR-203 directly binds to lncRNA DLG1-AS1.
Overexpression of DLG1-AS1 increased the proliferation of MCF-10A. Transwell assay was carried out to study the effects of up-regulated DLG1-AS1 on cell migration.


