

Abstract
Patient stratification based on biological variation in pancreatic ductal adenocarcinoma (PDAC) subtypes could help to improve clinical outcome. However, noninvasive assessment of the entire tumor microenvironment remains challenging. In this study, we investigate the biological basis of dynamic contrast‐enhanced (DCE), intravoxel incoherent motion (IVIM), and R2*‐derived magnetic resonance imaging (MRI) parameters for the noninvasive characterization of the PDAC tumor microenvironment and evaluate their prognostic potential in PDAC patients. Patients diagnosed with treatment‐naïve resectable PDAC underwent MRI. After resection, a whole‐mount tumor slice was analyzed for collagen fraction, vessel density, and hypoxia and matched to the MRI parameter maps. MRI parameters were correlated to immunohistochemistry‐derived tissue characteristics and evaluated for prognostic potential. Thirty patients were included of whom 21 underwent resection with whole‐mount histology available in 15 patients. DCE K trans and v e, ADC, and IVIM D correlated with collagen fraction. DCE k ep and IVIM f correlated with vessel density and R2* with tissue hypoxia. Based on MRI, two main PDAC phenotypes could be distinguished; a stroma‐high phenotype demonstrating high vessel density and high collagen fraction and a stroma‐low phenotype demonstrating low vessel density and low collagen fraction. Patients with the stroma‐high phenotype (high k ep and high IVIM D, n = 8) showed longer overall survival (not reached vs. 14 months, P = 0.001, HR = 9.1, P = 0.004) and disease‐free survival (not reached vs. 2 months, P < 0.001, HR 9.3, P = 0.003) compared to the other patients (n = 22). Median follow‐up was 41 (95% CI: 36–46) months. MRI was able to accurately characterize tumor collagen fraction, vessel density, and hypoxia in PDAC. Based on imaging parameters, a subgroup of patients with significantly better prognosis could be identified. These first results indicate that stratification‐based MRI‐derived biomarkers could help to tailor treatment and improve clinical outcome and warrant further research.
Keywords: carcinoma, pancreatic ductal, magnetic resonance imaging, diffusion magnetic resonance imaging, histological techniques, prognosis
Patient stratification based on biological variation in pancreatic ductal adenocarcinoma subtypes could help to improve clinical outcome. In this study, quantitative magnetic resonance imaging (MRI) parameters were directly correlated to immunohistochemistry‐derived tissue characteristics. Furthermore, based on MRI parameters a subgroup of patients with significantly better prognosis could be identified, indicating that patient stratification based on MRI parameters is feasible.
Abbreviations
- ADC
apparent diffusion coefficient
- CT
computed tomography
- D*
pseudodiffusion coefficient
- D
diffusion coefficient
- DAB
3,3′‐diaminobenzidine
- DCE
dynamic contrast‐enhanced
- DFS
disease‐free survival
- DWI
diffusion‐weighted imaging
- f
perfusion fraction
- HIER
heat‐induced epitope retrieval
- HIF‐1α
hypoxia‐inducible factor 1‐alpha
- IVIM
intravoxel incoherent motion
- kep
rate constant
- Ktrans
transfer constant
- MRI
magnetic resonance imaging
- OS
overall survival
- PDAC
pancreatic ductal adenocarcinoma
- PSR
Picrosirius Red
- ROI
region of interest
- ve
extracellular extravascular space
- vp
blood plasma volume
- VWF
von Willebrand factor
1. Introduction
The severe desmoplastic reaction often present in pancreatic ductal adenocarcinoma (PDAC) has been associated with dismal prognosis and therapy resistance (Özdemir et al., 2014). This desmoplastic reaction involves extensive fibrosis, severe immune infiltration, and hypovascularization (Feig et al., 2012). As a result of increased interstitial pressure and reduced vascularization, pancreatic tumors often present with high levels of hypoxia (Koong et al., 2000). Variation in these three biological characteristics of PDAC – desmoplasia, hypovascularization, and hypoxia – have been related to differences in treatment outcome (Bailey et al., 2016; Puleo et al., 2018).
Patient stratification based on this biological variation could help to tailor treatment and improve clinical outcome. However, characterization of the PDAC microenvironment in patients remains difficult, since (endoscopic) biopsies often yield too little tissue for full characterization and are prone to spatial sampling variation.
Quantitative magnetic resonance imaging (MRI), such as dynamic contrast‐enhanced (DCE), diffusion‐weighted imaging (DWI), and T2*‐weighted MRI, potentially enables noninvasive characterization of desmoplasia, hypovascularization, and hypoxia of the entire tumor (Gurney‐Champion et al., 2018; Klaassen et al., 2018a, 2018b,2018a, 2018b). In DCE MRI, imaging is performed repeatedly after contrast injection and quantified by fitting a multicompartment model to the tissue contrast uptake curve. DWI uses gradients placed prior to the signal readout to sensitize the MRI signal to the diffusivity of water molecules. Cellular structures hamper this water diffusivity, enabling DWI to characterize the tissue using a mono‐exponential function of the DWI signal decay. The intravoxel incoherent motion (IVIM) model (Le Bihan et al., 1988) uses a bi‐exponential fit to also model the faster perfusion‐driven movement of water molecules in the capillaries, enabling a separate means of quantifying tissue perfusion. In R2* (the reciprocal of T2*‐relaxation time) MRI, the difference in magnetic permeability between oxy‐ and deoxyhemoglobin is exploited to determine tissue oxygenation. DCE (Bali et al., 2011; Ma et al., 2016) and IVIM (Klauss et al., 2015; Lemke et al., 2009) have demonstrated potential in characterizing PDAC lesions, DWI has shown prognostic relevance in PDAC patients (Heid et al., 2016), and studies in other cancer types have shown the relation between hypoxia and R2* (Hoskin et al., 2007). However, implementation of imaging biomarkers in the clinical workup of PDAC is not straightforward and still lacking. The exact interpretation of the MR parameters is greatly dependent on the underlying tissue conditions and used techniques. Direct correlation to histology and patient outcome is often lacking. In this study, we match surgery obtained pathology to the MRI in an unprecedented way to directly correlate the MRI parameters to histopathology‐derived tissue characteristics. Furthermore, we investigated whether these parameters can be used as noninvasive prognostic marker in patients with PDAC.
2. Materials and methods
2.1. Patients
For this prognostic study, patients were included at the Amsterdam UMC, location AMC, during November 2013 and November 2017. Inclusion criteria comprised computed tomography (CT)‐diagnosed high suspicion of resectable PDAC (Dutch Pancreatic Cancer Group criteria, Versteijne et al., 2016), scheduled for surgical exploration, a minimal eGFR of 30 mL·min−1·1.73 m−2, and no contraindications to undergo MRI scanning. The study was approved by the institutional review board of the Academic Medical Center (METC2013_254, NCT01989000) and performed according to the standards set by the Declaration of Helsinki. All patients gave written informed consent before the start of the study. Patients did not receive any oncological treatment before MRI scans were performed. Complete clinical follow‐up was used until September 2018.
2.2. Magnetic resonance imaging and processing
Magnetic resonance imaging was performed on a 3T MR scanner (Ingenia, Philips, Best, the Netherlands) on which we obtained quantitative DCE, T2*, and DWI images. For anatomical verification, a multi‐echo spoiled gradient echo with three‐point Dixon reconstruction (mDIXON) sequence was performed 35 s after contrast injection. Relevant sequence parameters are summarized in Table 1.
Table 1.
Summary of the relevant MRI sequence parameters for DCE, T1 mapping, DWI, T2*, and mDIXON acquisition. FOV, field of view; RL, right–left; AP, anterior–posterior; TR, repetition time; TE, echo time; TI, inversion time; FA, flip angle; Resp., respiratory.
| DCE | T1 | DWI | T2* | mDIXON | |
|---|---|---|---|---|---|
| Sequence type | Fast Field Echo | Look‐Locker | Echo Planar Imaging | Multi‐echo (8) Spoiled Gradient Echo | Multi‐echo (3) Spoiled Gradient Echo |
| FOV (RL × AP, mm2) | 400 × 400 | 400 × 350 | 432 × 108 | 400 × 355 | 400 × 350 |
| Acquisition matrix | 160 × 160 | 132 × 116 | 144 × 34 | 176 × 154 | 236 × 208 |
| Slice thickness/gap (mm) | 2.5 (5.0 noninterpolated) | 5.7 (11.4 noninterpolated) | 3.7/0.3 | 2.3 (4.6 noninterpolated) | 1.7 |
| Slices | 30 | 13 | 18 | 41 | 53 |
| TR/TE1/ΔTE (ms) | 3.2/2.0/– | 3.5/1.6/– | > 2200/45/– | 20/2.3/2.3 | 4.7/1.2/1.0 |
| TI1/TI (ms) | – | 19/85 | – | – | – |
| FA (°) | 20 | 8 | 90 | 12 | 25 |
| SENSE (RL/AP) | 3.6/1.5 | 3/1.3 | 1.3 AP | 1.5FH/2AP | 2/1.5 |
| Scan time (total) | 1.75 s (280 s) | 24 s | ~ 10 min | 22 s | 21 s |
| Resp. compensation | Postprocessing | 1 breath hold | Resp. trigger (navigator) | 1 breath hold | 1 breath hold |
| DWI | |||||
| b‐values (s·mm−2) and (directions/averages) | 0 (15), 10 (9),20 (9), 30 (9), 40 (9), 50 (9), 75 (4), 100 (12), 150 (4), 250 (4), 400 (4), 600 (16) | ||||
| Diffusion times δ/Δ (ms) | 10.1/22.6 | ||||
Image processing was performed using in‐house software written in matlab (R2015b; MathWorks, Natick, MA, USA), unless stated otherwise.
T2* and DCE data were obtained and processed as described in detail in our earlier performed repeatability study (Klaassen et al., 2018b). A mono‐exponential function was used to model the signal intensity decay at different echo times to retrieve quantitative maps of T2* and R2* relaxation rate. A population‐based arterial input function was used derived from another set of pancreatic cancer patients using the same scan and injection protocol (Klaassen et al., 2018b). The extended Tofts model was fitted for each voxel to retrieve parameter maps for the transfer constant (K trans), rate constant (k ep = K trans/v e), extracellular extravascular space (v e), and blood plasma volume (v p). Voxels with unreliable fit results (v e > 1.0) were discarded from further analysis.
Full details on DWI acquisition and data processing are described in our previous work, where the acquisition was optimized (Gurney‐Champion et al., 2016) and used on a different set of PDAC patients (Gurney‐Champion et al., 2018; Klaassen et al., 2018a). Diffusion coefficient (D), perfusion fraction (f), and pseudodiffusion coefficient (D*) maps were obtained by fitting the IVIM model to the signal decay as function of b‐value using a least‐squares fit. Additionally, apparent diffusion coefficient (ADC) maps were obtained using a mono‐exponential fit to the signal decay as function of all acquired b‐values.
2.3. Histopathology processing and MRI matching
Directly after resection, colored beads were sutured to relevant anatomical structures (i.e., mesenteric vein and artery margins, bile duct, and pancreatic duct) and dissection planes of the resection specimen (Fig. 1A left) and marked by a pathologist using colored ink (Fig. 1A right). Independently, relevant anatomical structures were annotated on the MRI and reconstructed to form a 3D volume of the tumor area (Fig. 1B). After overnight fixation in 4% paraformaldehyde, the tissue was sliced in approximately 5‐mm‐thick axial‐oriented slices that were numbered and photographed from both sides. One complete tissue slice comprising evident tumor was selected for whole‐mount processing (Fig. 1C). Next, the photographed slices were arranged and automatically realigned to form a 3D volume of the pathology specimen using the image scale obtained from an on the photograph included ruler and an approximated slice thickness of 5 mm (imagej, stackreg, Thevenaz et al., 1998) (Fig. 1D). Next, the colored landmarks in the 3D reconstructed pathology specimen were matched to the manual annotations in the MRI in 3d slicer (https://www.slicer.org; Fedorov et al., 2012) (Fig. 1E). This way, each slice in the pathology specimen was matched to the MRI image slices assuming approximately the same axial orientation for the pathology and MRI slices as starting point. Furthermore, care was taken to find the best possible match between MRI and pathology for the whole‐mount processed slice.
Fig. 1.
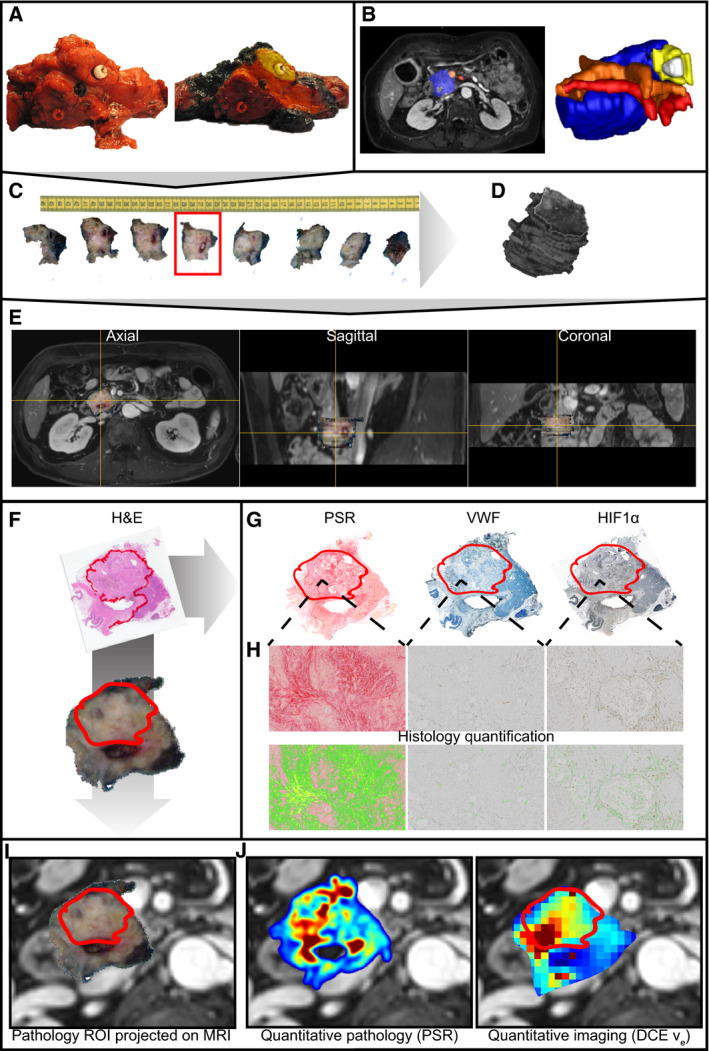
Graphical representation of the pathology to MRI matching procedure. (A) Anatomical structures are marked in the tissue specimen. (B) Anatomical structures are marked on the MRI. (C) The tissue specimen is sliced in axial‐oriented slices. (D) The tissue specimen is reconstructed in 3D MRI space by aligning the tissue slices. (E) The 3D reconstructed slices are projected onto the MRI and aligned to match anatomical structures visible on both MRI and pathology. (F) The whole‐mount slice is stained with H&E, and the tumor area is annotated by a pathologist. (G) The tumor ROI is copied to the immunohistochemistry of the whole‐mount slice. (H) The histology slices are quantified. (I) The pathology ROI is projected onto the matched MRI. (J) The ROI is propagated to the quantitative histology and MRI.
2.4. Immunohistochemical staining and quantification
After fixation, tissue was dehydrated in a series of ethanol and embedded in paraffin. Four micrometer‐thick sections were cut on a Leica Polycut S Microtome (Reichert Inc., Depew, NY), and tissue sections were deparaffinized in xylene and rehydrated in a series of ethanol. Whole‐mount slides were histochemically stained with hematoxylin (Klinipath; VWR International, Radnor, PA, USA) and eosin (H&E) and stained for collagen with Picrosirius Red (PSR; Brunschwig, Basel, Switzerland). For immunohistochemical (IHC) staining, sections were incubated in 0.3% hydrogen peroxide in methanol for 10 min. For endothelial staining, heat‐induced epitope retrieval (HIER) was performed in 0.25% pepsin (Sigma, Saint Louis, MO, USA) in 0.01 m hydrochloric acid for 15 min at 37 °C. von Willebrand factor antibody (VWF, Agilent, Santa Clara, CA, USA) was diluted in normal antibody diluent (Klinipath, 1 : 2000), and sections were incubated at 4 °C overnight. For hypoxia staining, HIER was performed in Tris/EDTA buffer solution at pH 9.0 (Lab Vision PT Module, Thermo Scientific, Waltham, MA, USA) for 15 min at 98 °C. Hypoxia‐inducible factor 1‐alpha (HIF‐1α) antibody (Clone 54, BD Biosciences, Franklin Lakes, NJ, USA) was diluted in normal antibody diluent (1 : 100), and sections were incubated at 4 °C overnight. Subsequently, for all IHC stainings BrightVision+ post‐antibody block was applied on the sections for 15 min at room temperature followed by secondary antibody BrightVision Poly‐HRP‐Anti Ms/Rb IgG (both Immunologic; VWR International) for 30 min at room temperature. Staining was developed using Bright‐DAB (Immunologic), and sections were mounted in Pertex mounting medium (Histolab, Askim, Sweden). PSR, VWF, and HIF‐1α slides were digitized with an Olympus dotSlide virtual slide microscope (Olympus, Tokyo, Japan) using a 10× magnification.
Quantification of the digitized stained slices was performed using a custom pipeline in matlab. PSR‐stained slides were converted into the (CIE)Lab color space, with a 3‐axis color system with dimension L for lightness and a and b for the color dimensions, and an absolute threshold was applied to the a‐channel (green to red) to quantify the percentage of collagen‐positive tumor tissue. For all DAB‐stained images (VWF, HIF‐1α), color deconvolution was performed separating the brown DAB staining (Brey et al., 2003). Next, this DAB channel was used to automatically determine a threshold in the tumor ROI using the maximum entropy approach to select positively stained pixels. For the VWF‐stained tissue, the number of positively stained separate elements after an 8‐connected component (bwconncomp, matlab) operation with a minimum size of 50 pixels was counted per mm2 to retrieve the vessel density. For HIF‐1α, the amount of positively stained nuclei, separate elements after an 8‐connected component (bwconncomp, matlab) operation with a maximum size of 200 pixels, in the tumor was expressed as a percentage of area.
2.5. ROI selections
Tumor ROIs were drawn on the whole‐mount H&E‐stained slides under a microscope by a pathologist (JV) specialized in HPB pathology with 15 years of experience (Fig. 1F) and copied to each separate digitized (Fig. 1G) and quantified (Fig. 1H) staining. For further analysis, average values from this ROI were used to determine percentage of collagen per area (PSR), vessel density per mm2 (VWF), and positively stained nuclei as percentage of area (HIF‐1α) for each tumor.
Based on the 3D matching of the pathology specimen to the MRI, the H&E‐based ROIs were projected onto the MRI and propagated onto the DCE and DWI parametric maps for two axial slices (Fig. 1I). Average values from these ROIs were calculated for each quantitative parameter and correlated to the quantified histology. In addition, IHC‐stained and quantified sections could be projected directly onto the MR images along with the quantitative MR parameter maps (Fig. 1J).
Since histopathology matching is not available in clinical routine, separate ROIs were determined solely based on the available imaging. Parametric maps of DCE and DWI were projected on the anatomical mDIXON image using 3d slicer. ROIs were drawn in evidently cancerous pancreas, showing lower perfusion and/or infiltration on the mDIXON image, by a radiologist (MRWE) with 9 years of experience in reading abdominal MR images and a researcher (RK) with 4 years of experience in pancreatic MRI. When necessary, contrast‐enhanced CT scans were viewed next to the MRI imaging for further reference. Care was taken not to include biliary stents in the ROI when present.
2.6. Statistical analysis
Statistical analyses were performed in graphpad prism (v5.01; GraphPad Software, La Jolla, CA, USA), r (v3.4.4; R Core Team, 2018, R Foundation for Statistical Computing, Vienna, Austria), and spss (version 24; IBM Corp., Armonk, NY, USA).
Normality of the MRI and histology data was confirmed by the Kolmogorov–Smirnov test (P > 0.05). Pearson's correlation coefficients were calculated between IHC and MRI parameters in the pathology ROI and between MRI parameters for the clinical ROI. Values were compared between patients with histology‐derived good‐to‐moderate (grades 1–2) and poor tumor differentiation (grade 3) by Student's t‐test. Overall survival (OS) was calculated from the time of the MRI scan to the time of death after discharge or until last follow‐up. Disease‐free survival (DFS) was defined as the time between MRI and progressive disease determined at surgical exploration or return of disease during follow‐up. The maximum difference in log‐rank test approach was used to determine prognostic value of the clinical ROI MRI parameters for OS (Budczies et al., 2012). Kaplan–Meier curves were drawn, and a log‐rank test and Cox proportional hazards model were used to determine significance between groups. A multivariate Cox proportional hazards model was applied for the MRI parameters demonstrating a univariate relation for the patients that underwent resection, adding T‐stage at resection (TNM7), resection margins (R‐stage), patient age, and gender.
3. Results
3.1. Patients
From the 37 patients initially included in the study, data of 30 patients could be used for analyses. Two patients did not undergo MRI scanning due to early progression and a late detected contraindication for MRI scanning. Five patients were excluded after MRI scanning, due to different underlying etiologies of the pancreatic lesions determined at histopathological examination of the resection specimen (1 cholangiocarcinoma, 1 nonmalignant intraductal papillary mucinous neoplasm, 1 pancreatitis, and 2 neuro‐endocrine tumors). Of these 30 patients, 21 underwent a resection and whole‐mount histology was available in 15 patients (Fig. 2). Patient demographics are summarized in Table 2.
Fig. 2.
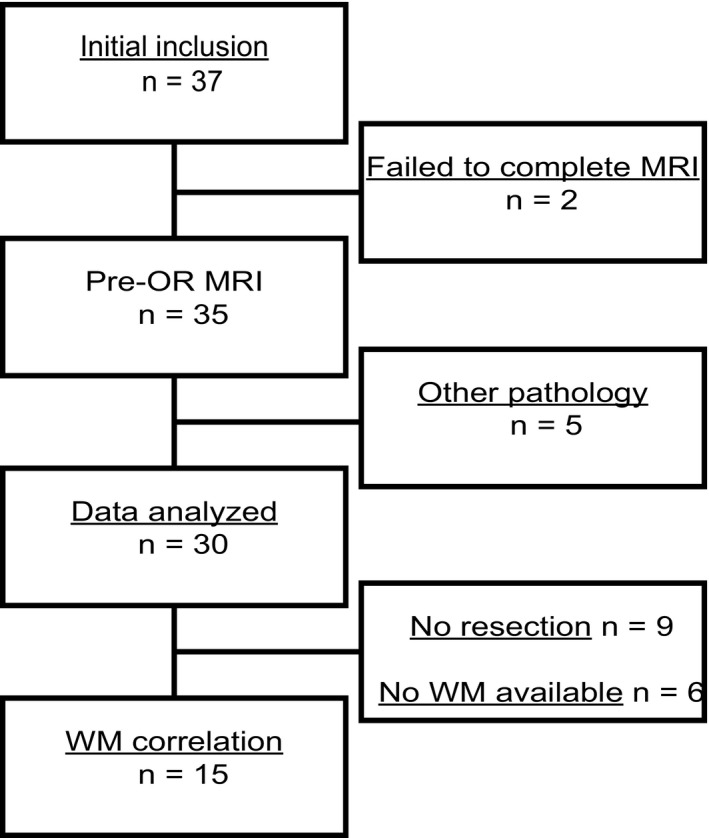
Patient inclusion. Initially, 37 patients were included in the study. Two patients did not undergo MRI scanning, and five patients were excluded after MRI scanning. The resulting data of 30 patients were used for further analyses, of which 21 underwent resection and whole‐mount (WM) histology was available in 15 patients.
Table 2.
Basic patient characteristics for all patients included in the analyses. M1, metastasized disease; LA, locally advanced disease; FU, follow‐up; CI, confidence interval.
| Variable | Value (range) |
|---|---|
| Number of patients | 30 |
| Mean age (years) | 63 (47–81) |
| Gender | |
| Male | 18 |
| Female | 12 |
| Tumor location | |
| Head | 25 |
| Corpus | 2 |
| Tail | 3 |
| Tumor diameter PA (mm) | 33 (15–55) |
| Resection | |
| No | 9 [8 M1, 1 LA] |
| R0 | 10 |
| R1 | 11 |
| Differentiation grade | |
| Well | 2 |
| Moderate | 8 |
| Poor | 9 |
| No resection | 9 |
| Missing | 2 |
| Time between MRI and Surgery (days) | 9 (1–32) |
| Median FU (months, 95% CI) | 41 (36–46) |
| Median OS (months, 95% CI) | 18 (14–22) |
| Median DFS (months, 95% CI) | 8 (1–14) |
3.2. Quantitative MRI correlates with histology
For the 15 patients from whom whole‐mount histology was available, the whole‐mount H&E‐based tumor ROIs were propagated to the MRI. Resulting median MRI ROI volumes were 2.9 cm3 (range 1.5–4.9 cm3) for DWI (n = 15) and 1.9 cm3 (range 1.2–4.9 cm3) for DCE and R2* (n = 15). Since the ROI was propagated to two MRI slices and the slice thickness was different between the MRI sequences for DCE/T2* and DWI, the resulting ROI volumes were different. For DCE analysis, a median of 89% (range 57–100%) of the voxels showed a reliable fit result (v e < 1.0) in the pathology ROI. IVIM fits resulted in a median R 2 in the pathology ROI of 0.73 (range 0.34–0.89).
We then set out to assess whether the three relevant biological characteristics of PDAC – collagen fraction, vessel density, and hypoxia – could be assessed with functional MR. Mean parameter values for DCE, R2*, and DWI and relevant correlation coefficients with parameters derived from histology are summarized in Table 3. An example of a patient MRI showing the quantitative parameter maps with corresponding histopathology is shown in Fig. 3A,B. We observed a significant correlation between PSR, as a measure of collagen fraction, and DCE K trans and v e (Fig. 3C,D) as well as IVIM D and ADC (Fig. 3G,H). VWF, quantifying vessel density, correlated significantly with DCE k ep (Fig. 3E) and IVIM f (Fig. 3I). The amount of HIF‐1α positively stained nuclei, as a measure of hypoxia, demonstrated a significant association with R2* (Fig. 3F). There was a significant difference in IVIM D between tumor differentiation grades (Fig. 3J).
Table 3.
Mean values and correlations between MRI and histology‐derived parameters in the pathology ROI. r, Pearson's correlation coefficient; v p, blood plasma volume.
| Parameter |
PSR Collagen fraction (%) |
VWF Vessel density (mm−2) |
HIF‐1α Hypoxia (mm−2) |
||||
|---|---|---|---|---|---|---|---|
| Mean ± SD | 42.81 ± 12.50 | 83.86 ± 14.21 | 933.5 ± 249.3 | ||||
| r | P | r | P | r | P | ||
| K trans (min−1) | 0.20 ± 0.07 | 0.76 | < 0.001 | 0.10 | 0.717 | 0.38 | 0.184 |
| k ep (min−1) | 0.45 ± 0.12 | 0.10 | 0.722 | 0.61 | 0.017 | 0.09 | 0.768 |
| v e (–) | 0.46 ± 0.13 | 0.73 | 0.002 | −0.44 | 0.098 | 0.28 | 0.329 |
| v p (–) | 0.03 ± 0.02 | 0.53 | 0.042 | 0.17 | 0.551 | 0.26 | 0.360 |
| R2* (Hz) | 28.56 ± 14.31 | 0.19 | 0.510 | 0.05 | 0.850 | 0.56 | 0.039 |
| ADC (10−3 mm2·s−1) | 1.48 ± 0.25 | 0.62 | 0.014 | 0.16 | 0.568 | 0.33 | 0.254 |
| IVIM D (10−3 mm2·s−1) | 1.32 ± 0.25 | 0.75 | 0.001 | −0.15 | 0.598 | 0.35 | 0.223 |
| IVIM f (%) | 5.49 ± 3.57 | −0.23 | 0.416 | 0.65 | 0.009 | −0.01 | 0.979 |
| IVIM D* (10−3 mm2·s−1) | 94.02 ± 55.51 | 0.21 | 0.456 | −0.20 | 0.486 | 0.17 | 0.551 |
Bold values indicates P < 0.05
Fig. 3.
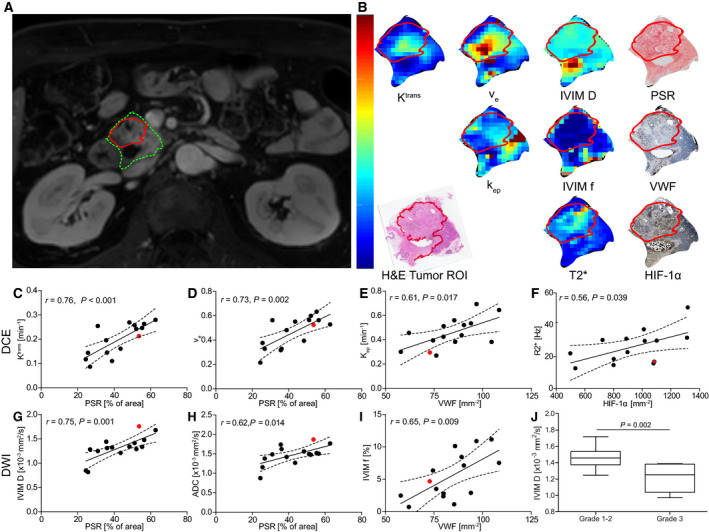
Correlations between histology and quantitative MRI‐derived parameters. (A) Anatomical MRI with pancreatic head (green) and tumor ROI (red). (B) Quantitative MRI parameter maps and histology depicted for one patient. Correlation plots for the DCE parameters (C–E), R2* (F), and DWI parameters (G–I) that demonstrated a significant correlation with histology (Pearson's correlation coefficient r < 0.05, n = 15). The patient from A and B is depicted in red. (J) Tumors with histological differentiation grades 1–2 (n = 8) demonstrated significantly higher diffusivity (IVIM D 1.47 ± 0.17 × 10⁻³ mm2·s−1 vs. 1.15 ± 0.22 × 10⁻³ mm2·s−, P = 0.002, Student's t‐test), compared to grade 3 tumors (n = 7). Error bars showing min‐max.
4. Quantitative MRI parameters show prognostic potential
For survival analysis, the clinical MRI ROIs from all 30 included patients were used. These ROIs resulted in median surface area of 3.2 cm2 (range: 1.8–6.6 cm2). For DCE analysis, a median of 85% (range 21–100%) of the voxels showed a reliable fit result (v e < 1.0) in the clinical MRI ROI. IVIM fits resulted in a median R 2 in the clinical MRI ROI of 0.75 (range 0.47–0.92). Correlations between the different MRI parameters are summarized in Table 4. DCE k ep and IVIM f (r = 0.54, P = 0.002) demonstrated a positive correlation, and both correlated to vessel density in the comparison to histology.
Table 4.
Mean MRI parameter values and correlations in the clinical ROI. r, Pearson's correlation coefficient, with in bold all values with p<0.05; v p, blood plasma volume.
| Parameter | Mean | SD | K trans | k ep | v e | v p | R2* | ADC | D | f | ||||||||
|---|---|---|---|---|---|---|---|---|---|---|---|---|---|---|---|---|---|---|
| r | P | r | P | r | P | r | P | r | P | r | P | r | P | r | P | |||
| K trans (min−1) | 0.22 | 0.09 | ||||||||||||||||
| k ep (min−1) | 0.43 | 0.14 | 0.49 | 0.006 | ||||||||||||||
| v e (–) | 0.53 | 0.15 | 0.71 | 0.000 | −0.20 | 0.290 | ||||||||||||
| v p (–) | 0.03 | 0.02 | 0.61 | 0.000 | 0.42 | 0.023 | 0.35 | 0.060 | ||||||||||
| R2* (Hz) | 28.66 | 14.13 | 0.26 | 0.356 | 0.05 | 0.869 | 0.23 | 0.410 | −0.10 | 0.722 | ||||||||
| ADC (10−3 mm2·s−1) | 1.55 | 0.22 | 0.03 | 0.886 | 0.20 | 0.299 | −0.14 | 0.454 | 0.06 | 0.758 | 0.13 | 0.657 | ||||||
| D (10−3 mm2·s−1) | 1.36 | 0.18 | −0.18 | 0.344 | −0.06 | 0.765 | −0.15 | 0.425 | −0.07 | 0.706 | 0.01 | 0.972 | 0.80 | 0.000 | ||||
| f (%) | 5.55 | 3.26 | 0.30 | 0.112 | 0.54 | 0.002 | −0.16 | 0.405 | 0.16 | 0.409 | 0.21 | 0.462 | 0.34 | 0.069 | −0.14 | 0.462 | ||
| D* (10−3 mm2·s−1) | 80.25 | 44.39 | 0.05 | 0.788 | −0.05 | 0.785 | −0.01 | 0.971 | −0.21 | 0.261 | −0.03 | 0.923 | −0.21 | 0.259 | −0.18 | 0.346 | 0.32 | 0.080 |
Bold values indicates P < 0.05.
Based on the maximum difference in log‐rank test approach, we were able to identify prognostic cutoff values for k ep and IVIM D. Patients with k ep > 0.397 min−1 (n = 15) demonstrated longer OS and DFS compared to patients with lower k ep (Fig. 4B,C). The cutoff for IVIM D (1.375 × 10⁻³ mm2·s−1) divided the group into 16 patients with high and 14 with low IVIM D, demonstrating longer OS and DFS for the patient with higher tumor diffusivity (Fig. 4D,E).
Fig. 4.
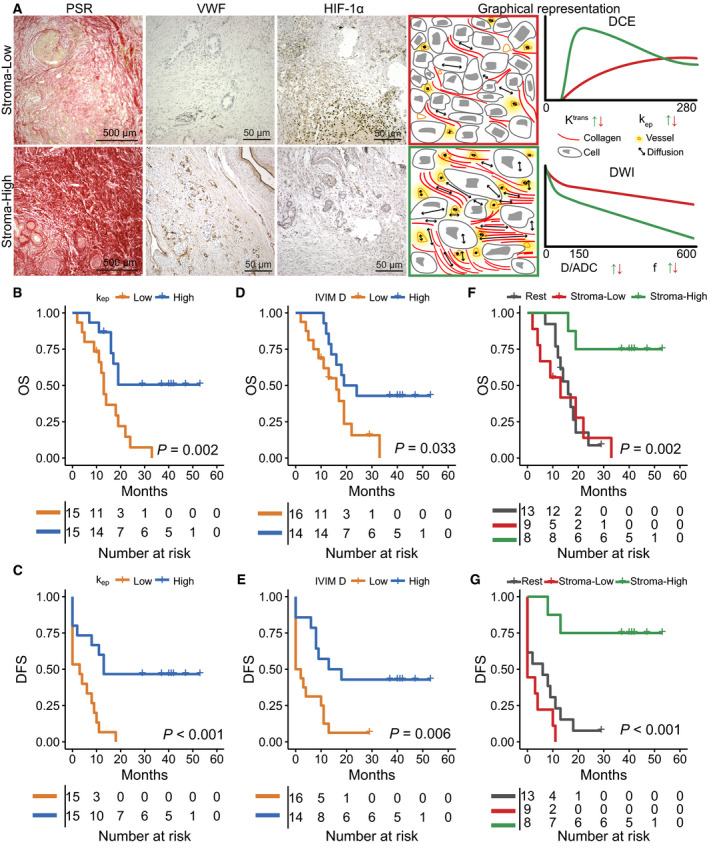
Survival analyses for the entire patient population. (A) The differences between tumor phenotypes (stroma‐high, stroma‐low) are illustrated for two patients for PSR, VWF, and HIF‐1α along with the theoretical signal curves from both DCE and DWI. The stroma‐low phenotype demonstrates low collagen fraction and low vessel density, resulting in DCE to detect reduced contrast transfer to the interstitial space (K trans) with low perfusion (k ep). IVIM demonstrates a lower vessel fraction and a reduction in diffusivity due to the reduced interstitial space. In the stroma‐high phenotype, the increased vessel density and the increase in interstitial space induced by excessive collagen deposition result in higher k ep and an increase in both v e and K trans. IVIM demonstrates a higher vessel fraction and high diffusivity. (B, C) Based on the maximum difference in log‐rank test approach, k ep was prognostic for OS (X vs. 13 months, P = 0.002, HR: 3.7, P = 0.005, n = 30) and DFS (13 vs. 3 months, P < 0.001, HR: 3.8, P = 0.004, n = 30), with X being the median survival not yet reached. (D, E) IVIM D was prognostic for OS (19 vs. 16 months, P = 0.033, HR: 2.5, P = 0.043, n = 30) and DFS (13 vs. 0 months, P = 0.006, HR: 3.0, P = 0.016, n = 30). (F, G) The combination of k ep and IVIM D into tumor phenotypes (stroma‐low, stroma‐high) improved the prognostic value for both OS (X vs. 14 months, P = 0.002, HR: 9.1, P = 0.004, n = 30) and DFS (X vs 2 months, P < 0.001, HR: 9.3, P = 0.003, n = 30). With P‐values for survival differences being derived from log‐rank tests and for HR from Cox regression.
Combining the findings from the histological correlation and survival analysis, two main phenotypes could be distinguished, a stroma‐high phenotype demonstrating high vessel density and high collagen fraction and a stroma‐low phenotype demonstrating low vessel density and low collagen fraction. In Fig. 4A, the typical difference in tumor biology between these two phenotypes is illustrated. Patients with the stroma‐high phenotype (high k ep and high IVIM D, n = 8) showed longer OS compared to the other patients (Fig. 4F,G).
At the time of surgical exploration, nine patients turned out to have metastatic or irresectable disease. No significant differences in imaging parameter between patients with resectable and unresectable tumors were found. However, since the latter were subsequently treated with palliative rather than curative intent, we repeated the survival analysis for patients who underwent a resection of the primary tumor. In this group, k ep was still prognostic for OS and DFS (Fig. 5A,B). Multivariate Cox regression demonstrated that k ep was an independent predictor for OS (HR = 5.8, P = 0.012, n = 19) and DFS (HR = 8.0, P = 0.022, n = 19) in addition to standard clinical parameters. IVIM D was not prognostic for OS or DFS in this subset of patients (Fig. 5C,D). The stroma‐high phenotype still showed longer OS and DFS (Fig. 5E,F). Multivariate analysis on the subtypes also showed the added value of the imaging parameters for predicting OS (HR: 19.5, P = 0.039) and DFS (HR: 23.5, P = 0.02).
Fig. 5.
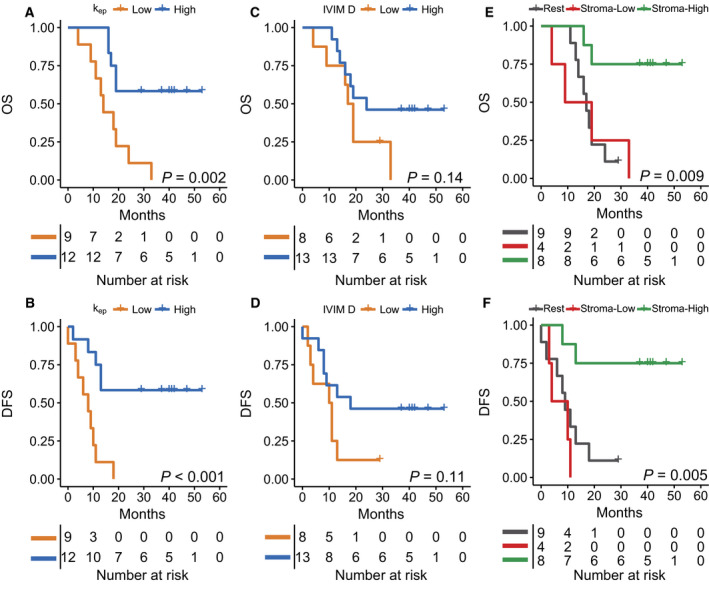
Survival analyses for the patient that underwent resection of the primary tumor. (A, B) k ep was prognostic for OS (X vs. 14 months, P = 0.002, HR: 4.7, P = 0.007, n = 21) and DFS (X vs. 8 months, P < 0.001, HR: 5.7, P = 0.003, n = 21). (C, D) IVIM D was not prognostic for OS (24 vs 17 months, P = 0.14, HR: 2.1, P = 0.16, n = 21) or DFS (18 vs. 10 months, P = 0.11, HR: 2.3, P = 0.13, n = 21). (E, F) The combination of k ep and IVIM D into phenotypes was prognostic for both OS (X vs. 17, P = 0.009, HR: 7.8, P = 0.009, n = 21) and DFS (X vs. 9, P = 0.005, HR: 7.5, P = 0.009, n = 21). With P‐values for survival differences being derived from log‐rank tests and for HR from Cox regression.
5. Discussion
In this preliminary study, we found that quantitative MRI parameters correlate with tumor collagen fraction, vessel density, and hypoxia, which are considered important hallmarks in determining the poor outcome of PDAC. Using quantitative MRI, we identified two PDAC phenotypes, stroma‐high and stroma‐low, which were associated with significant differences in prognosis.
Multiple clinical (Bali et al., 2011; Ma et al., 2016; Xu et al., 2017) and preclinical (Wegner et al., 2016, 2017; Wu et al., 2015) studies have investigated the relations between DCE‐derived quantitative parameters and histological tissue properties in PDAC. However, none of these studies performed an extensive pathology matching procedure as done in this study. We found a positive correlation between K trans, v e, and collagen fraction. Although we did not find a correlation between vascular density and K trans as was found in a preclinical setting (Wegner et al., 2017), we did find that K trans is associated with the amount of collagen deposition in the tumor. In addition, when K trans was divided by the extracellular compartment (v e), which we and others have associated with collagen deposition in a (pre)clinical setting (Bali et al., 2011; Ma et al., 2016; Wegner et al., 2016; Xu et al., 2017), we found that the resulting k ep was able to detect the relatively small differences in vascularity between PDAC tumors. This might suggest that vascular flow and permeability in PDAC are more dependent on the tumor micro‐environmental properties associated with a collagen‐rich microenvironment than the actual amount of vessels that are present.
In some parts of the tumor with very low perfusion, information is hard to extract using a perfusion‐based method as DCE, due to the lack of contrast enhancement in these regions. This is not an issue for IVIM f, an IVIM‐based measure for perfusion fraction, which also demonstrated a correlation with tumor vascularity from histology. Thus far, only one other study found a positive correlation between IVIM f and vessel density in PDAC (Klauss et al., 2015). However, this study also included highly perfused neuro‐endocrine tumors. Although in our study IVIM f did show a correlation with both tumor vascularity and k ep, it did not associate with survival. The limited reproducibility of IVIM f, as we demonstrated previously (Gurney‐Champion et al., 2018), and the more limited image quality of the quantitative maps to determine an image‐based ROI could explain this result.
Studies investigating the correlation between DWI, collagen deposition, and cellular density in PDAC have reported contradictory results. Some studies have demonstrated a positive correlation between collagen deposition and ADC (Heid et al., 2016; Klauss et al., 2013), where others demonstrated lower diffusivity in dense fibrosis (Hecht et al., 2017; Ma et al., 2016; Muraoka et al., 2008; Xu et al., 2017) or no correlation between ADC and stromal content (Xie et al., 2015). However, none of these studies included a histological comparison as large and detailed as our whole‐mount approach. Heid et al. (2016) demonstrated recently that ADC correlates inversely with cellular density. This would support our current findings since, for PDAC tumors with high cellular density, collagen fraction is lower and vice versa.
Our survival analysis demonstrated that higher tumor diffusivity is a good prognostic factor. This is in line with earlier studies investigating the prognostic value of ADC in PDAC (Heid et al., 2016; Kurosawa et al., 2015). DCE‐derived k ep performed even better as prognostic marker in our study. Although tumor vascularity is a known prognostic factor in PDAC (Hoem et al., 2013), so far only one imaging‐based study demonstrated a difference in survival, based on static contrast enhancement on CT (Fukukura et al., 2014). Patients demonstrating a stroma‐high phenotype had better outcome. From a biology perspective, these tumors are characterized by dense collagen content and good vascularization and are relatively well differentiated. This suggests that collagen and tumor stroma can have a protective, or tumor‐constraining, role in PDAC. This is supported by a recent clinical study, indicating that the presence of stroma restrains the progression of basal‐like tumors and improves survival in patients with stroma‐activated and desmoplastic tumor subtypes, whereas for well‐differentiated tumors, survival is reduced when a stromal signal is present (Puleo et al., 2018). In addition, preclinical studies in genetically engineered mouse models revealed that depletion of the tumor stroma as a treatment strategy for PDAC resulted in more aggressive, dedifferentiated tumors and reduced survival (Özdemir et al., 2014; Rhim et al., 2014). In addition, phase I and II trials using IPI‐926 – a Hedgehog inhibitor depleting the tumor‐associated stroma – were stopped early due to detrimental effects: PDAC patients receiving this regimen showed shorter survival (Catenacci et al., 2013). However, whether the differentiation grade of tumor cells defines the stromal content or the stromal cells define the differentiation grade of tumor cells remains to be elucidated. Especially, stroma‐low tumors, where vessel density is low, would also be prone to develop hypoxia, another known prognostic factor in PDAC (Kitada et al., 2003). We could not find a direct correlation between vascularization, diffusivity, and HIF‐1α positivity in our study. R2* on the other hand did show an association with tumor hypoxia, which implies that PDAC hypoxia is driven by a complex combination of factors and could benefit from more targeted imaging strategies (Klaassen et al., 2015).
Some limitations of our study should be taken into account. First, for both histological correlations and survival analysis the number of patients investigated is limited. However, our approach of directly matching the histology to the MR does add to the validity of the found correlations between histology and quantitative imaging. Furthermore, the prognostic value found for DWI is in line with previous findings. Second, the larger voxel size of MRI compared to histology makes comparison of intratumoral regions more difficult, and in our current approach, only one 4‐µm slice was available from histology. We therefore correlated average values derived from only one tumor slice, thereby neglecting intratumor heterogeneity in the current analyses. The addition of a MRI‐based 3D mold to enable more accurate slicing and orientation of the pathology specimen relative to the MRI (Costa et al., 2017) might help to improve the match between MRI and histology and facilitate heterogeneity analysis. Third, the generalizability of our findings could be limited by the variation in acquisition and postprocessing methods available and standardization of these imaging methods is necessary when implementing these techniques on a larger scale (O'Connor et al., 2017; QIBA, 2012, 2019; Taouli et al., 2016).
6. Conclusions
In conclusion, quantitative MRI methods are able to quantify tumor collagen fraction, vessel density, and hypoxia in PDAC. Based on the imaging‐derived characteristics, we identified that patients with a stroma‐high phenotypes, described by a high collagen fraction and high vessel density, and demonstrated significantly better outcome compared to other patients. These findings may help to improve stratification of patients for treatment and warrant further research on this topic.
Conflict of interest
HWML has acted as a consultant for BMS, Eli Lilly and Company, and Nordic Pharma Group/Taiho, and has received unrestricted research grants from Amgen, Bayer Schering Pharma AG, BMS, Celgene, Eli Lilly and Company, GlaxoSmithKline Pharmaceuticals, MSD, Nordic Pharma Group, Philips, and Roche Pharmaceuticals. MFB has received research funding from Celgene. JWW has received research funding from Celgene and Novartis. JS has acted as consultant for Robarts Clinical Trials concerning MRI in Crohn's disease. None of these companies were involved in the design of the study; collection, analysis, or interpretation of the data; drafting of the manuscript; or the decision to submit the manuscript for publication. All other authors declare no conflict of interest.
Author contributions
RK and AS collected, analyzed, and interpreted the data; wrote the draft manuscript; and prepared the figures. OJG‐C, AJN, and RK optimized the imaging protocols and performed image processing. MRWE and RK reviewed the imaging data. JV, MJV, OJB, GKJH, and AS facilitated and performed the immunohistochemistry and pathology analyses. RK and AS performed immunohistochemistry quantification. GT, MGB, ORB, JWW, CHJE, and MS were clinical investigators and contributed to data collection and patient inclusion. HWML, MFB, JS, and AJN designed and coordinated the study and reviewed the data. All authors contributed to the final manuscript.
Acknowledgements
This work was supported by the Dutch Cancer Society – Alpe d'HuZes Grant no: UVA‐2013.5932. We want to thank Renee Sersansie, Bram Nagel, Jos Mulder, and Eelco Roos from the Department of Pathology, Amsterdam UMC, for help with processing, staining, and scanning of whole‐mount tissue sections.
Remy Klaassen and Anne Steins contributed equally to this article
References
- Bailey P, Chang DK, Nones K, Johns AL, Patch AM, Gingras MC, Miller DK, Christ AN, Bruxner TJ, Quinn MC et al (2016) Genomic analyses identify molecular subtypes of pancreatic cancer. Nature 531, 47–52. [DOI] [PubMed] [Google Scholar]
- Bali MA, Metens T, Denolin V, Delhaye M, Demetter P, Closset J and Matos C (2011) Tumoral and nontumoral pancreas: correlation between quantitative dynamic contrast‐enhanced MR imaging and histopathologic parameters. Radiology 261, 456–466. [DOI] [PubMed] [Google Scholar]
- Brey EM, Lalani Z, Johnston C, Wong M, McIntire LV, Duke PJ and Patrick CW (2003) Automated selection of DAB‐labeled tissue for immunohistochemical quantification. J Histochem Cytochem 51, 575–584. [DOI] [PubMed] [Google Scholar]
- Budczies J, Klauschen F, Sinn BV, Győrffy B, Schmitt WD, Darb‐Esfahani S and Denkert C (2012) Cutoff Finder: a comprehensive and straightforward Web application enabling rapid biomarker cutoff optimization. PLoS ONE 7, e51862. [DOI] [PMC free article] [PubMed] [Google Scholar]
- Catenacci DVT, Bahary N, Nattam SR, Marsh RW, Wallace JA, Rajdev L, Cohen DJ, Sleckman BG, Lenz H‐J, Stiff PJ et al (2013) Final analysis of a phase IB/randomized phase II study of gemcitabine (G) plus placebo (P) or vismodegib (V), a hedgehog (Hh) pathway inhibitor, in patients (pts) with metastatic pancreatic cancer (PC): a University of Chicago phase II consortium study. J Clin Oncol 31, 4012. [DOI] [PMC free article] [PubMed] [Google Scholar]
- Costa DN, Chatzinoff Y, Passoni NM, Kapur P, Roehrborn CG, Xi Y, Rofsky NM, Torrealba J, Francis F, Futch C et al (2017) Improved magnetic resonance imaging‐pathology correlation with imaging‐derived, 3D‐printed, patient‐specific whole‐mount molds of the prostate. Invest Radiol 52, 507–513. [DOI] [PMC free article] [PubMed] [Google Scholar]
- Fedorov A, Beichel R, Kalpathy‐Cramer J, Finet J, Fillion‐Robin J‐CC, Pujol S, Bauer C, Jennings D, Fennessy F, Sonka M et al (2012) 3D Slicer as an image computing platform for the Quantitative Imaging Network. Magn Reson Imaging 30, 1323–1341. [DOI] [PMC free article] [PubMed] [Google Scholar]
- Feig C, Gopinathan A, Neesse A, Chan DS, Cook N and Tuveson DA (2012) The pancreas cancer microenvironment. Clin Cancer Res 18, 4266–4276. [DOI] [PMC free article] [PubMed] [Google Scholar]
- Fukukura Y, Takumi K, Higashi M, Shinchi H, Kamimura K, Yoneyama T and Tateyama A (2014) Contrast‐enhanced CT and diffusion‐weighted MR imaging: performance as a prognostic factor in patients with pancreatic ductal adenocarcinoma. Eur J Radiol 83, 612–619. [DOI] [PubMed] [Google Scholar]
- Gurney‐Champion OJ, Froeling M, Klaassen R, Runge JH, Bel A, van Laarhoven HWMM, Stoker J and Nederveen AJ (2016) Minimizing the acquisition time for intravoxel incoherent motion magnetic resonance imaging acquisitions in the liver and pancreas. Invest Radiol 51, 211–220. [DOI] [PubMed] [Google Scholar]
- Gurney‐Champion OJ, Klaassen R, Froeling M, Barbieri S, Stoker J, Engelbrecht MRW, Wilmink JW, Besselink MG, Bel A, van Laarhoven HWM et al (2018) Comparison of six fit algorithms for the intra‐voxel incoherent motion model of diffusion‐weighted magnetic resonance imaging data of pancreatic cancer patients. PLoS ONE 13, e0194590. [DOI] [PMC free article] [PubMed] [Google Scholar]
- Hecht EM, Liu MZ, Prince MR, Jambawalikar S, Remotti HE, Weisberg SW, Garmon D, Lopez‐Pintado S, Woo Y, Kluger MD et al (2017) Can diffusion‐weighted imaging serve as a biomarker of fibrosis in pancreatic adenocarcinoma? J Magn Reson Imaging 46, 393–402. [DOI] [PubMed] [Google Scholar]
- Heid I, Steiger K, Trajkovic‐Arsic M, Settles M, Eßwein MR, Erkan M, Kleeff J, Jäger C, Friess H, Haller B et al (2016) Co‐clinical assessment of tumor cellularity in pancreatic cancer. Clin Cancer Res 11, 1–15. [DOI] [PubMed] [Google Scholar]
- Hoem D, Straume O, Immervoll H, Akslen LA and Molven A (2013) Vascular proliferation is associated with survival in pancreatic ductal adenocarcinoma. APMIS 121, 1037–1046. [DOI] [PubMed] [Google Scholar]
- Hoskin PJ, Carnell DM, Taylor NJ, Smith RE, Stirling JJ, Daley FM, Saunders MI, Bentzen SM, Collins DJ, d'Arcy JA et al (2007) Hypoxia in prostate cancer: correlation of BOLD‐MRI with pimonidazole immunohistochemistry—initial observations. Int J Radiat Oncol 68, 1065–1071. [DOI] [PubMed] [Google Scholar]
- Kitada T, Seki S, Sakaguchi H, Sawada T, Hirakawa K and Wakasa K (2003) Clinicopathological significance of hypoxia‐inducible factor‐1α expression in human pancreatic carcinoma. Histopathology 43, 550–555. [DOI] [PubMed] [Google Scholar]
- Klaassen R, Bennink RJ, van Tienhoven G, Bijlsma MF, Besselink MGH, van Berge Henegouwen MI, Wilmink JW, Nederveen AJ, Windhorst AD, Hulshof MC et al (2015) Feasibility and repeatability of PET with the hypoxia tracer [18F]HX4 in oesophageal and pancreatic cancer. Radiother Oncol 116, 94–99. [DOI] [PubMed] [Google Scholar]
- Klaassen R, Gurney‐Champion OJ, Engelbrecht MRW, Stoker J, Wilmink JW, Besselink MG, Bel A, van Tienhoven G, van Laarhoven HWM and Nederveen AJ (2018a) Evaluation of six diffusion‐weighted MRI models for assessing effects of neoadjuvant chemoradiation in pancreatic cancer patients. Int J Radiat Oncol 102, 1052–1062. [DOI] [PubMed] [Google Scholar]
- Klaassen R, Gurney‐Champion OJ, Wilmink JW, Besselink MG, Engelbrecht MRW, Stoker J, Nederveen AJ and van Laarhoven HWM (2018b) Repeatability and correlations of dynamic contrast enhanced and T2* MRI in patients with advanced pancreatic ductal adenocarcinoma. Magn Reson Imaging 50, 1–9. [DOI] [PubMed] [Google Scholar]
- Klauss M, Gaida MM, Lemke A, Grünberg K, Simon D, Wente MN, Delorme S, Kauczor HU, Grenacher L and Stieltjes B (2013) Fibrosis and pancreatic lesions: counterintuitive behavior of the diffusion imaging‐derived structural diffusion coefficient D. Invest Radiol 48, 129–133. [DOI] [PubMed] [Google Scholar]
- Klauss M, Mayer P, Bergmann F, Maier‐Hein K, Hase J, Hackert T, Kauczor HU, Grenacher L and Stieltjes B (2015) Correlation of histological vessel characteristics and diffusion‐weighted imaging intravoxel incoherent motion‐derived parameters in pancreatic ductal adenocarcinomas and pancreatic neuroendocrine tumors. Invest Radiol 50, 792–797. [DOI] [PubMed] [Google Scholar]
- Koong AC, Mehta VK, Le QT, Fisher GA, Terris DJ, Brown JM, Bastidas AJ and Vierra M (2000) Pancreatic tumors show high levels of hypoxia. Int J Radiat Oncol Biol Phys 48, 919–22. [DOI] [PubMed] [Google Scholar]
- Kurosawa J, Tawada K, Mikata R, Ishihara T, Tsuyuguchi T, Saito M, Shimofusa R, Yoshitomi H, Ohtsuka M, Miyazaki M et al (2015) Prognostic relevance of apparent diffusion coefficient obtained by diffusion‐weighted MRI in pancreatic cancer. J Magn Reson Imaging 42, 1532–1537. [DOI] [PubMed] [Google Scholar]
- Le Bihan D, Breton E, Lallemand D, Aubin ML, Vignaud J and Laval‐Jeantet M (1988) Separation of diffusion and perfusion in intravoxel incoherent motion MR imaging. Radiology 168, 497–505. [DOI] [PubMed] [Google Scholar]
- Lemke A, Laun FB, Klauss M, Re TJ, Simon D, Delorme S, Schad LR and Stieltjes B (2009) Differentiation of pancreas carcinoma from healthy pancreatic tissue using multiple b‐values: comparison of apparent diffusion coefficient and intravoxel incoherent motion derived parameters. Invest Radiol 44, 769–775. [DOI] [PubMed] [Google Scholar]
- Ma W, Li N, Zhao W, Ren J, Wei M, Yang Y, Wang Y, Fu X, Zhang Z, Larson AC et al (2016) Apparent diffusion coefficient and dynamic contrast‐enhanced magnetic resonance imaging in pancreatic cancer: characteristics and correlation with histopathologic parameters. J Comput Assist Tomogr 40, 709–716. [DOI] [PubMed] [Google Scholar]
- Muraoka N, Uematsu H, Kimura H, Imamura Y, Fujiwara Y, Murakami M, Yamaguchi A and Itoh H (2008) Apparent diffusion coefficient in pancreatic cancer: characterization and histopathological correlations. J Magn Reson Imaging 27, 1302–1308. [DOI] [PubMed] [Google Scholar]
- O'Connor JPBB, Aboagye EO, Adams JE, Aerts HJWLWL, Barrington SF, Beer AJ, Boellaard R, Bohndiek SE, Brady M, Brown G et al (2017) Imaging biomarker roadmap for cancer studies. Nat Rev Clin Oncol 14, 169–186. [DOI] [PMC free article] [PubMed] [Google Scholar]
- Özdemir BC, Pentcheva‐Hoang T, Carstens JL, Zheng X, Wu C‐CC, Simpson TR, Laklai H, Sugimoto H, Kahlert C, Novitskiy SV et al (2014) Depletion of carcinoma‐associated fibroblasts and fibrosis induces immunosuppression and accelerates pancreas cancer with reduced survival. Cancer Cell 25, 719–734. [DOI] [PMC free article] [PubMed] [Google Scholar]
- Puleo F, Nicolle R, Blum Y, Cros J, Marisa L, Demetter P, Quertinmont E, Svrcek M, Elarouci N, Iovanna J et al (2018) Stratification of pancreatic ductal adenocarcinomas based on tumor and microenvironment features. Gastroenterology 155, 1999–2013.e3. [DOI] [PubMed] [Google Scholar]
- QIBA (2012) Dynamic‐Contrast‐Enhanced Magnetic Resonance Imaging (DCE‐MRI) Technical Committee. DCE MRI quantification. Quantitative imaging biomarkers alliance. Available from: http://qibawiki.rsna.org/index.php/Profiles
- QIBA (2019) PDF‐MRI (Perfusion, Diffusion and Flow) Biomarker Committee. Diffusion‐weighted magnetic resonance imaging (DWI). Available from: http://qibawiki.rsna.org/index.php/Profiles
- Rhim AD, Oberstein PE, Thomas DH, Mirek ET, Palermo CF, Sastra SA, Dekleva EN, Saunders T, Becerra CP, Tattersall IW et al (2014) Stromal elements act to restrain, rather than support, pancreatic ductal adenocarcinoma. Cancer Cell 25, 735–747. [DOI] [PMC free article] [PubMed] [Google Scholar]
- Taouli B, Beer AJ, Chenevert T, Collins D, Lehman C, Matos C, Padhani AR, Rosenkrantz AB, Shukla‐Dave A, Sigmund E et al (2016) Diffusion‐weighted imaging outside the brain: consensus statement from an ISMRM‐sponsored workshop. J Magn Reson Imaging 44, 521–540. [DOI] [PMC free article] [PubMed] [Google Scholar]
- Thevenaz P, Ruttimann UE and Unser M (1998) A pyramid approach to subpixel registration based on intensity. IEEE Trans Image Process 7, 27–41. [DOI] [PubMed] [Google Scholar]
- Versteijne E, van Eijck CHJ, Punt CJA, Suker M, Zwinderman AH, Dohmen MAC, Groothuis KB, Busch OR, Besselink MG, de Hingh IH et al (2016) Preoperative radiochemotherapy versus immediate surgery for resectable and borderline resectable pancreatic cancer (PREOPANC trial): study protocol for a multicentre randomized controlled trial. Trials 17, 127. [DOI] [PMC free article] [PubMed] [Google Scholar]
- Wegner CS, Gaustad J‐V, Andersen LMK, Simonsen TG and Rofstad EK (2016) Diffusion‐weighted and dynamic contrast‐enhanced MRI of pancreatic adenocarcinoma xenografts: associations with tumor differentiation and collagen content. J Transl Med 14, 161. [DOI] [PMC free article] [PubMed] [Google Scholar]
- Wegner CS, Hauge A, Gaustad J‐V, Andersen LMK, Simonsen TG, Galappathi K and Rofstad EK (2017) Dynamic contrast‐enhanced MRI of the microenvironment of pancreatic adenocarcinoma xenografts. Acta Oncol (Madr) 56, 1754–1762. [DOI] [PubMed] [Google Scholar]
- Wu L, Lv P, Zhang H, Fu C, Yao X, Wang C, Zeng M, Li Y and Wang X (2015) Dynamic contrast‐enhanced(DCE) MRI Assessment of microvascular characteristics in the murine orthotopic pancreatic cancer model. Magn Reson Imaging 33, 737–760. [DOI] [PubMed] [Google Scholar]
- Xie P, Liu K, Peng W and Zhou Z (2015) The correlation between diffusion‐weighted imaging at 3.0‐T magnetic resonance imaging and histopathology for pancreatic ductal adenocarcinoma. J Comput Assist Tomogr 39, 697–701. [DOI] [PubMed] [Google Scholar]
- Xu C, Gu X, Zhang H and Wang Y (2017) Study of the correlation between MRI quantitative analysis and pathological features of pancreatic tumors. Int J Clin Exp Med 10, 6712–6719. [Google Scholar]