

Abstract
d‐3‐Phosphoglycerate dehydrogenase (PHGDH) conducts an important step in the synthesis of serine. Importantly, the PHGDH gene is often amplified in certain cancers. Our previous studies revealed that PHGDH gene amplification was associated with poor overall survival in clear cell renal cell carcinoma (ccRCC) and that metabolic reprogramming of serine synthesis through PHGDH recruitment allowed ccRCC cells to survive in unfavorable environments. There have been no investigations of the role of PHGDH expression in bladder cancer (BC). In this investigation, we examined the clinical importance of PHDGH in BC. Furthermore, we asked whether PHGDH expression could be exploited for BC therapy. Finally, we investigated the regulatory mechanisms that modulated the expression of PHGDH. Using data from The Cancer Genome Atlas, we found that patients with high‐grade BC had significantly higher PHGDH expression levels than did those with low‐grade BC. In addition, patients with high PHGDH expression did not survive as long as those with low expression. PHGDH downregulation by si‐RNAs or an inhibitor in BC cell lines significantly inhibited proliferative ability and induced apoptosis. Furthermore, combined treatment using a PHGDH inhibitor and gemcitabine/cisplatin achieved synergistic tumor suppression compared to use of a single agent both in vitro as well as in vivo. Mechanistic analyses of PHGDH regulation showed that PHGDH expression might be associated with DNA copy number and hypomethylation in BC. These findings suggest novel therapeutic strategies could be used in BC. Finally, our data enhance our understanding of the role of PHGDH in BC.
Keywords: apoptosis, bladder cancer, GC therapy, methylation, PHGDH
This research investigated PHGDH, a key enzyme in the serine biosynthesis, in bladder cancer. PHGDH downregulation significantly inhibited cell proliferation, and the combined treatment between PHGDH inhibitor and gemcitabine/cisplatin achieved synergistic tumor suppressive effect compared to each single agent group both in vitro and in vivo. We also indicated that PHGDH was regulated by DNA copy number and hypomethylation.

Abbreviations
- BC
bladder cancer
- ccRCC
clear cell renal cell carcinoma
- GC
gemcitabine and cisplatin
- PHGDH
d‐3‐phosphoglycerate dehydrogenase
- SAM
S‐adenosylmethionine
- TCGA
The Cancer Genome Atlas
- TdT
terminal deoxynucleotidyl transferase
1. Introduction
Bladder cancer (BC) is a frequent cause of death around the world (Antoni et al., 2017). Siegel et al. (2018) estimated that there were more than 81 000 BC patients in 2018, of whom more than 17 000 died in 2018 in the United States alone. BC consists of two types of disease: those that are nonmuscle‐invasive (NMIBC) and those that are muscle‐invasive (MIBC). The former constitute 70–80% of BC patients (Miller et al., 2016). The remaining patients diagnosed with localized MIBC are treated by radical cystectomy or radiotherapy, but they have poor outcomes. Half of the patients undergoing surgery show metastasis in under 2 years (Sternberg et al., 2013). Experience has shown that treatment of advanced BC with gemcitabine and cisplatin (GC) has limited efficacy, as the response rates are only 50% (Kaufman et al., 2009; Sternberg et al., 2013). Importantly, high rates of severe toxicities and inherent or acquired drug resistance are often observed (Bergman et al., 2002; Wang and Lippard, 2005). Based on data from the United States (Abdollah et al., 2013), the 5‐year survival rate following such treatment has only improved slightly in the last three decades. Treatment with antiprogrammed death‐1 (PD‐1) antibodies constitutes a different approach to advanced BC. However, the response rate was only 21.1%, and overall survival was enhanced by only a few months (Bellmunt et al., 2017). In addition, there are no reliable markers to indicate metastasis or recurrence. Therefore, new treatment options to increase chemosensitivity and novel prognostic markers are needed.
In the glycolytic scheme, d‐3‐phosphoglycerate dehydrogenase (PHGDH) is an oxido‐reductase that contributes to the biosynthesis of serine. To maintain rapid, sustained, and uncontrolled cell proliferation, cancer cells require serine, as it leads to one‐carbon units that contribute to de novo synthesis of purines and pyridines (Amelio et al., 2014). Importantly, the serine synthetic pathway converts about half of the cell's glutamate to α‐ketoglutarate when PHGDH is expressed at high levels. Therefore, PHGDH inhibition leads to a significant reduction of the tricarboxylic acid cycle (Amelio et al., 2014). Recently, it has been reported that PHGDH is amplified or overexpressed in various types of cancers (Locasale et al., 2011). Thus, it might offer a therapeutic target in both breast cancer and melanoma. We previously reported that metabolic reprogramming of serine synthesis thorough PHGDH recruitment was observed when hypoxia‐inducible factor 2a was knocked out in sunitinib‐resistant renal cell carcinoma. In addition, when the PHGDH gene was amplified, patients showed poorer (disease‐free survival) relative to patients lacking amplification (Yoshino et al., 2017a). Therefore, PHGDH might be a potential therapeutic target and biomarker for several cancers, a possibility that has not been investigated in BC.
In this study, we evaluated the clinical relevance of PHGDH in BC, and the efficacy of PHGDH inhibition in BC. We also evaluated the efficacy of combined PHGDH inhibition and GC treatment in vitro as well as in vivo. In addition, regulatory mechanisms associated with PHGDH in BC were analyzed, as this issue has not been examined in BC previously.
2. Materials and methods
2.1. Cell culture
The human BC cell line BOY (Yoshino et al., 2011) was established by our group. It originated from a 66‐year‐old Asian patient. He had been diagnosed with stage III BC with lung metastasis. Lines T24, KK47, J82, UMUC, MCF7, and MDAMB231 were purchased from the American Type Culture Collection (ATCC, Manassas, VA, USA). The cells were cultured for less than 30 continuous passages. The lines were found negative for mycoplasma (e‐Myco Mycoplasma PCR Detection Kit; iNtRON, Kyungki‐Do, Korea). These cell lines were maintained in minimum essential medium containing 10% FBS in a humidified atmosphere of 5% CO2 and 95% air at 37 °C. To check whether or not PHGDH expression was decreased by methylation, BC cells were treated with S‐adenosylmethionine (SAM) (B9003, New England Biolabs, Inc., Beverly, MA, USA) for 72 h.
2.2. RNA extraction and quantitative real‐time reverse transcription polymerase chain reaction
The Isogen (Nippon Gene, Tokyo, Japan) kit was used for extraction of total RNA following the manufacturer's protocol. A SYBR‐green quantitative PCR‐based array approach was used here as described (Yoshino et al., 2017b). The following primers were used: PHGDH, forward primer, 5′‐CTGCGGAAAGTGCTCATCAGT‐3′ and reverse primer, 5′‐TGGCAGAGCGAACAATAAGGC‐3′; PSAT1, forward primer, 5′‐TGCCGCACTCAGTGTTGTTAG‐3′ and reverse primer, 5′‐GCAATTCCCGCACAAGATTCT‐3′; PSPH, forward primer, 5′‐GAGGACGCGGTGTCAGAAAT‐3′ and reverse primer, 5′‐GGTTGCTCTGCTATGAGTCTCT‐3′; SHMT1, forward primer, 5′‐CTGGCACAACCCCTCAAAGA‐3′ and reverse primer, 5′‐AGGCAATCAGCTCCAATCCAA‐3′; and GUSB, forward primer, 5′‐CGTCCCACCTAGAATCTGCT‐3′, and reverse primer, 5′‐TTGCTCACAAAGGTCACAGG‐3′.
2.3. Immunoassays
The method of immunoblotting was previously described (Yoshino et al., 2017b). We used anti‐PHGDH antibodies (1 : 1000) (HPA021241; Sigma, St. Louis, MO, USA), anti‐Ki‐67 antibodies (1 : 1000, ab92742; Abcam, Cambridge, UK), anticleaved‐PARP antibodies (1 : 500, #5625; Cell Signaling Technology, Danvers, MA, USA), and anti‐β‐actin antibodies (1 : 2000, bs‐0061R; Bios, Woburn, MA, USA).
2.4. Assessment of cell growth, apoptosis, and colony formation
Loss‐of‐function experiments made use of PHGDH si‐RNA (catalogue nos. SASI_Hs01_00041882 and SASI_Hs01_00041884; Sigma) and negative‐control si‐RNA (D‐001810‐10; Thermo Fisher Scientific, Waltham, MA, USA). PHGDH inhibitors included CBR‐5884 (Focus Biomolecules, Plymouth Meeting, PA, USA) and NCT‐503 (AOBIOUS, Gloucester, MA, USA) as previously described (Pacold et al., 2016). DMSO was used to dilute both inhibitors following the manufacturer's recommendations. Cell proliferation was determined with XTT assays (Roche Applied Science, Tokyo, Japan) according to the manufacturer's instructions. Cell apoptosis was measured by flow cytometric determination using the CytoFLEX analyzer (Beckman Coulter, Brea, CA, USA) and a FITC Annexin V Apoptosis Detection Kit (BD Biosciences, Bedford, MA, USA) as per the manufacturer's recommendations. The positive control utilized 5 μg·mL−1 cycloheximide (Sigma). Colony formation assays were previously described (Yoshino et al., 2017b).
2.5. Lentivirus‐mediated gene expression
Lentivirus was used to achieve overexpression of PHGDH in cells, using a gift (pLJM5‐WT PHGDH) provided by D. Sabatini (Addgene plasmid #83901) (Pacold et al., 2016). We produced lentivirus as previously described (Yoshino et al., 2017b).
2.6. In vivo tumor xenograft model
A 100 µL suspension of 4 × 10⁶ BOY cells was combined with 100 µL Matrigel Matrix (Corning, Bedford, MA, USA). The mixture was used for subcutaneous injection into the sides of female nude mice (BALB/c nu/nu, 6‐ to 8‐week‐old). Mice were separated into four groups: vehicle, GC [gemcitabine 150 mg·kg−1, intraperitoneal (i.p.) injection, days 7 and 14, cisplatin 6 mg·kg−1, i.p., days 6 and 13], NCT‐503 (40 mg·kg−1, 5 times a week 1 day after tumor injection), or the combination of GC and NCT‐503. The weight of each mouse was used to normalize the dose and the injection volume was < 150 μL. The tumor fraction was used to conduct terminal deoxynucleotidyltransferase‐mediated dUTP‐biotin nick end labeling (TUNEL). All the animal experiments were approved by the animal care review board of Kagoshima University (approval no. MD17047).
2.7. TUNEL
Following xenografting, apoptotic cells in the tumor fraction were detected by the TUNEL method with a MEBSTAIN Apoptosis Kit Direct (code 8445 MBL, Woburn, MA, USA) per the directions of the manufacturer. Briefly, tumor fractions from mice were fixed with 4% paraformaldehyde, embedded in paraffin, and sectioned at 5‐μm intervals. Deparaffinized sections were incubated with 50 µL of terminal deoxynucleotidyl transferase (TdT) buffer II for 10 min at room temperature, followed by addition of 45 μL of TdT buffer II, 2.5 μL of FITC‐dUTP, and 2.5 μL of TdT. Incubation continued for 1 h at 37 °C in TB buffer for 15 min followed by four washes in PBS. Apoptotic cells were examined with a fluorescent microscope (Keyence, Osaka, Japan).
2.8. Analysis of a bladder cancer cohort with The Cancer Genome Atlas and the Gene Expression Omnibus
The Cancer Genome Atlas (TCGA) cohort database provided mRNA expression Z‐scores that had been generated by RNA sequencing. It included 412 patients with bladder urothelial carcinoma (BLCA or BC) for analysis of clinical relevance (2014; Cerami et al., 2012). Gene expression quantification used RSEM (Li and Dewey, 2011). Epigenomic, transcriptomic, and clinical information of TCGA BLCA and mRNA expression analyses from 967 cancer cell lines were acquired from TCGA (https://tcga‐data.nci.nih.gov/tcga/) and cBioPortal (http://www.cbioportal.org/public‐portal/) on June 1, 2018. For validation of the prognostic value of PHGDH mRNA expression, we employed PrognoScan (http://www.prognoscan.org/) (Mizuno et al., 2009), a database for meta‐analysis of the prognostic value of genes, using GSE13507 as an independent cohort of BC. Demographic characteristics for TCGA BLCA and GSE13507 cohorts categorized based on PHGDH expression level are shown in Tables S1 and S2, respectively. We analyzed the correlation between gene expression and DNA methylation in the first intron of PHGDH on chromosome 1, using data from the cg14476101 probe on Illumina (Illumina, Inc. San Diego, CA) Infinium HumanMethylation450K array in TCGA BLCA database. To study the correlation between PHGDH, PSAT1, PSPH, or SHMT1 mRNA expression and PHGDH copy number, TCGA BLCA database was also used. Web‐based enrichment pathway analysis by Enrichr (http://amp.pharm.mssm.edu/Enrichr/) (Kuleshov et al., 2016) was performed with the HumanCyc metabolic pathway term database (Romero et al., 2005).
2.9. Statistical analysis
The Mann–Whitney U‐test was performed to assess the statistical relationship between two groups. The Bonferroni‐adjusted Mann–Whitney U‐test was applied to examine the relationships among three variables and numerical values. To evaluate the correlation between two variables, we applied Spearman's rank test. BC patients' overall and disease‐free survivals (TCGA cohort) were assessed with the Kaplan–Meier method and log‐rank test. To establish independent factors for overall and disease‐free survival, we utilized a multivariate Cox proportional hazards model. The calculations were performed by expert stat view software, version 5.0 (Cary, NC, USA). For enrichment analysis, Enrichr computes the P‐values by Fisher's exact test, followed by the Benjamini–Hochberg procedure to correct for multiple hypotheses, and calculates the adjusted P‐values. More detailed information is described on Enrichr's website.
2.10. Ethics and standards for conducting of human and animal research
The experiments were undertaken with the understanding and written consent of each subject. The study methodologies conformed to the standards set by the Declaration of Helsinki. The study methodologies were approved by the ethics committee of Kagoshima University.
3. Results
3.1. PHGDH expression in BC: the clinical significance
We initially examined the significance of PHGDH expression in patients. We used statistical methods to analyze patients in TCGA database. With regard to BC samples and normal samples, there were no significant differences in PHGDH mRNA expression levels (P = 0.8911; Fig. 1A, left). However, the expression level of PHGDH was markedly elevated in high‐grade BC compared with low‐grade disease (P < 0.0001; Fig. 1A, right). In addition, patients with high expression of PHGDH mRNA defined as Z‐score > 0 had poorer overall survival and disease‐free survival in comparison with patients with low expression defined as Z‐score ≤ 0 (Log‐rank P = 0.0032 and 0.0218, respectively; Fig. 1B). Results were validated in an independent cohort of BC patients (GSE13507) (log‐rank P = 0.002307 for overall survival and 0.000262 for disease‐specific survival) (Fig. S1). In addition, the analysis with only high‐grade BC in TCGA cohort (Fig. 1A, right) indicated that patients with high expression of PHGDH mRNA also had poorer overall survival and disease‐free survival in comparison with patients with low expression (log‐rank P = 0.0081 and 0.0474, respectively; Fig. S2). In TCGA cohort, a Cox univariate analysis showed that PHGDH mRNA expression was associated with overall survival and disease‐free survival. In addition, we applied a multivariate Cox proportional hazards model to analyze the data. It showed that the level of PHGDH mRNA expression was an independent predictor of both overall and disease‐free survival (Table S3). This finding was validated in a GSE13507 cohort by multivariate Cox analysis that included age, grade, sex, stage, and PHGDH expression; the hazard ratio was 1.866 (1.122–3.104), P = 0.0163. We set a cutoff level to 50 years old based on a previous study (Feng et al., 2015). Since there have been reports that age and gender are associated with the prognosis for BC patients (Burge and Kockelbergh, 2016; Feng et al., 2015; Kucuk et al., 2015; Shariat et al., 2010), we took the clinical factors into consideration when performing multivariate analysis even if the results were not significant in the univariate analysis of this study cohort.
Fig. 1.

Clinical significance of PHGDH expression in BC according to TCGA data. (A) Left: the expression levels of PHGDH mRNA in normal human bladders and BCs. Right: the significant positive correlation between PHGDH expression and pathological grade (P < 0.0001). In BLCA, G1 was for ‘Low grade’ and G3 for ‘High grade’. The Mann–Whitney U‐test was performed to assess the statistical relationship, and error bars are represented as mean ± SD. (B) Overall survival (left) and disease‐free survival periods (right) were significantly shortened in patients with high PHGDH expression defined as Z‐score > 0 compared with those in patients with low PHGDH expression defined as Z‐score ≤ 0 (P = 0.0032 and P = 0.0218, respectively). The Kaplan–Meier method and log‐rank test were performed to assess the statistical relationship.
3.2. Effects of PHGDH inhibition in BC cells
Immunoblotting analyses revealed that PHGDH was markedly increased in BC cells compared with breast cancer cells (MCF7 and MDAMB231), which were used as negative control as shown in the previous study (Possemato et al., 2011). MCF7 is an ER+ PR+ HER2− cell line whereas MDAMB231 is a triple negative cell line (Fig. 2A). si‐PHGDH transfection of BC cells showed that proliferation was reduced relative to the si‐control (*P < 0.01; **P < 0.001; Fig. 2B).
Fig. 2.

PHGDH inhibition by si‐RNA and inhibitor. (A) Immunoblotting analysis showed that PHGDH expression was elevated in all BC cells compared to breast cancer cells. PHGDH expression values normalized by β‐actin were indicated. (B) Cell proliferation after treatment with PHGDH si‐RNA (*P < 0.01, **P < 0.001). The Bonferroni‐adjusted Mann–Whitney U‐test was performed to assess the statistical relationship, and error bars are represented as mean ± SD. (C) Apoptosis levels after treatment with PHGDH si‐RNA (*P < 0.02, **P < 0.001). The representative quadrant figures of apoptosis assay determined by flow cytometry are shown. Early apoptotic cells can be seen in the bottom right quadrant and late are in the upper right (lower). The Bonferroni‐adjusted Mann–Whitney U‐test was performed to assess the statistical relationship, and error bars are represented as mean ± SD. (D) Decreased Ki‐67 and increased cleaved caspase3 levels in si‐PHGDH‐transfected BC cells. PHGDH expression values normalized by β‐actin are indicated. Each experiment was carried out in triplicate.
In addition, there were apoptotic effects in BC cell lines (*P < 0.02; **P < 0.001; Fig. 2C).
Using western blots, we found that Ki‐67 was decreased and cleaved PARP levels were increased in BC cells transfected with si‐PHGDH compared with the si‐control (Fig. 2D). PHGDH inhibitors (CBR‐5884 and NCT‐503) had similar inhibitory effects on the proliferation of BC cells (*P < 0.01; **P < 0.001; Fig. 3A, Fig. S3). Moreover, CBR‐5884 enhanced the levels of apoptosis in BC cells (*P < 0.0001; Fig. 3B). The positive control utilized 5 μg·mL−1 cycloheximide.
Fig. 3.

PHGDH inhibition by a PHGDH inhibitor. (A) Cell proliferation after treatment with a PHGDH inhibitor (CBR‐5884) (*P < 0.01, **P < 0.001). The Bonferroni‐adjusted Mann–Whitney U‐test was performed to assess the statistical relationship, and error bars are represented as mean ± SD. (B) Apoptosis after treatment with CBR‐5884 (*P < 0.0001). The representative quadrant figures of apoptosis assay determined by flow cytometry are shown. Early apoptotic cells can be seen in the bottom right quadrant and late are in the upper right (right). Each experiment was carried out in triplicate. The Bonferroni‐adjusted Mann–Whitney U‐test was performed to assess the statistical relationship, and error bars are represented as mean ± SD.
3.3. PHGDH overexpression in cells under expressing PHGDH
Based on the result showing PHGDH expression in BC cells (Fig. 2A), we overexpressed PHGDH in UMUC in which PHGDH was downregulated compared to other BC cell lines (Fig. 4A). The cell proliferative ability (P = 0.0039; Fig. 4B) and number of colonies (P = 0.0209; Fig. 4C) were significantly increased in UMUC cells in which PHGDH was overexpressed compared to parental cells. For further analyses, we overexpressed PHGDH in MDAMB231 in which PHGDH expression was the lowest (Fig. 2A). The cell proliferative ability (P = 0.009; Fig. S4B) and number of colonies (P = 0.0209; Fig. S4C) were also significantly increased in PHGDH overexpressed MDAMB231 cells compared to the parental cells.
Fig. 4.

PHGDH overexpression in PHGDH‐downregulated cells. (A) Immunoblotting analysis showed that PHGDH expression was significantly elevated in UMUC cells (P = 0.0495). The Mann–Whitney U‐test was performed to assess the statistical relationship, and error bars are represented as mean ± SD. (B) Cell proliferation of parental and PHGDH‐overexpressing cells (P = 0.0039). The Mann–Whitney U‐test was performed to assess the statistical relationship, and error bars are represented as mean ± SD. (C) Representative image of colony formation by parental and PHGDH‐overexpressing UMUC cells (magnification, ×1). The graph showed the ratio of the number of colonies by parental and PHGDH‐overexpressing cell (P = 0.0209). Each experiment was carried out in triplicate. The Mann–Whitney U‐test was performed to assess the statistical relationship, and error bars are represented as mean ± SD.
3.4. Inhibition of PHGDH promoted the antitumor effects of gemcitabine and cisplatin
We examined the effects of combining treatments with a PHGDH inhibitor and gemcitabine plus cisplatin. Cell proliferation data showed synergistic effects of tumor suppression compared to that achieved with individual agents (*P < 0.01; **P < 0.001; Fig. 5A, Fig. S5). We next conducted xenograft assays using NCT‐503. We explored this approach because CBR‐5884 was not stable in mouse plasma. In contrast, NCT‐503 has been used with success in xenograft assays (Mullarky et al., 2016; Pacold et al., 2016). The data showed that tumor growth was markedly reduced in the mice receiving NCT‐503 compared with controls (*P < 0.01; Fig. 5B). Importantly, combined treatments using a PHGDH inhibitor and gemcitabine/cisplatin revealed synergistic inhibition of tumor growth compared to individual agents (Fig. 5B). Relationships among the treatment groups at each time point were analyzed using Bonferroni‐adjusted Mann–Whitney U‐tests for the adjustment for multiplicity. TUNEL assays and immunohistochemistry with Ki67 antibodies by using tumor fractions from mice also indicated increased proportions of apoptotic cells and reduced cell proliferation in the tumor from mice treated with NCT‐503 and GC compared to vehicle or single‐agent groups (Fig. 5C, Fig. S6).
Fig. 5.
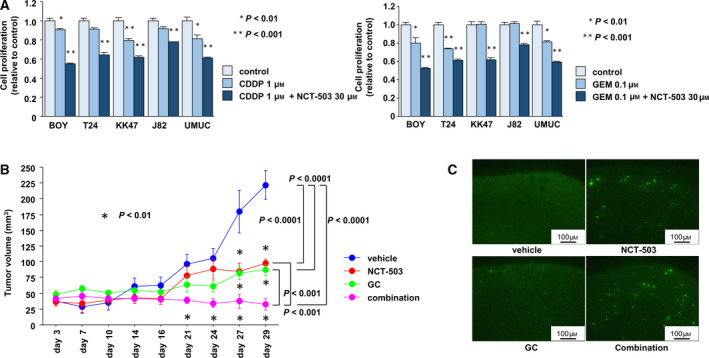
PHGDH inhibition promoted gemcitabine‐ and cisplatin‐induced antitumor effects. (A) Cell proliferation after cisplatin (CDDP) (left) or gemcitabine (GEM) (right) treatment in the absence or presence of a PHGDH inhibitor (NCT‐503) (*P < 0.01, **P < 0.001). The Bonferroni‐adjusted Mann–Whitney U‐test was performed to assess the statistical relationship, and error bars are represented as mean ± SD. (B) Time course of tumor volumes formed by subcutaneously injected BOY cells into nude mice. Four groups were examined: (a) vehicle, (b) GC (GEM 150 mg·kg−1, i.p., days 7 and 14. CDDP 6 mg·kg−1, i.p., days 6 and 13), (c) NCT‐503 (40 mg·kg−1, 5 times a week), or (d) a combination of GC and NCT‐503 (*P < 0.01) (n = 4 for vehicle or NCT‐503 group, n = 6 for GC or combination group). The Bonferroni‐adjusted Mann–Whitney U‐test was performed to assess the statistical relationship, and error bars are represented as mean ± SD. (C) Detection of apoptotic cells by TUNEL in tumor xenografts. Bright cells indicate apoptotic cells. Each experiment was carried out in triplicate.
3.5. Regulatory mechanisms associated with PHGDH in BC
Previous study showed that hypoxia coordinately induced PHGDH, PSAT1, and PSPH expression, which are located downstream from PHGDH (Samanta et al., 2016). Then, we used cBioPortal to analyze 562 differentially overexpressed genes in the PHGDH high group (mRNA Z‐score > 0) compared with the PHGDH low group (mRNA Z‐score ≤ 0) in TCGA BLCA cohort (Fig. 6A) to check whether genes on the serine and glycine biosynthesis pathway were accelerated in concert with PHGDH expression. The serine and glycine biosynthesis pathway was found prominently at the top of the list by Enrichr pathway analysis (Fig. 6B). Using TCGA BLCA database, we observed significant positive correlations between PHGDH and each of the genes (P < 0.0001; Fig. 6C). These correlations were supported by the results from cancer cell lines. Those data showed that expression of PSAT1, PSPH, or SHMT1 mRNAs was positively correlated with PHGDH mRNA expression (Fig. 6D,E). We also checked the regulatory mechanisms associated with PHGDH expression. According to TCGA BLCA database, the PHGDH DNA methylation site harboring cg14476101 and mRNA expression showed significant negative correlations (ρ = −0.664; P < 0.0001; Fig. 7A left, and B), and PHGDH DNA copy number and mRNA expression showed significantly positive correlations (ρ = 0.221; P < 0.0001; Fig. 7A right, B). In addition, PHGDH expression was decreased when BC cell lines were treated for 48 h with SAM, a biological methyl donor (P < 0.05; Fig. 7C). Finally, overall (left) and disease‐free survivals (right) were somewhat shorter in patients (Fig. 1B) with high PHGDH and reduced methylation relative to patients with high methylation of PHGDH (P = 0.0673 and P = 0.2438, respectively; Fig. 7D).
Fig. 6.
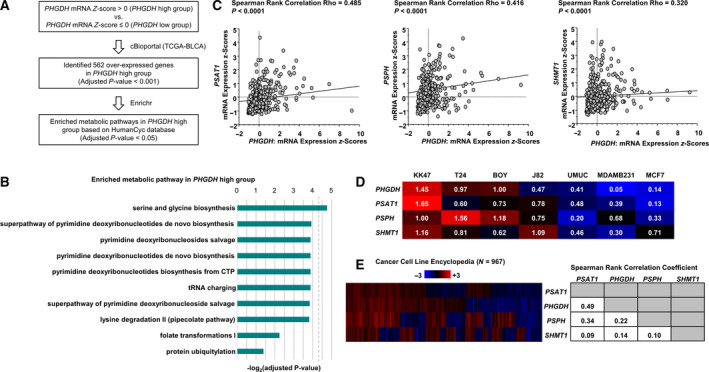
PHGDH expression was positively correlated with PSAT1, PSPH, and SHMT1 expression in cancer cells. (A) Flowchart of the strategy for identification of enriched metabolic pathways in the PHGDH high group. (B) Pathway analysis by Enrichr was performed using the HumanCyc Database. Fisher's exact test, followed by the Benjamini–Hochberg procedure was performed to assess the statistical relationship. (C) Spearman's rank test demonstrated that PHGDH and PSAT1, PSPH or SHMT1 mRNA expression levels were positively correlated (each P < 0.0001). (D) Expression of PSAT1, PSPH, or SHMT1 mRNA was positively correlated with PHGDH mRNAs expression in BC and breast cancer cell lines. Each value indicates the relative ratio compared to PHGDH mRNA expression in BOY cells. (E) Positive correlations between the expression of PHGDH and PSAT1, PSPH or SHMT1 mRNAs were observed in other cancer cell lines (left). Each value indicates the correlation coefficient of the heat map (right). Spearman's rank test was performed to assess the statistical relationship.
Fig. 7.

Relationship between PHGDH mRNA expression and DNA methylation or copy number. (A) Spearman's rank test indicated a negative correlation between PHGDH mRNA expression and DNA methylation (left), and a positive correlation between PHGDH mRNA expression and its copy number (right). (B) Correlation between PHGDH, PSAT1, PSPH or SHMT1 mRNA expression and PHGDH copy number, methylation, or mRNA expression. Spearman's rank test was performed to assess the statistical relationship. (C) PHGDH expression was decreased by SAM in BC cells. PHGDH expression values are normalized by β‐actin as indicated. Experiments were carried out in triplicate. The Bonferroni‐adjusted Mann–Whitney U‐test was performed to assess the statistical relationship, and error bars are represented as mean ± SD. (D) Overall survival (left) and disease‐free survival periods (right) were shortened in patients with low methylation of PHGDH compared with those in patients with high methylation (0.0673 and P = 0.2438, respectively). The Kaplan–Meier method and log‐rank test were performed to assess the statistical relationship.
4. Discussion
There have been reports that PHGDH inhibition or depletion leads to apoptosis in various cancers (Jing et al., 2015; Ou et al., 2015; Samanta et al., 2016). To the best of our knowledge, this analysis is the first to demonstrate its role in BC and its potential as a prognostic marker. In addition, we demonstrated that combination treatment using GC therapy and PHGDH inhibition had an additive apoptotic effect in vivo without weight loss and obvious side effects. Combination therapy with gemcitabine and/or cisplatin for BC has been reported by several researchers (Zeng et al., 2017). They showed that pictilisib, an inhibitor of PI3K, improved the antitumor effects of cisplatin and gemcitabine in human BC, both in vitro and in vivo. This was achieved by reducing the phosphorylation of ribosomal protein S6. Another combination was reported by Grivas et al. (2013). They found that dacomitinib, a tyrosine kinase inhibitor of EGFR, HER2 and HER4, could be combined with gemcitabine–cisplatin chemotherapy to improve the response achieved by gemcitabine–cisplatin alone. In terms of apoptosis enhancement, which was observed in this study, Smac mimetics (second mitochondria‐derived activator of caspases) and 1,25 dihydroxyvitamin D3 (1,25 D3), the most active vitamin D metabolite, showed synergistic effects against BCs in combination with GC treatment (Lee et al., 2013; Ma et al., 2010). The main mechanism of GC therapy is the induction of tumor cell apoptosis, and the inactivation of apoptotic pathways is a crucial and common mechanism for tumor cell resistance to GC (Bergman et al., 2002; Wang and Lippard, 2005). Thus, our finding that PHGDH silencing plus GC treatment had additive antitumor effects through induction of apoptosis was reasonable. Inhibition of PHGDH might be a candidate therapeutic option to be combined with GC treatment. GC therapy is well known to cause grades 3 and 4 toxicities as defined by the World Health Organization (von der Maase et al., 2000). We anticipate that the combination of GC therapy and PHGDH inhibition might reduce the current dose of GC therapy, thereby avoiding severe adverse events and toxic death. For that reason, we suggest that these inhibitors or next‐generation PHGDH inhibitors should be used in clinical trials in the near future.
Several reports have shown that DNA amplification of PHGDH underlies the high expression of PHGDH in various types of cancers (melanoma, breast cancer, and clear cell renal cell carcinoma) (Locasale et al., 2011; Possemato et al., 2011). However, this is the first report showing that PHGDH expression was regulated by methylation. Truong et al. studied blood samples of patients with venous thromboembolism. Their analysis showed that cg14476101, which is located in the first intron of PHGDH, is a methylation site. In monocytes, elevated methylation at that site was significantly associated with reduced PHGDH expression according to database eMS (Liu et al., 2013; Truong et al., 2017). In addition, Aslibekyan et al. (2015) reported that cg14476101 was located within a methylated region in noncancerous blood samples. Therefore, our finding that PHGDH hypomethylation was associated with poor prognosis based on characterization of cg14476101 is plausible. Moreover, we showed that introduction of a biological methyl donor into BC cells decreased PHGDH expression levels. Serine biosynthesis is the main pathway for the production of SAM, a substrate used in the methylation of lipids, proteins, RNA, DNA, and metabolites (Maddocks et al., 2016; Mentch et al., 2015). Moreover, PHGDH inhibition did not influence reactive oxygen species levels in BC (data not shown). Thus, we speculate that the acceleration of serine biosynthesis through increased PHGDH expression in BC might upregulate production of cell constituents (proteins, nucleic acids and lipids) that are necessary for cancer cell growth (Amelio et al., 2014). Moreover, we speculate that targeting PHGDH could suppress serine biosynthesis, leading to the inhibition of cancer cell viability through downregulation of vital cell constituents. Additional studies will be required to enhance our understanding of the underlying pathways of cancer metabolism.
5. Conclusions
Our investigation of BC revealed that the expression level of PHGDH was correlated with tumor grade and prognosis. We believe that this is the first report to show that PHGDH may be a prognostic marker predicting BC patient survival. In addition, PHGDH inhibitors significantly inhibited cancer cell growth, and synergistic effects with GC treatment were observed both in vitro and in vivo in BC. Furthermore, this is the first report indicating that PHGDH expression might be accelerated by hypomethylation in cancers. Taken together, our data may provide insights into the mechanisms underlying BC and suggest new therapeutic approaches and biomarkers.
Conflict of interest
The authors declare no conflict of interest. NN is an employee of MSD. KK is a subsidiary of Merck & Co., Inc. and reports personal fees from MSD K. K. outside this study.
Author contributions
HY conceived and designed the study. None of the authors involved in development of methodology. HY, YO, NN, MY, SS, KK, and MT acquired the data. HY, HE, and NN analyzed and involved in interpretation of data. HY, HE, and NN wrote, reviewed and/or revised the manuscript. None of the authors involved in administrative, technical, or material support. HE, ST, and MN supervised the study.
Supporting information
Fig. S1. Clinical significance of PHGDH expression in BC with GSE13507 cohort. Overall survival (left) and disease‐free survival periods (right) were significantly shortened in patients with high PHGDH expression compared with those in patients with low PHGDH expression (P = 0.002307 and P = 0.000262, respectively). The Kaplan–Meier method and log‐rank test were performed to assess the statistical relationship.
Fig. S2. Clinical significance of PHGDH expression in BC with high grade in TCGA data. Overall survival (left) and disease‐free survival periods (right) were significantly shortened in patients with high PHGDH expression compared with those in patients with low PHGDH expression (P = 0.0081 and P = 0.0474, respectively). The Kaplan–Meier method and log‐rank test were performed to assess the statistical relationship.
Fig. S3. PHGDH inhibition by PHGDH inhibitor (NCT‐503). Cell proliferation assay after treatment with a PHGDH inhibitor (NCT‐503). (*, P < 0.01; * *, P < 0.001). Bonferroni‐adjusted Mann–Whitney U‐test was performed to assess the statistical relationship, and error bars are represented as mean ± SD (n = 3).
Fig. S4. PHGDH overexpression in PHGDH‐downregulated cells. (A) Immunoblotting analysis showed that PHGDH expression was dramatically elevated in MDAMB231 cells. Error bars are represented as mean ± SD (n = 3). (B) Cell proliferation of parental and PHGDH‐overexpressing cells (P = 0.009). Error bars are represented as mean ± SD (n = 5). (C) Representative image of colony formation by parental and PHGDH‐overexpressing MDAMB231 cells (magnification, x 1). The graph showed the ratio of the number of colonies by parental and PHGDH‐overexpressing cells (P = 0.0209). Error bars are represented as mean ± SD (n = 4). The Mann–Whitney U‐test was performed to assess the statistical relationship on each experiment.
Fig. S5. PHGDH inhibition promoted a gemcitabine‐ and cisplatin‐induced antitumor effect. Cell proliferation after treatment with cisplatin (left) or gemcitabine (right) in the absence or presence of a PHGDH inhibitor (CBR‐503). Bonferroni‐adjusted Mann–Whitney U‐test was performed to assess the statistical relationship, and error bars are represented as mean ± SD (n = 3).
Fig. S6. Ki67‐positive cells were decreased by PHGDH inhibition and gemcitabine/cisplatin compared to vehicle or single‐agent groups. Ki67‐positive cells were calculated from independent tumor sections per group and expressed as the mean ± SD (*, P < 0.05) (n = 4 for vehicle or GC group, n = 3 for NCT‐503 or combination group). (magnification, x 400). Bonferroni‐adjusted Mann–Whitney U‐test was performed to assess the statistical relationship.
Table S1. Clinical and demographic characteristics of TCGA Bladder urothelial carcinoma (BLCA) samples categorized based on PHGDH expression level.
Table S2. Clinical and demographic characteristics of GSE13507 bladder cancer cohort categorized based on PHGDH expression level.
Table S3. Univariate and multivariate analysis in BLCA cohort database.
Acknowledgements
We thank Keiko Yoshitomi for excellent laboratory assistance. This study was supported by the KAKENHI (KIBAN‐B) 16H05464 and 17H04332, KAKENHI (KIBAN‐C) 16K11015, KAKENHI (WAKATE‐B) 17K16799 and 20K18146, The Shinnihon Foundation of Advanced Medical Treatment Research, Takeda Science Foundation, and Foundation for Promotion of Cancer Research in Japan.
References
- Abdollah F, Gandaglia G, Thuret R, Schmitges J, Tian Z, Jeldres C, Passoni NM, Briganti A, Shariat SF, Perrotte P et al (2013) Incidence, survival and mortality rates of stage‐specific bladder cancer in United States: a trend analysis. Cancer Epidemiol 37, 219–225. [DOI] [PubMed] [Google Scholar]
- Amelio I, Cutruzzola F, Antonov A, Agostini M and Melino G (2014) Serine and glycine metabolism in cancer. Trends Biochem Sci 39, 191–198. [DOI] [PMC free article] [PubMed] [Google Scholar]
- Antoni S, Ferlay J, Soerjomataram I, Znaor A, Jemal A and Bray F (2017) Bladder cancer incidence and mortality: a global overview and recent trends. Eur Urol 71, 96–108. [DOI] [PubMed] [Google Scholar]
- Aslibekyan S, Demerath EW, Mendelson M, Zhi D, Guan W, Liang L, Sha J, Pankow JS, Liu C, Irvin MR et al (2015) Epigenome‐wide study identifies novel methylation loci associated with body mass index and waist circumference. Obesity (Silver Spring) 23, 1493–1501. [DOI] [PMC free article] [PubMed] [Google Scholar]
- Bellmunt J, de Wit R, Vaughn DJ, Fradet Y, Lee JL, Fong L, Vogelzang NJ, Climent MA, Petrylak DP, Choueiri TK et al (2017) Pembrolizumab as second‐line therapy for advanced urothelial carcinoma. N Engl J Med 376, 1015–1026. [DOI] [PMC free article] [PubMed] [Google Scholar]
- Bergman AM, Pinedo HM and Peters GJ (2002) Determinants of resistance to 2',2'‐difluorodeoxycytidine (gemcitabine). Drug Resist Updat 5, 19–33. [DOI] [PubMed] [Google Scholar]
- Burge F and Kockelbergh R (2016) Closing the gender gap: can we improve bladder cancer survival in women? – a systematic review of diagnosis, treatment and outcomes. Urol Int 97, 373–379. [DOI] [PubMed] [Google Scholar]
- Cancer Genome Atlas Research Network (2014) Comprehensive molecular characterization of urothelial bladder carcinoma. Nature 507, 315–322. [DOI] [PMC free article] [PubMed] [Google Scholar]
- Cerami E, Gao J, Dogrusoz U, Gross BE, Sumer SO, Aksoy BA, Jacobsen A, Byrne CJ, Heuer ML, Larsson E et al (2012) The cBio cancer genomics portal: an open platform for exploring multidimensional cancer genomics data. Cancer Discov 2, 401–404. [DOI] [PMC free article] [PubMed] [Google Scholar]
- Feng H, Zhang W, Li J and Lu X (2015) Different patterns in the prognostic value of age for bladder cancer‐specific survival depending on tumor stages. Am J Cancer Res 5, 2090–2097. [PMC free article] [PubMed] [Google Scholar]
- Grivas PD, Day KC, Karatsinides A, Paul A, Shakir N, Owainati I, Liebert M, Kunju LP, Thomas D, Hussain M et al (2013) Evaluation of the antitumor activity of dacomitinib in models of human bladder cancer. Mol Med 19, 367–376. [DOI] [PMC free article] [PubMed] [Google Scholar]
- Jing Z, Heng W, Xia L, Ning W, Yafei Q, Yao Z and Shulan Z (2015) Downregulation of phosphoglycerate dehydrogenase inhibits proliferation and enhances cisplatin sensitivity in cervical adenocarcinoma cells by regulating Bcl‐2 and caspase‐3. Cancer Biol Ther 16, 541–548. [DOI] [PMC free article] [PubMed] [Google Scholar]
- Kaufman DS, Shipley WU and Feldman AS (2009) Bladder cancer. Lancet 374, 239–249. [DOI] [PubMed] [Google Scholar]
- Kucuk U, Pala EE, Cakir E, Sezer O, Bayol U, Divrik RT and Cakmak O (2015) Clinical, demographic and histopathological prognostic factors for urothelial carcinoma of the bladder. Cent European J Urol 68, 30–36. [DOI] [PMC free article] [PubMed] [Google Scholar]
- Kuleshov MV, Jones MR, Rouillard AD, Fernandez NF, Duan Q, Wang Z, Koplev S, Jenkins SL, Jagodnik KM, Lachmann A et al (2016) Enrichr: a comprehensive gene set enrichment analysis web server 2016 update. Nucleic Acids Res 44, W90–W97. [DOI] [PMC free article] [PubMed] [Google Scholar]
- Lee EK, Jinesh GG, Laing NM, Choi W, McConkey DJ and Kamat AM (2013) A Smac mimetic augments the response of urothelial cancer cells to gemcitabine and cisplatin. Cancer Biol Ther 14, 812–822. [DOI] [PMC free article] [PubMed] [Google Scholar]
- Li B and Dewey CN (2011) RSEM: accurate transcript quantification from RNA‐Seq data with or without a reference genome. BMC Bioinformatics 12, 323. [DOI] [PMC free article] [PubMed] [Google Scholar]
- Liu Y, Ding J, Reynolds LM, Lohman K, Register TC, De La Fuente A, Howard TD, Hawkins GA, Cui W, Morris J et al (2013) Methylomics of gene expression in human monocytes. Hum Mol Genet 22, 5065–5074. [DOI] [PMC free article] [PubMed] [Google Scholar]
- Locasale JW, Grassian AR, Melman T, Lyssiotis CA, Mattaini KR, Bass AJ, Heffron G, Metallo CM, Muranen T, Sharfi H et al (2011) Phosphoglycerate dehydrogenase diverts glycolytic flux and contributes to oncogenesis. Nat Genet 43, 869–874. [DOI] [PMC free article] [PubMed] [Google Scholar]
- Ma Y, Yu WD, Trump DL and Johnson CS (2010) 1,25D3 enhances antitumor activity of gemcitabine and cisplatin in human bladder cancer models. Cancer 116, 3294–3303. [DOI] [PMC free article] [PubMed] [Google Scholar]
- Maddocks OD, Labuschagne CF, Adams PD and Vousden KH (2016) Serine metabolism supports the methionine cycle and DNA/RNA methylation through de novo ATP synthesis in cancer cells. Mol Cell 61, 210–221. [DOI] [PMC free article] [PubMed] [Google Scholar]
- Mentch SJ, Mehrmohamadi M, Huang L, Liu X, Gupta D, Mattocks D, Gomez Padilla P, Ables G, Bamman MM, Thalacker‐Mercer AE et al (2015) Histone methylation dynamics and gene regulation occur through the sensing of one‐carbon metabolism. Cell Metab 22, 861–873. [DOI] [PMC free article] [PubMed] [Google Scholar]
- Miller KD, Siegel RL, Lin CC, Mariotto AB, Kramer JL, Rowland JH, Stein KD, Alteri R and Jemal A (2016) Cancer treatment and survivorship statistics, 2016. CA Cancer J Clin 66, 271–289. [DOI] [PubMed] [Google Scholar]
- Mizuno H, Kitada K, Nakai K and Sarai A (2009) PrognoScan: a new database for meta‐analysis of the prognostic value of genes. BMC Med Genomics 2, 18. [DOI] [PMC free article] [PubMed] [Google Scholar]
- Mullarky E, Lucki NC, Beheshti Zavareh R, Anglin JL, Gomes AP, Nicolay BN, Wong JC, Christen S, Takahashi H, Singh PK et al (2016) Identification of a small molecule inhibitor of 3‐phosphoglycerate dehydrogenase to target serine biosynthesis in cancers. Proc Natl Acad Sci USA 113, 1778–1783. [DOI] [PMC free article] [PubMed] [Google Scholar]
- Ou Y, Wang SJ, Jiang L, Zheng B and Gu W (2015) p53 Protein‐mediated regulation of phosphoglycerate dehydrogenase (PHGDH) is crucial for the apoptotic response upon serine starvation. J Biol Chem 290, 457–466. [DOI] [PMC free article] [PubMed] [Google Scholar]
- Pacold ME, Brimacombe KR, Chan SH, Rohde JM, Lewis CA, Swier LJ, Possemato R, Chen WW, Sullivan LB, Fiske BP et al (2016) A PHGDH inhibitor reveals coordination of serine synthesis and one‐carbon unit fate. Nat Chem Biol 12, 452–458. [DOI] [PMC free article] [PubMed] [Google Scholar]
- Possemato R, Marks KM, Shaul YD, Pacold ME, Kim D, Birsoy K, Sethumadhavan S, Woo HK, Jang HG, Jha AK et al (2011) Functional genomics reveal that the serine synthesis pathway is essential in breast cancer. Nature 476, 346–350. [DOI] [PMC free article] [PubMed] [Google Scholar]
- Romero P, Wagg J, Green ML, Kaiser D, Krummenacker M and Karp PD (2005) Computational prediction of human metabolic pathways from the complete human genome. Genome Biol 6, R2. [DOI] [PMC free article] [PubMed] [Google Scholar]
- Samanta D, Park Y, Andrabi SA, Shelton LM, Gilkes DM and Semenza GL (2016) PHGDH expression is required for mitochondrial redox homeostasis, breast cancer stem cell maintenance, and lung metastasis. Can Res 76, 4430–4442. [DOI] [PubMed] [Google Scholar]
- Shariat SF, Sfakianos JP, Droller MJ, Karakiewicz PI, Meryn S and Bochner BH (2010) The effect of age and gender on bladder cancer: a critical review of the literature. BJU Int 105, 300–308. [DOI] [PMC free article] [PubMed] [Google Scholar]
- Siegel RL, Miller KD and Jemal A (2018) Cancer statistics, 2018. CA Cancer J Clin 68, 7–30. [DOI] [PubMed] [Google Scholar]
- Sternberg CN, Bellmunt J, Sonpavde G, Siefker‐Radtke AO, Stadler WM, Bajorin DF, Dreicer R, George DJ, Milowsky MI, Theodorescu D et al (2013) ICUD‐EAU International Consultation on Bladder Cancer 2012: chemotherapy for urothelial carcinoma‐neoadjuvant and adjuvant settings. Eur Urol 63, 58–66. [DOI] [PubMed] [Google Scholar]
- Truong V, Huang S, Dennis J, Lemire M, Zwingerman N, Aissi D, Kassam I, Perret C, Wells P, Morange PE et al (2017) Blood triglyceride levels are associated with DNA methylation at the serine metabolism gene PHGDH. Sci Rep 7, 11207. [DOI] [PMC free article] [PubMed] [Google Scholar]
- von der Maase H, Hansen SW, Roberts JT, Dogliotti L, Oliver T, Moore MJ, Bodrogi I, Albers P, Knuth A, Lippert CM et al (2000) Gemcitabine and cisplatin versus methotrexate, vinblastine, doxorubicin, and cisplatin in advanced or metastatic bladder cancer: results of a large, randomized, multinational, multicenter, phase III study. J Clin Oncol 18, 3068–3077. [DOI] [PubMed] [Google Scholar]
- Wang D and Lippard SJ (2005) Cellular processing of platinum anticancer drugs. Nat Rev Drug Discovery 4, 307–320. [DOI] [PubMed] [Google Scholar]
- Yoshino H, Chiyomaru T, Enokida H, Kawakami K, Tatarano S, Nishiyama K, Nohata N, Seki N and Nakagawa M (2011) The tumour‐suppressive function of miR‐1 and miR‐133a targeting TAGLN2 in bladder cancer. Br J Cancer 104, 808–818. [DOI] [PMC free article] [PubMed] [Google Scholar]
- Yoshino H, Nohata N, Miyamoto K, Yonemori M, Sakaguchi T, Sugita S, Itesako T, Kofuji S, Nakagawa M, Dahiya R et al (2017a) PHGDH as a key enzyme for serine biosynthesis in HIF2alpha‐targeting therapy for renal cell carcinoma. Can Res 77, 6321–6329. [DOI] [PMC free article] [PubMed] [Google Scholar]
- Yoshino H, Yonemori M, Miyamoto K, Tatarano S, Kofuji S, Nohata N, Nakagawa M and Enokida H (2017b) microRNA‐210‐3p depletion by CRISPR/Cas9 promoted tumorigenesis through revival of TWIST1 in renal cell carcinoma. Oncotarget 8, 20881–20894. [DOI] [PMC free article] [PubMed] [Google Scholar]
- Zeng SX, Zhu Y, Ma AH, Yu W, Zhang H, Lin TY, Shi W, Tepper CG, Henderson PT, Airhart S et al (2017) The phosphatidylinositol 3‐kinase pathway as a potential therapeutic target in bladder cancer. Clin Cancer Res 23, 6580–6591. [DOI] [PMC free article] [PubMed] [Google Scholar]
Associated Data
This section collects any data citations, data availability statements, or supplementary materials included in this article.
Supplementary Materials
Fig. S1. Clinical significance of PHGDH expression in BC with GSE13507 cohort. Overall survival (left) and disease‐free survival periods (right) were significantly shortened in patients with high PHGDH expression compared with those in patients with low PHGDH expression (P = 0.002307 and P = 0.000262, respectively). The Kaplan–Meier method and log‐rank test were performed to assess the statistical relationship.
Fig. S2. Clinical significance of PHGDH expression in BC with high grade in TCGA data. Overall survival (left) and disease‐free survival periods (right) were significantly shortened in patients with high PHGDH expression compared with those in patients with low PHGDH expression (P = 0.0081 and P = 0.0474, respectively). The Kaplan–Meier method and log‐rank test were performed to assess the statistical relationship.
Fig. S3. PHGDH inhibition by PHGDH inhibitor (NCT‐503). Cell proliferation assay after treatment with a PHGDH inhibitor (NCT‐503). (*, P < 0.01; * *, P < 0.001). Bonferroni‐adjusted Mann–Whitney U‐test was performed to assess the statistical relationship, and error bars are represented as mean ± SD (n = 3).
Fig. S4. PHGDH overexpression in PHGDH‐downregulated cells. (A) Immunoblotting analysis showed that PHGDH expression was dramatically elevated in MDAMB231 cells. Error bars are represented as mean ± SD (n = 3). (B) Cell proliferation of parental and PHGDH‐overexpressing cells (P = 0.009). Error bars are represented as mean ± SD (n = 5). (C) Representative image of colony formation by parental and PHGDH‐overexpressing MDAMB231 cells (magnification, x 1). The graph showed the ratio of the number of colonies by parental and PHGDH‐overexpressing cells (P = 0.0209). Error bars are represented as mean ± SD (n = 4). The Mann–Whitney U‐test was performed to assess the statistical relationship on each experiment.
Fig. S5. PHGDH inhibition promoted a gemcitabine‐ and cisplatin‐induced antitumor effect. Cell proliferation after treatment with cisplatin (left) or gemcitabine (right) in the absence or presence of a PHGDH inhibitor (CBR‐503). Bonferroni‐adjusted Mann–Whitney U‐test was performed to assess the statistical relationship, and error bars are represented as mean ± SD (n = 3).
Fig. S6. Ki67‐positive cells were decreased by PHGDH inhibition and gemcitabine/cisplatin compared to vehicle or single‐agent groups. Ki67‐positive cells were calculated from independent tumor sections per group and expressed as the mean ± SD (*, P < 0.05) (n = 4 for vehicle or GC group, n = 3 for NCT‐503 or combination group). (magnification, x 400). Bonferroni‐adjusted Mann–Whitney U‐test was performed to assess the statistical relationship.
Table S1. Clinical and demographic characteristics of TCGA Bladder urothelial carcinoma (BLCA) samples categorized based on PHGDH expression level.
Table S2. Clinical and demographic characteristics of GSE13507 bladder cancer cohort categorized based on PHGDH expression level.
Table S3. Univariate and multivariate analysis in BLCA cohort database.