Abstract
Transcriptomic data derived from bulk sequencing have been applied to delineate the tumor microenvironment (TME) and define immune subtypes in various cancers, which may facilitate the design of immunotherapy treatment strategies. We herein gathered published gene expression data from diffuse lower‐grade glioma (LGG) patients to identify immune subtypes. Based on the immune gene profiles of 402 LGG patients from The Cancer Genome Atlas, we performed consensus clustering to determine robust clusters of patients, and evaluated their reproducibility in three Chinese Glioma Genome Atlas cohorts. We further integrated immunogenomics methods to characterize the immune environment of each subtype. Our analysis identified and validated three immune subtypes—Im1, Im2, and Im3—characterized by differences in lymphocyte signatures, somatic DNA alterations, and clinical outcomes. Im1 had a higher infiltration of CD8+ T cells, Th17, and mast cells. Im2 was defined by elevated cytolytic activity, exhausted CD8+ T cells, macrophages, higher levels of aneuploidy, and tumor mutation burden, and these patients had worst outcome. Im3 displayed more prominent T helper cell and APC coinhibition signatures, with elevated pDCs and macrophages. Each subtype was associated with distinct somatic alterations. Moreover, we applied graph structure learning‐based dimensionality reduction to the immune landscape and revealed significant intracluster heterogeneity with Im2 subtype. Finally, we developed and validated an immune signature with better performance of prognosis prediction. Our results demonstrated the immunological heterogeneity within diffuse LGG and provided valuable stratification for the design of future immunotherapy.
Keywords: diffuse lower‐grade glioma, immune classification, prognosis, tumor microenvironment
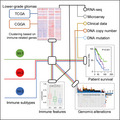
We classified diffuse lower‐grade gliomas (LGGs) into three distinct subtypes based on consensus clustering of immune‐related gene expression profiles. Each of the three immune subtypes was associated with distinct molecular and cellular features, and clinical outcomes. The identification of immune‐related subtypes may facilitate the optimal selection of LGG patients responsive to immunotherapy.
Abbreviations
- AUC
area under the curve
- CGGA
Chinese Glioma Genome Atlas
- CI
confidence interval
- CNA
copy‐number alteration
- GBM
glioblastoma multiforme
- GSEA
gene set enrichment analysis
- LGG
lower‐grade glioma
- OS
overall survival
- PCA
Principal component analysis
- TCGA
The Cancer Genome Atlas
1. Introduction
Diffuse lower‐grade gliomas (LGGs) consisting of World Health Organization (WHO) grade II and III gliomas are infiltrative brain tumors that arise from glial or precursor cells, showing a more indolent course compared with glioblastoma (GBM, grade IV) (Jiang et al., 2016; Lapointe et al., 2018). The survival of this tumor ranges widely (from 1 to 15 years) and varies considerably when stratified by tumor type. Based on the IDH mutation and 1p/19q codeletion status, LGGs are classified into three diagnostic and prognostic subtypes in the 2016 WHO classification: IDH wild‐type (holding the worst outcome), IDH mutant and 1p/19q intact, and IDH mutant and 1p/19q codeleted tumors (oligodendrogliomas) (Louis et al., 2016). Despite multimodal treatment, including neurosurgical resection, radiotherapy, and chemotherapy, tumor recurrence and malignant progression are inevitable because of their highly invasive nature and treatment resistance (Cancer Genome Atlas Research et al., 2015).
Recently, different immunotherapeutic approaches have proved to be successful in treating many malignant cancers (Del Paggio, 2018). These include immune checkpoint blockade, cytokine therapy, cellular therapy, and therapeutic vaccines (Christofi et al., 2019). Immune checkpoint inhibitors such as cytotoxic T lymphocyte antigen‐4 (CTLA‐4), programmed cell death protein 1 (PD‐1), and PD‐1 ligand (PD‐L1) antibodies have shown significant antitumor activity in several human cancers (Le et al., 2015a; Reck et al., 2016; Wolchok et al., 2013) . Two cytokines (IL‐2 and IFN‐a) are approved by FDA as antitumor agents against metastatic melanoma and kidney cancer (Mirjacic Martinovic et al., 2017). Chimeric antigen receptor (CAR)‐engineered T‐cell therapy redirects T‐cell killing to cells that express the antibody’s cognate tumor‐associated surface antigen, and has yielded encouraging results in hematologic cancers (Grupp et al., 2013; Kalos et al., 2011). Preventative and therapeutic vaccines are also effective in several cancers, such as human papillomavirus (Mammas et al., 2011), hepatitis B virus vaccines (Chemin, 2010), Sipuleucel‐T, and GVAX vaccine against prostate cancer (Kantoff et al., 2010; Le et al., 2015b). However, there is disparity in response rates across and within tumor types, and not all patients benefit from immunotherapy (Christofi et al., 2019).
More than four decades of efforts with variety of immunotherapeutic modalities yield limited successes in glioma. Glioma imbues numerous obstacles to successful immunotherapy, including tumor heterogeneity, low mutational burden, T‐cell dysfunction, and poor immune access (Fecci and Sampson, 2019). Moreover, new finding reveals that tumor‐directed sequestration of T cells in bone marrow severely restricts the access of T cells to tumors in the CNS (Chongsathidkiet et al., 2018). Despite successes with checkpoint blockade in many cancers, CTLA‐4 and PD‐1 inhibitors have failed in clinical trials of glioma (Schalper et al., 2019). CAR T cells targeting EGFRvIII, IL12Ra and HER2 are proved to be safe in preclinical studies of GBM, and the clinical antitumor capabilities remain to be seen (Ahmed et al., 2017; Brown et al., 2015; Johnson et al., 2015). Despite excellent preclinical efficacy, EGFRvIII‐targeted peptide vaccine (Rindopepimut) exhibits no significant improvement in median overall survival (OS) of GBM patients in phase III clinical trial (Weller et al., 2017).
For successful immunotherapeutic approaches, it will require better understanding of glioma‐specific immune microenvironment. A growing number of studies have demonstrated that the TME remains highly divergent in different subtypes of glioma. The TME of GBM has been delineated by the proportion and gene expression signatures of immune cells, but the clinical implications of these immune cells are still disputed (Berghoff et al., 2015; Lohr et al., 2011). Michael and Luoto found that transcriptional and mutational subtypes were characterized by distinct TME in high‐grade gliomas and GBM, respectively (Bockmayr et al., 2019; Luoto et al., 2018). Reduced immune infiltrates were observed in IDH mutant glioma (Amankulor et al., 2017), while Wang found increased macrophage infiltration in NF1 mutant tumors (Wang et al., 2017). However, the immune microenvironment of diffuse LGG has not been fully characterized.
In this study, we classified diffuse LGG into three distinct subtypes based on consensus clustering of immune‐related gene expression profiles. We demonstrated the stability and reproducibility of this classification in an independent cohort. Each of the three immune subtypes was associated with distinct molecular and cellular features, and clinical outcomes. The identification of immune‐related subtypes may facilitate the optimal selection of LGG patients responsive to immunotherapy.
2. Materials and methods
2.1. Patients and datasets
This study collected 1018 diffuse LGGs from two databases: The Cancer Genome Atlas (TCGA) and Chinese Glioma Genome Atlas (CGGA). For the TCGA discovery cohort (402 LGG patients; Table 1), the RNA‐seq data, somatic mutation, copy‐number alterations (CNAs), and corresponding clinical information were obtained from TCGA database (http://cancergenome.nih.gov/) (Ceccarelli et al., 2016). The molecular and immune‐related features, including neoantigens, immune cell composition, TCR/BCR status, and other signatures, were also retrieved (Thorsson et al., 2018). Three CGGA validation cohorts were involved in this study: two RNA‐seq cohorts (cohort1 and cohort2) and a microarray cohort (cohort3) (Table 1). The RNA‐seq and microarray data, and clinical and survival information were downloaded from CGGA database (http://www.cgga.org.cn) (Hu et al., 2018; Zhao et al., 2017). Patient informed consent was existing in these two public datasets, and this study was carried out in accordance with the Helsinki Declaration and approved by the ethics committee of Tiantan Hospital.
Table 1.
Clinical and molecular characteristics of patients included in this study.
| Characteristic | TCGA cohort (n = 402) | CGGA cohort1 (n = 171) | CGGA cohort2 (n = 274) | CGGA cohort3 (n = 171) |
|---|---|---|---|---|
| Age | ||||
| ≤ 41 | 206 | 99 | 154 | 100 |
| > 41 | 196 | 72 | 120 | 71 |
| Gender | ||||
| Male | 223 | 104 | 121 | 99 |
| Female | 179 | 67 | 153 | 72 |
| TCGA subtype | ||||
| Classical | 29 | 22 | 29 | 7 |
| Mesenchymal | 23 | 15 | 35 | 31 |
| Proneural | 85 | 65 | 116 | 65 |
| Neural | 181 | 69 | 93 | 68 |
| NA | 84 | 0 | 1 | 0 |
| Grade | ||||
| II | 191 | 104 | 133 | 120 |
| III | 211 | 67 | 141 | 51 |
| IDH | ||||
| Mutant | 329 | 126 | 178 | 110 |
| WT | 73 | 45 | 66 | 57 |
| NA | 0 | 0 | 30 | 4 |
| MGMT promoter | ||||
| Methylated | 332 | 76 | Unavailable | Unavailable |
| Unmethylated | 70 | 43 | Unavailable | Unavailable |
| NA | 0 | 52 | Unavailable | Unavailable |
| TERT promoter | ||||
| Mutant | 115 | 50 | Unavailable | Unavailable |
| WT | 140 | 90 | Unavailable | Unavailable |
| NA | 147 | 31 | Unavailable | Unavailable |
| 1p/19q | ||||
| Codeleted | 137 | 34 | 82 | 41 |
| Non‐codeleted | 265 | 110 | 160 | 130 |
| NA | 0 | 27 | 32 | 0 |
2.2. Identification and validation of immune subtypes
Based on the expression of 782 immune‐related genes listed in the literature (Charoentong et al., 2017; Gentles et al., 2015), we applied consensus clustering to identify robust clusters of TCGA patients (Wilkerson and Hayes, 2010; Wu et al., 2019a). 80% item resampling, 50 resamplings and a maximum evaluated K of 10 were selected for clustering. The cumulative distribution function and consensus heatmap were used to assess the optimal K.
To validate the immune subtypes in CGGA cohort, we first identified the immune‐related genes shared by the training and validation cohorts (751 genes). Then, we trained a partition around medoids (PAM) classifier in the discovery cohort to predict the immune subtype for patients in the validation cohort (package pamr), and each sample in the validation cohort was assigned to an immune subtype whose centroid had the highest Pearson correlation with the sample (Tibshirani et al., 2002). Finally, the in‐group proportion (IGP) statistic (package clusterRepro) was performed to evaluate the similarity and reproducibility of the acquired immune subtypes between discovery and validation cohorts (Kapp and Tibshirani, 2007).
2.3. Computation of molecular signatures and immune cellular fraction
ESTIMATE was performed to evaluate the immune cell infiltration level (immune score) and stromal content (stromal score) for each sample (Yoshihara et al., 2013). The enrichment levels of proliferation and 23 immune signatures were quantified by the single‐sample gene set enrichment analysis (ssGSEA), as implemented in the GSVA R package (Hanzelmann et al., 2013; He et al., 2018). The relative fraction of 22 immune cell types in tumor tissue was estimated using CIBERSORT algorithm (Newman et al., 2015).
2.4. Immune landscape analysis
To further uncover the intrinsic structure and distribution of individual patients, we extended a graph learning‐based dimensionality reduction analysis to the immune gene expression profiles. The discriminative dimensionality reduction with trees (DDRTree) was used, and the immune landscape was visualized with the plot cell trajectory function (package monocle) (Li et al., 2019; Trapnell et al., 2014).
2.5. Identification of an immune‐related signature
First, we applied significance analysis of microarray (SAM) to identify differentially expressed immune genes between subtypes. Univariate Cox regression analysis was performed to determine the immune genes with prognostic significance. Then, the Cox proportional hazards model, which was suitable for high‐dimensional regression analysis, was used to construct an optimal and prognostic gene set (package glmnet) (Hughey and Butte, 2015; Wu et al., 2019b). The linear combination of gene expression weighted by regression coefficients (Coeffs) was used to calculate the risk scores of patients.
2.6. Statistical analysis
The Kaplan–Meier with log‐rank test was used to assess survival difference between groups. The univariate and multivariate Cox regression analyses were performed to detect the prognostic factors. All statistical analyses were conducted using r software, graphpad prism 6.0 (GraphPad Inc, San Diego, CA, USA) and spss 16.0 (ibm, chicago, il, usa). P < 0.05 was considered statistically significant.
3. Results
3.1. Immune subtypes in diffuse lower‐grade glioma
By applying consensus clustering on the gene expression profile of annotated immune‐related genes (Charoentong et al., 2017; Gentles et al., 2015) on TCGA 402 LGGs, three resulting clusters ‘immune subtypes’, Im1‐Im3, were defined (Fig. S1). We then calculated the centroid of each immune subtype and identified six gene modules (GM) (Fig. 1A). Gene ontology analysis revealed that the functions of GMs 3 and 5 enriched in Im2 correspond to cell division and immune response, respectively (Fig. S2). Principal component analysis (PCA) further confirmed robust differences in the expression portraits between the three immune subtypes (Fig. 2A). Of note, Im2 was associated with the worst outcomes among these subtypes, and contained majority of patients with classical and mesenchymal subtype. Tumors with grade III, IDH wild‐type, and 1p/19q non‐codeletion (62/73, 85%) were enriched in this subtype. By contrast, Im1 and Im3 had better prognosis were mainly neural and proneural subtype. Im1 was enriched in particular tumors with IDH mutation and 1p/19q codeletion (130/137, 95%), whereas Im3 had more tumors with IDH mutation and 1p/19q non‐codeletion (103/192, 54%) (Fig. 2B,C). When it comes to the DNA methylation subtypes across pan‐glioma dataset (Ceccarelli et al., 2016), Im1 was mainly comprised of LGm2 (67/192, 34%) and LGm3 (98/101, 97%). Tumors of LGm4 (18/19, 95%), LGm5 (33/34, 97%), and LGm6 (11/21, 52%) were enriched in Im2 subtype, whereas LGm2 (98/192, 51%) was prevalent in Im3 (Fig. S3).
Fig. 1.
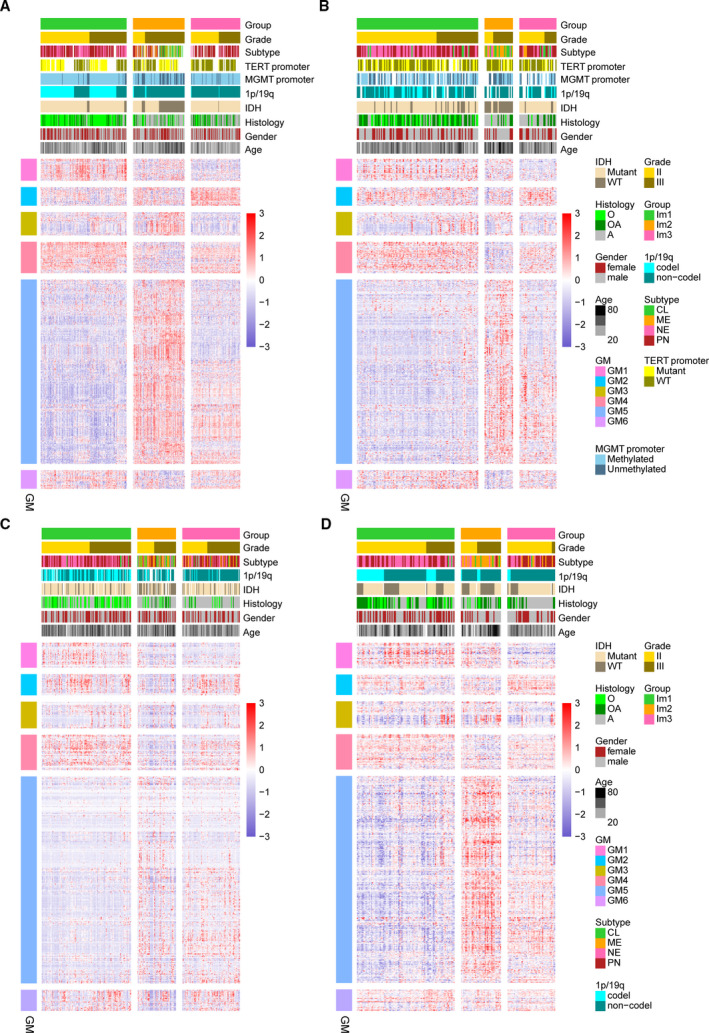
Consensus clustering identified three immune subtypes. (A) Heatmap of three immune subtypes defined by six GM (626 genes) in TCGA cohort. Genes are ordered based on the GM, and patients are arranged based on their immune subtypes. (B–D) Heatmaps show the immune subtypes of CGGA cohorts (cohort1, cohort2, and cohort3) predicted by a PAM classifier trained on the TCGA cohort. Patients are arranged based on the predicted immune subtypes. Genes are ordered according to the GM. Molecular and clinical information are also annotated for each patient.
Fig. 2.
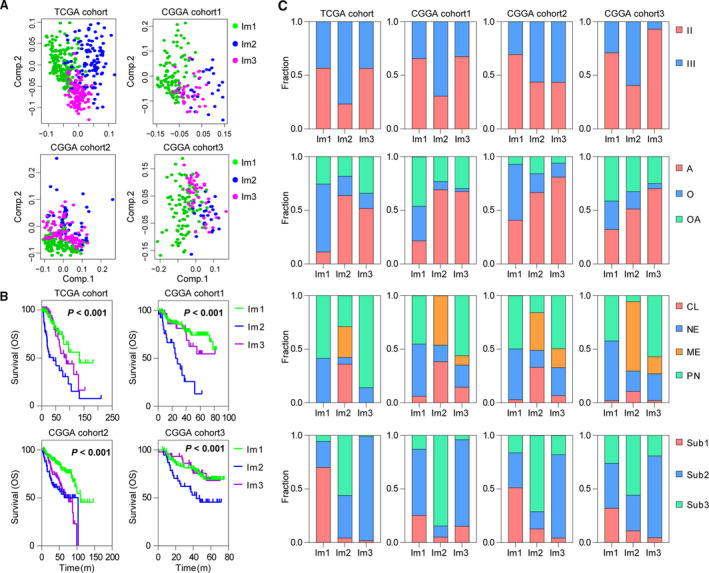
Three immune subtypes show distinct pathologic features and outcome in TCGA and CGGA cohorts. (A) PCA of three immune subtypes using 626 genes in TCGA and CGGA cohorts. (B) The Kaplan–Meier analysis of immune subtypes based on OS. P value was calculated by the log‐rank test among subtypes. (C) Bar plots show the proportion of tumors stratified by pathologic features within immune subtypes. CL, classical; ME, mesenchymal; NE, neural; PN, proneural. A, astrocytoma; O, oligodendroglioma; OA, oligoastrocytoma. Sub1: IDH mutant and 1p/19q codeleted, Sub2: IDH mutant and 1p/19q non‐codeleted, Sub3: IDH wild‐type.
To validate our findings in TCGA cohort, we evaluated reproducibility of the immune subtypes in CGGA cohorts. Each sample was assigned to an immune subtype according to the Pearson correlation of centroid (Fig. 1B–D). IGP statistic showed high consistency between TCGA and CGGA cohorts (Table S1). Moreover, the obtained immune subtypes displayed similar pattern of prognostic and pathological features with TCGA cohort (Fig. 2A–C).
3.2. Cellular and molecular characteristics of immune subtypes
To uncover the immune heterogeneity among these three subtypes, we resorted to several immune‐related tools. We computed stromal and immune scores based on the ESTIMATE method (Yoshihara et al., 2013). Compared with Im1 and Im3, tumors in Im2 had higher immune and stromal scores but lower purity (Fig. 3A). CIBERSORT (Newman et al., 2015) analysis also revealed Im1 had an increased percentage of lymphocytes, whereas Im2 and Im3 displayed higher level of M2 macrophages (Fig. 3B). We also used the ssGSEA (Hanzelmann et al., 2013) score to quantify the enrichment levels of immune cells and functions. Im2 subtype was associated with higher levels of CD8+ T cell, cytolytic activity, exhausted CD8+ T cells, macrophages, and elevated T‐cell costimulation. Most immune cells tended to be increased in Im1 and Im3 subtypes, such as B cells, neutrophils, Treg, Th1, and Th2. Notably, Im1 tumors showed higher enrichment of CD8+ T cell, Th17, and mast cells, whereas Im3 had relatively higher levels of T helper cells, pDCs, and macrophages, along with increased functions of APC and T‐cell coinhibition (Fig. 3C). In addition, Im2 had higher TCR diversity and more neoantigen load (Fig. S4). Most HLA and checkpoint genes showed significantly higher expression levels in Im2 subtype (Fig. S5). We next sought to dissect the immune infiltrations of each subtype in three CGGA cohorts and obtained consistent results (Figs 3A–C and S5). Collectively, these results suggested that the TME of Im2 was immune‐hot but highly immune‐suppressive, whereas Im1 and Im3 tumors showed relatively moderate immune microenvironment.
Fig. 3.
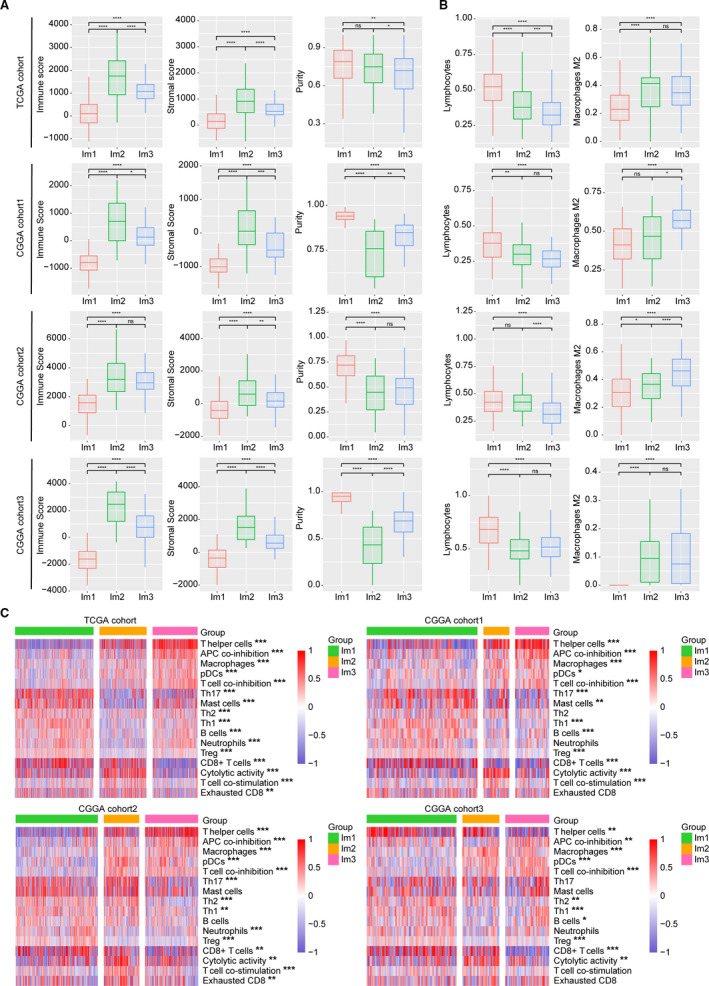
Tumor immune infiltrate in three immune subtypes. (A) Comparison of immune, stromal, and tumor purity scores (from ESTIMATE) for different immune subtypes in TCGA and CGGA cohorts (t‐test). (B) Comparison of lymphocyte and M2 macrophage proportion (from CIBERSORT) for different immune subtypes in TCGA and CGGA cohorts (t‐test). Lymphocytes = B cells+ T‐cell CD4+ T‐cell CD8+ T‐cell follicular helper+ Tregs+ T‐cell gamma/delta+ NK cells+ plasma cells. Error bars show standard error of the mean, and the middle bar represents the median level of corresponding features. (C) Hierarchical clustering of GSVA signature scores in TCGA and CGGA cohorts (ANOVA test). *P < 0.05; **P < 0.01; ***P < 0.001.
3.3. Prognostic associations of tumor immune response measures
Since infiltrating immune cells have been shown to be prognostic in many human cancers (Gentles et al., 2015), we determined the effects of immune cell signatures and functions on the outcome of diffuse LGG. Out of these immune signatures, Th1, mast cells, neutrophils, and Treg were associated with better OS. When stratified by immune subtypes, improved survival was observed in association with cytolytic activity in Im2, and Im1 patients with high scores of neutrophils or Treg tended to have better outcome (Fig. 4A,B). Likewise, we assessed the prognostic value of major immune checkpoints, and found that high expression of PDCD1, HAVCR2, and IDO1 implied worse outcome (Fig. S6A,B). When stratified by IDH and 1p/19q status, these immune signatures and checkpoints showed no significant prognostic correlation (Fig. S7). Additionally, strong correlations were observed between cytolytic activity and T‐cell costimulation/inflammation‐promoting, neutrophils and Treg, T‐cell coinhibition and T helper cells/pDCs/APC coinhibition, PDCD1 and IDO1/LAG3 (Fig. S8A,B). We next interrogated the validation cohort and obtained similar results (Figs 4, S6 and S8). These results suggested that infiltrating immune cells might impact patients’ outcome, and provided valuable targets of immune treatment for diffuse LGG.
Fig. 4.
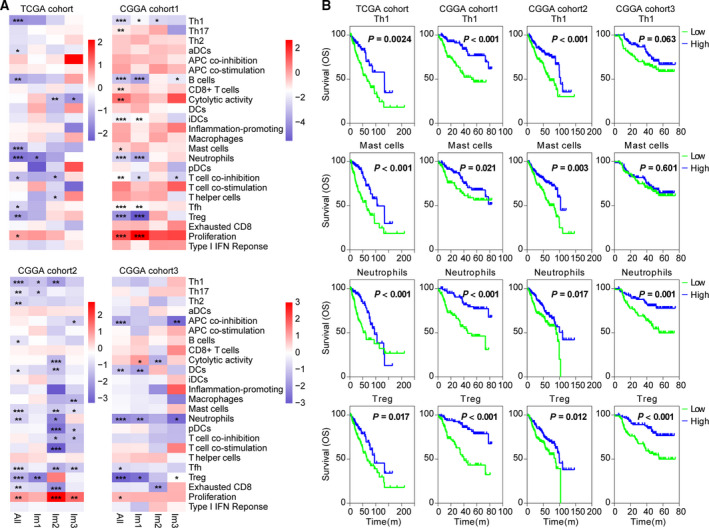
Immune cell signatures were associated with clinical outcome of diffuse LGG. (A) Heatmaps show hazard ratios for immune expression signature scores in relation to v within immune subtypes. Correlation of OS was assessed by Cox regression analysis. *P < 0.05; **P < 0.01; and ***P < 0.001. (B) The Kaplan–Meier analyses of tumors stratified by Th1, mast cell, neutrophil, and Treg scores in TCGA and CGGA cohorts. P value was calculated by the log‐rank test.
3.4. Somatic variation of immune subtypes
Recent studies have linked the tumoral genomic alterations with immune infiltrate (Charoentong et al., 2017; Thorsson et al., 2018). We further explored the difference in genomic alterations among these three immune subtypes. Im2 tumors showed high aneuploidy, homologous recombination deficiency, and copy‐number burden scores, as well as increased tumor mutation burden (Fig. 5A). We correlated gene mutations with immune subtypes and found significant associations. Im1 was enriched in IDH1, 1p/19q codeletion, CIC, FUBP1, and NOTCH1 mutations. Im2 was enriched in mutations in driver genes, such as PTEN, EGFR, and NF1, a finding of note since tumors with NF1 mutation had increased macrophage infiltration (Wang et al., 2017). Im3 was enriched in IDH1, ATRX, and TP53 mutations (Fig. 5B). GISTIC2.0 analysis revealed distinct CNAs among immune subtypes. Im2 showed more frequently deleted or amplified regions, such as CDKN2A/CDKN2B, EGFR1, CDK4, KIT, and PDGFRA (Fig. 5B). These findings indicated that tumors with high immune infiltration might have higher levels of genomic alterations.
Fig. 5.
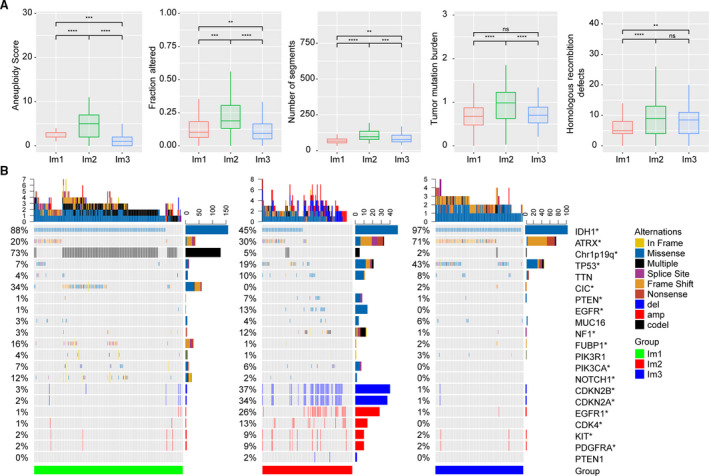
Genomic alterations within immune subtypes of TCGA cohort. (A) Comparison of DNA damage measures within immune subtypes of TCGA cohort (t‐test). Error bars show standard error of the mean, and the middle bar represents the median level of corresponding features. (B) Differential somatic mutations and copy‐number variations analyses within three immune subtypes (Fisher test). *P < 0.05; **P < 0.01; ***P < 0.001; and ****P < 0.0001.
3.5. Dimension reduction analysis identifies two distinct subgroups in Im2
For defining the immune landscape of diffuse LGG, we further applied the graph learning‐based dimensionality reduction analysis (Li et al., 2019; Trapnell et al., 2014) to the immune gene expression profiles. We observed that Im2 could be further divided into two subgroups (Im2A and Im2B) based on their location in the immune landscape (Fig. 6A,B). Interestingly, the two subgroups were associated with distinct prognosis. Compared with Im2B, Im2A had better outcome (Fig. 6C). Of note, ssGSVA found Im2A was associated with higher levels of immune cells and functions, such as T helper cells, CD8+ T cells, cytolytic activity, exhausted CD8+ T cells, neutrophils, macrophages, T‐cell coinhibitions, APC costimulation, and pDCs, suggesting a hot and suppressive immune microenvironment in Im2A. In contrast, Im2B showed a relatively cold immune state and enhanced proliferation rate (Fig. 6D). In addition, CIBERSORT (Newman et al., 2015) analysis also revealed Im2A had an increased percentage of M2 macrophages (Fig. 6E). Similar results were obtained in Im2 subtype of CGGA cohort2 (Fig. 6). There data further indicated a significant intracluster heterogeneity within immune subtypes.
Fig. 6.
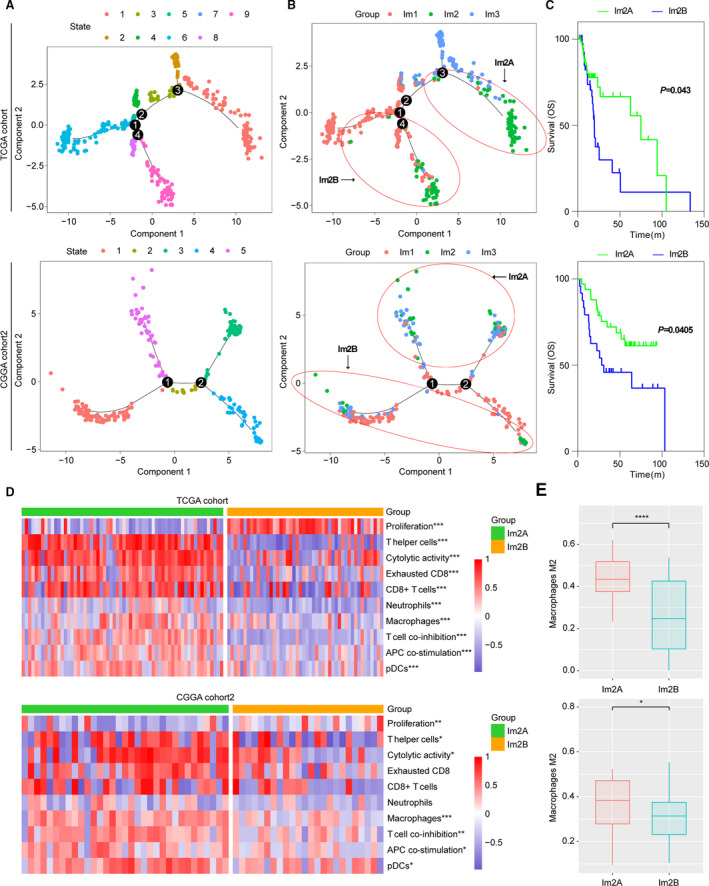
The intracluster heterogeneity revealed by the immune landscape analysis in TCGA cohort and CGGA cohort 2. (A, B) Graph learning‐based dimensionality reduction analysis to the immune gene expression profiles with colored state and immune subtypes. Each point represents a patient with colors corresponding to state and immune subtypes. (C) The Kaplan–Meier analysis of two Im2 subtypes based on OS. P value was calculated by the log‐rank test. (D) Hierarchical clustering of GSVA signature scores (t‐test). (E) Comparison of M2 macrophage proportion (from CIBERSORT) between Im2A and Im2B (t‐test). Error bars show standard error of the mean, and the middle bar represents the median level of corresponding feature. * P < 0.05; **P < 0.01; and ***P < 0.001.
3.6. Development and validation of an immune‐related signature using Cox proportional hazards model
We obtained and validated a survival model using elastic‐net Cox proportional hazards modeling with cross‐validation. SAM analysis identified 421 differentially expressed immune genes between Im2 and Im1/m3 subtypes, wherein 359 genes were significantly correlated with patients’ OS in univariate Cox regression analysis (Fig. 7A). Then, Cox proportional hazards modeling was performed for identifying a model with best prognostic value (Fig. 7B). An eight‐gene immune signature was obtained, and the scores were computed with the regression coefficients (Fig. 7C). High scores were enriched in tumors of Im2, classical and mesenchymal, grade III, or IDH wild‐type (Fig. 7D). The Kaplan–Meier analysis revealed that high scores implied significantly poorer outcome in patients of diffuse LGG or each immune subtype (Fig. 7E,F). In addition, the acquired signature had higher area under the curve (AUC) compared with other factors (age and grade) (Fig. 7G). Multivariate Cox regression analysis also confirmed the independent prognostic value of this immune signature (Tables S2 and S3). We further applied this signature into validation cohorts and found consistent results (Fig. S9, Tables S2 and S3). These data demonstrated the superior performance of immune signature for prognosis prediction, highlighting the importance of the immune TME in determining survival.
Fig. 7.
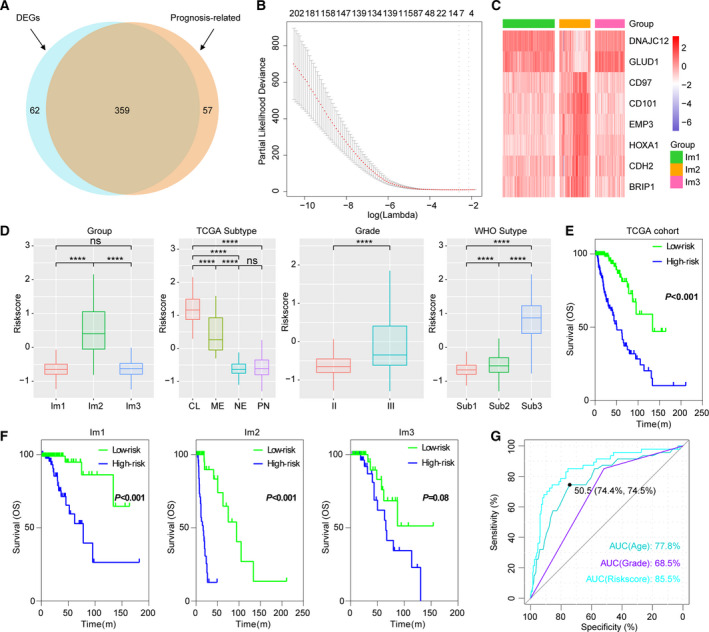
Identification of an immune signature by Cox proportional hazards model. (A) Venn diagram shows prognosis‐related immune genes, which are differentially expressed between Im2 and Im1/m3 subtypes. (B) Cross‐validation for tuning parameter selection in the proportional hazards model. (C) Heatmap shows the expression levels of signature genes. (D) Distribution of immune scores in cases stratified by immune subtype, grade, TCGA, and WHO subtype. CL, classical; ME, mesenchymal; NE, neural; PN, proneural. Sub1: IDH mutant and 1p/19q codeleted, Sub2: IDH mutant and 1p/19q non‐codeleted, Sub3: IDH wild‐type. *P < 0.05; **P < 0.01; ***P < 0.001;****P < 0.0001. (E, F) Survival analysis of the immune signature in diffuse LGG or immune subtypes. P value was calculated by the log‐rank test. (G) ROC curve analysis of age, grade, and immune score.
4. Discussion
Recently, early studies from clinical practice or ongoing trials with immunotherapies show limited effectiveness in treatment of glioma (Ahmed et al., 2017; Schalper et al., 2019; Weller et al., 2017). A better understanding of the tumor immune microenvironment is critical for improving the efficacy of current immunotherapies. Here, we presented a comprehensive characterization of immunological profile of lower‐grade diffuse glioma. Our results showed that diffuse LGG could be classified into three stable subtypes, and the reproducibility of this classification was demonstrated in validation cohort. Each of the immune subtypes was associated with distinct immune cell fractions, functions (from deconvolution of gene expression), somatic alterations, and clinical outcomes. Our works deepened the understanding of immune microenvironment of diffuse LGG, and provided valuable information for personalized immunotherapy.
Im2 subtype conferred the worst outcome on their constituent tumors and showed composite signatures reflecting a high lymphocytic infiltrate, with high M2 macrophage content and checkpoint gene expression, indicating an immune‐hot but immune‐suppressive TME. Im1 had favorable prognosis and demonstrated the most pronounced Th17 signature, consistent with a recent study suggesting that Th17 expression is associated with improved survival (Punt et al., 2015). Im3 was T helper cell‐dominant and showed a better survival despite having high M2 macrophage content. Given that the discrete subtype information did not provide the intrinsic structure and distribution of individual patients, we further applied the graph learning‐based dimensionality reduction analysis to the immune gene expression profiles (Trapnell et al., 2014). We revealed that Im2 subtype could be further divided into two subgroups, which had significant difference in immune infiltration and prognosis. Compared with Im2A, Im2B displayed lower lymphocytic infiltrate and worse outcome, in agreement with a cold TME for which a poor outcome would be expected. These implied the complexity of immune landscape of diffuse LGG.
Recently, Amankulor and colleagues reported that the IDH1 mutation is associated with a decreased number of immune cells in the glioma tumor microenvironment (Amankulor et al., 2017). Consistently, we showed that Im1 and Im2, which were enriched in IDH1 mutation, had lower immune infiltrate. We also observed that Im2, which was enriched in NF1 mutation, was characterized by high macrophages, in agreement with the finding that tumors with NF1 mutation had increased macrophage infiltration in glioma (Wang et al., 2017). These indicated that the somatic alterations might shape the immune subset composition, and further work is needed to determine the functional aspects of these correlations.
Tumor neoantigens are associated with improved survival and thought to be key targets of antitumor immunity in many tumors (Brown et al., 2014). As expected, Im2 subtype, which had more mutation burden, was associated with increased neoantigen load. However, we observed conflicting result that Im2 subtype showed worse prognosis, suggesting that the role of neoantigens might vary in LGG, or inaccurate method for neoantigen identification.
When we associated immune subtype with IDH or 1p/19q status in TCGA cohort, 95% (130/137) of IDH mutant and 1p/19q codeleted LGG were enriched in Im1. 85% (62/72) IDH wild‐type LGG were enriched in Im2. 23% (45/192), 23% (44/192), and 54% (103/192) of IDH mutant and 1p/19q non‐codeleted LGG were enriched in Im1, Im2, and Im3, respectively. These indicated that immune gene expression profiles could partially reproduced the WHO LGG classification based on IDH mutation and 1p/19q codeletion status. This consistency was meaningful for advancing our view of genomic and immune landscapes in LGG.
Considering the insufficiency of univariate Cox model for variable selection, we adopted an elastic‐net regression Cox modeling (Thorsson et al., 2018) to develop an immune signature that had better performance for prognosis prediction in diffuse LGG. Three hundred and fifty‐nine differentially expressed immune genes between Im2 and Im1/m3 subtypes were employed to develop a prognostic indictor. Low‐ and high‐score tumors displayed significant survival differences in both cohorts, with good prediction accuracy. However, more prospective studies were needed for further validation of this immune signature.
5. .Conclusions
In summary, three stable and reproducible immune subtypes were identified in lower‐grade diffuse glioma. These subtypes were associated with prognosis, genetic, molecular, and cellular characteristics that may shape the specific immune environment we have observed. The definition of the immune subtype of diffuse LGG may play a critical role in predicting clinical outcome, as well as rational design of immunotherapy.
Conflict of interest
The authors declare no conflict of interest.
Author contributions
WZ and ZZ conceived and designed the study. FW, ZW, KW, and GL performed most of analysis with assistance from RC, YL, HJ, YZ, and YF.
Supporting information
Fig. S1 . Consensus clustering based on immune gene expression of 402 diffuse LGGs in TCGA cohort.
Fig. S2 . GO analysis of GM3 and GM5.
Fig. S3 . Distribution of DNA methylation clusters within immune subtypes in TCGA cohort.
Fig. S4 . Comparison of neoantigen and TCR diversity between immune subtypes in TCGA cohort.
Fig. S5 . Heatmaps show the expression levels of HLA and checkpoint genes between immune subtypes in TCGA and CGGA cohorts.
Fig. S6 . Prognostic correlations of checkpoint gene in TCGA and CGGA cohorts.
Fig. S7. Prognostic correlations of immune signatures and checkpoint genes in IDH and 1p/19q stratified patients of TCGA cohort.
Fig. S8 . Correlation analysis of immune signatures and checkpoint genes.
Fig. S9 . Validation of immune signature in CGGA cohorts.
Table S1 . IGP was estimated for each immune subtype in the validation cohorts.
Table S2 . Univariate and multivariate Cox regression analysis of clinical pathologic features in TCGA and CGGA cohort1.
Table S3. Univariate and multivariate Cox regression analysis of clinical pathologic features in CGGA cohort2 and cohort3.
Acknowledgements
The authors conducting this work represent the Chinese Glioma Cooperative Group (CGCG).
This study was supported by the National Natural Science Foundation of China (NSFC)/Research Grants Council (RGC) Joint Research Scheme (81761168038), National Key Research and Development Plan (2016YFC0902500), and National Natural Science Foundation of China (81672479).
Fan Wu, Zhi‐Liang Wang, Kuan‐Yu Wang and Guan‐Zhang Li These authors contributed equally to this work
Contributor Information
Zheng Zhao, Email: zhaozheng0503@sina.com.
Wei Zhang, Email: zhangwei_vincent@126.com.
Data accessibility
All data supporting this study were openly available from TCGA database (http://cancergemome.nih.gov/) and CGGA database (http:// www.cgga.org.cn/).
References
- Ahmed N, Brawley V, Hegde M, Bielamowicz K, Kalra M and Landi D (2017) HER2‐specific chimeric antigen receptor‐modified virus‐specific T cells for progressive glioblastoma: a phase 1 dose‐escalation trial. JAMA Oncol 3, 1094–1101. [DOI] [PMC free article] [PubMed] [Google Scholar]
- Amankulor NM, Kim Y, Arora S, Kargl J, Szulzewsky F and Hanke M (2017) Mutant IDH1 regulates the tumor‐associated immune system in gliomas. Genes Dev 31, 774–786. [DOI] [PMC free article] [PubMed] [Google Scholar]
- Berghoff AS, Kiesel B, Widhalm G, Rajky O, Ricken G and Wohrer A (2015) Programmed death ligand 1 expression and tumor‐infiltrating lymphocytes in glioblastoma. Neuro Oncol 17, 1064–1075. [DOI] [PMC free article] [PubMed] [Google Scholar]
- Bockmayr M, Klauschen F, Maire CL, Rutkowski S, Westphal M and Lamszus K (2019) Immunologic profiling of mutational and transcriptional subgroups in pediatric and adult high‐grade gliomas. Cancer Immunol Res 7, 1401–1411. [DOI] [PubMed] [Google Scholar]
- Brown CE, Badie B, Barish ME, Weng L, Ostberg JR and Chang WC (2015) Bioactivity and safety of IL13Ralpha2‐redirected chimeric antigen receptor CD8+ T cells in patients with recurrent glioblastoma. Clin Cancer Res 21, 4062–4072. [DOI] [PMC free article] [PubMed] [Google Scholar]
- Brown SD, Warren RL, Gibb EA, Martin SD, Spinelli JJ and Nelson BH (2014) Neo‐antigens predicted by tumor genome meta‐analysis correlate with increased patient survival. Genome Res 24, 743–750. [DOI] [PMC free article] [PubMed] [Google Scholar]
- Cancer Genome Atlas Research Network , Brat DJ, Verhaak RG, Aldape KD, Yung WK and Salama SR (2015) Comprehensive, integrative genomic analysis of diffuse lower‐grade gliomas. N Engl J Med 372, 2481–2498. [DOI] [PMC free article] [PubMed] [Google Scholar]
- Ceccarelli M, Barthel FP, Malta TM, Sabedot TS, Salama SR and Murray BA (2016) Molecular profiling reveals biologically discrete subsets and pathways of progression in diffuse glioma. Cell 164, 550–563. [DOI] [PMC free article] [PubMed] [Google Scholar]
- Charoentong P, Finotello F, Angelova M, Mayer C, Efremova M and Rieder D (2017) Pan‐cancer immunogenomic analyses reveal genotype‐immunophenotype relationships and predictors of response to checkpoint blockade. Cell Rep 18, 248–262. [DOI] [PubMed] [Google Scholar]
- Chemin I (2010) Evaluation of a hepatitis B vaccination program in Taiwan: impact on hepatocellular carcinoma development. Future Oncol 6, 21–23. [DOI] [PubMed] [Google Scholar]
- Chongsathidkiet P, Jackson C, Koyama S, Loebel F, Cui X and Farber SH (2018) Sequestration of T cells in bone marrow in the setting of glioblastoma and other intracranial tumors. Nat Med 24, 1459–1468. [DOI] [PMC free article] [PubMed] [Google Scholar]
- Christofi T, Baritaki S, Falzone L, Libra M and Zaravinos A (2019) Current perspectives in cancer immunotherapy. Cancers 11,1472 [DOI] [PMC free article] [PubMed] [Google Scholar]
- Del Paggio JC (2018) Immunotherapy: cancer immunotherapy and the value of cure. Nat Rev Clin Oncol 15, 268–270. [DOI] [PubMed] [Google Scholar]
- Fecci PE and Sampson JH (2019) The current state of immunotherapy for gliomas: an eye toward the future. J Neurosurg 131, 657–666. [DOI] [PubMed] [Google Scholar]
- Gentles AJ, Newman AM, Liu CL, Bratman SV, Feng W and Kim D (2015) The prognostic landscape of genes and infiltrating immune cells across human cancers. Nat Med 21, 938–945. [DOI] [PMC free article] [PubMed] [Google Scholar]
- Grupp SA, Kalos M, Barrett D, Aplenc R, Porter DL and Rheingold SR (2013) Chimeric antigen receptor‐modified T cells for acute lymphoid leukemia. N Engl J Med 368, 1509–1518. [DOI] [PMC free article] [PubMed] [Google Scholar]
- Hanzelmann S, Castelo R and Guinney J (2013) GSVA: gene set variation analysis for microarray and RNA‐seq data. BMC Bioinformat 14, 7. [DOI] [PMC free article] [PubMed] [Google Scholar]
- He Y, Jiang Z, Chen C and Wang X (2018) Classification of triple‐negative breast cancers based on immunogenomic profiling. J Exp Clin Cancer Res 37, 327. [DOI] [PMC free article] [PubMed] [Google Scholar]
- Hu H, Mu Q, Bao Z, Chen Y, Liu Y and Chen J (2018) Mutational landscape of secondary glioblastoma guides MET‐targeted trial in brain tumor. Cell 175, 1665–1678.e18 [DOI] [PubMed] [Google Scholar]
- Hughey JJ and Butte AJ (2015) Robust meta‐analysis of gene expression using the elastic net. Nucleic Acids Res 43, e79. [DOI] [PMC free article] [PubMed] [Google Scholar]
- Jiang T, Mao Y, Ma W, Mao Q, You Y and Yang X (2016) CGCG clinical practice guidelines for the management of adult diffuse gliomas. Cancer Lett 375, 263–273. [DOI] [PubMed] [Google Scholar]
- Johnson LA, Scholler J, Ohkuri T, Kosaka A, Patel PR and McGettigan SE (2015) Rational development and characterization of humanized anti‐EGFR variant III chimeric antigen receptor T cells for glioblastoma. Sci Transl Med 7, 275ra22. [DOI] [PMC free article] [PubMed] [Google Scholar]
- Kalos M, Levine BL, Porter DL, Katz S, Grupp SA and Bagg A (2011) T cells with chimeric antigen receptors have potent antitumor effects and can establish memory in patients with advanced leukemia. Sci Transl Med 3, 95ra73. [DOI] [PMC free article] [PubMed] [Google Scholar]
- Kantoff PW, Higano CS, Shore ND, Berger ER, Small EJ and Penson DF (2010) Sipuleucel‐T immunotherapy for castration‐resistant prostate cancer. N Engl J Med 363, 411–422. [DOI] [PubMed] [Google Scholar]
- Kapp AV and Tibshirani R (2007) Are clusters found in one dataset present in another dataset? Biostatistics 8, 9–31. [DOI] [PubMed] [Google Scholar]
- Lapointe S, Perry A and Butowski NA (2018) Primary brain tumours in adults. Lancet 392, 432–446. [DOI] [PubMed] [Google Scholar]
- Le DT, Uram JN, Wang H, Bartlett BR, Kemberling H and Eyring AD (2015a) PD‐1 blockade in tumors with mismatch‐repair deficiency. N Engl J Med 372, 2509–2520. [DOI] [PMC free article] [PubMed] [Google Scholar]
- Le DT, Wang‐Gillam A, Picozzi V, Greten TF, Crocenzi T and Springett G (2015b) Safety and survival with GVAX pancreas prime and Listeria Monocytogenes‐expressing mesothelin (CRS‐207) boost vaccines for metastatic pancreatic cancer. J Clin Oncol 33, 1325–1333. [DOI] [PMC free article] [PubMed] [Google Scholar]
- Li B, Cui Y, Nambiar DK, Sunwoo JB and Li R (2019) The immune subtypes and landscape of squamous cell carcinoma. Clin Cancer Res 25, 3528–3537. [DOI] [PMC free article] [PubMed] [Google Scholar]
- Lohr J, Ratliff T, Huppertz A, Ge Y, Dictus C and Ahmadi R (2011) Effector T‐cell infiltration positively impacts survival of glioblastoma patients and is impaired by tumor‐derived TGF‐beta. Clin Cancer Res 17, 4296–4308. [DOI] [PubMed] [Google Scholar]
- Louis DN, Perry A, Reifenberger G, von Deimling A, Figarella‐Branger D and Cavenee WK (2016) The 2016 World Health Organization classification of tumors of the central nervous system: a summary. Acta Neuropathol 131, 803–820. [DOI] [PubMed] [Google Scholar]
- Luoto S, Hermelo I, Vuorinen EM, Hannus P, Kesseli J and Nykter M (2018) Computational characterization of suppressive immune microenvironments in glioblastoma. Cancer Res 78, 5574–5585. [DOI] [PubMed] [Google Scholar]
- Mammas IN, Sourvinos G, Zaravinos A and Spandidos DA (2011) Vaccination against human papilloma virus (HPV): epidemiological evidence of HPV in non‐genital cancers. Pathol Oncol Res 17, 103–119. [DOI] [PubMed] [Google Scholar]
- Mirjacic Martinovic KM, Vuletic AM, Lj Babovic N, Dzodic RR, Konjevic GM and Jurisic VB (2017) Attenuated in vitro effects of IFN‐alpha, IL‐2 and IL‐12 on functional and receptor characteristics of peripheral blood lymphocytes in metastatic melanoma patients. Cytokine 96, 30–40. [DOI] [PubMed] [Google Scholar]
- Newman AM, Liu CL, Green MR, Gentles AJ, Feng W and Xu Y (2015) Robust enumeration of cell subsets from tissue expression profiles. Nat Methods 12, 453–457. [DOI] [PMC free article] [PubMed] [Google Scholar]
- Punt S, Langenhoff JM, Putter H, Fleuren GJ, Gorter A and Jordanova ES (2015) The correlations between IL‐17 vs. Th17 cells and cancer patient survival: a systematic review. Oncoimmunology 4, e984547. [DOI] [PMC free article] [PubMed] [Google Scholar]
- Reck M, Rodriguez‐Abreu D, Robinson AG, Hui R, Csoszi T and Fulop A (2016) Pembrolizumab versus chemotherapy for PD‐L1‐positive non‐small‐cell lung cancer. N Engl J Med 375, 1823–1833. [DOI] [PubMed] [Google Scholar]
- Schalper KA, Rodriguez‐Ruiz ME, Diez‐Valle R, Lopez‐Janeiro A, Porciuncula A and Idoate MA (2019) Neoadjuvant nivolumab modifies the tumor immune microenvironment in resectable glioblastoma. Nat Med 25, 470–476. [DOI] [PubMed] [Google Scholar]
- Thorsson V, Gibbs DL, Brown SD, Wolf D, Bortone DS and Ou Yang TH (2018) The immune landscape of cancer. Immunity 48, 812–830. e14. [DOI] [PMC free article] [PubMed] [Google Scholar]
- Tibshirani R, Hastie T, Narasimhan B and Chu G (2002) Diagnosis of multiple cancer types by shrunken centroids of gene expression. Proc Natl Acad Sci USA 99, 6567–6572. [DOI] [PMC free article] [PubMed] [Google Scholar]
- Trapnell C, Cacchiarelli D, Grimsby J, Pokharel P, Li S and Morse M (2014) The dynamics and regulators of cell fate decisions are revealed by pseudotemporal ordering of single cells. Nat Biotechnol 32, 381–386. [DOI] [PMC free article] [PubMed] [Google Scholar]
- Wang Q, Hu B, Hu X, Kim H, Squatrito M and Scarpace L (2017) Tumor evolution of glioma‐intrinsic gene expression subtypes associates with immunological changes in the microenvironment. Cancer Cell 32, 42–56. e6. [DOI] [PMC free article] [PubMed] [Google Scholar]
- Weller M, Butowski N, Tran DD, Recht LD, Lim M and Hirte H (2017) Rindopepimut with temozolomide for patients with newly diagnosed, EGFRvIII‐expressing glioblastoma (ACT IV): a randomised, double‐blind, international phase 3 trial. Lancet Oncol 18, 1373–1385. [DOI] [PubMed] [Google Scholar]
- Wilkerson MD and Hayes DN (2010) ConsensusClusterPlus: a class discovery tool with confidence assessments and item tracking. Bioinformatics 26, 1572–1573. [DOI] [PMC free article] [PubMed] [Google Scholar]
- Wolchok JD, Kluger H, Callahan MK, Postow MA, Rizvi NA and Lesokhin AM (2013) Nivolumab plus ipilimumab in advanced melanoma. N Engl J Med 369, 122–133. [DOI] [PMC free article] [PubMed] [Google Scholar]
- Wu F, Chai RC, Wang Z, Liu YQ, Zhao Z and Li GZ (2019a) Molecular classification of IDH‐mutant glioblastomas based on gene expression profiles. Carcinogenesis 40, 853–860. [DOI] [PMC free article] [PubMed] [Google Scholar]
- Wu F, Zhao Z, Chai RC, Liu YQ, Li GZ and Jiang HY (2019b) Prognostic power of a lipid metabolism gene panel for diffuse gliomas. J Cell Mol Med 23, 7741–7748. [DOI] [PMC free article] [PubMed] [Google Scholar]
- Yoshihara K, Shahmoradgoli M, Martinez E, Vegesna R, Kim H and Torres‐Garcia W (2013) Inferring tumour purity and stromal and immune cell admixture from expression data. Nat Commun 4, 2612. [DOI] [PMC free article] [PubMed] [Google Scholar]
- Zhao Z, Meng F, Wang W, Wang Z, Zhang C and Jiang T (2017) Comprehensive RNA‐seq transcriptomic profiling in the malignant progression of gliomas. Sci Data 4, 170024. [DOI] [PMC free article] [PubMed] [Google Scholar]
Associated Data
This section collects any data citations, data availability statements, or supplementary materials included in this article.
Supplementary Materials
Fig. S1 . Consensus clustering based on immune gene expression of 402 diffuse LGGs in TCGA cohort.
Fig. S2 . GO analysis of GM3 and GM5.
Fig. S3 . Distribution of DNA methylation clusters within immune subtypes in TCGA cohort.
Fig. S4 . Comparison of neoantigen and TCR diversity between immune subtypes in TCGA cohort.
Fig. S5 . Heatmaps show the expression levels of HLA and checkpoint genes between immune subtypes in TCGA and CGGA cohorts.
Fig. S6 . Prognostic correlations of checkpoint gene in TCGA and CGGA cohorts.
Fig. S7. Prognostic correlations of immune signatures and checkpoint genes in IDH and 1p/19q stratified patients of TCGA cohort.
Fig. S8 . Correlation analysis of immune signatures and checkpoint genes.
Fig. S9 . Validation of immune signature in CGGA cohorts.
Table S1 . IGP was estimated for each immune subtype in the validation cohorts.
Table S2 . Univariate and multivariate Cox regression analysis of clinical pathologic features in TCGA and CGGA cohort1.
Table S3. Univariate and multivariate Cox regression analysis of clinical pathologic features in CGGA cohort2 and cohort3.
Data Availability Statement
All data supporting this study were openly available from TCGA database (http://cancergemome.nih.gov/) and CGGA database (http:// www.cgga.org.cn/).


