Abstract
Different sol‐gel synthesis methods were used to obtain four nanostructured mesoporous TiO2 samples for an efficient photocatalytic degradation of the emerging contaminant N‐phenylurea under either simulated solar light (1 Sun) or UV light. Particularly, two TiO2 samples were obtained by means of as many template‐assisted syntheses, whereas other two TiO2 samples were obtained by a greener template‐free procedure, implying acidic conditions and, then, calcination at either 200 °C or 600 °C. In one case, anatase was obtained, whereas in the other three cases mixed crystalline phases were obtained. The four TiO2 samples were characterized by X‐ray powder diffraction (followed by Rietveld analysis); Transmission Electron Microscopy; N2 adsorption/desorption at −196 °C; Diffuse Reflectance UV/Vis spectroscopy and ζ‐potential measurements. A commercial TiO2 powder (i. e., Degussa P25) was used for comparison. Differences among the synthesized samples were observed not only in their quantitative phase composition, but also in their nanoparticles morphology (shape and size), specific surface area, pore size distribution and pHIEP (pH at isoelectric point), whereas the samples band‐gap did not vary sizably. The samples showed different photocatalytic behavior in terms of N‐phenylurea degradation, which are ascribed to their different physico‐chemical properties and, especially, to their phase composition, stemming from the different synthesis conditions.
Keywords: brookite, mesoporous TiO2, heterojunctions, solar light, N-phenylurea.
Three different sol‐gel synthesis methods were adopted to produce four TiO2 samples with different phase composition. A greener template‐free method working under acidic conditions led to the formation of high‐brookite content mixed phases. Under solar light, these substances revealed a fair photocatalytic activity towards the degradation of a pollutant of environmental concern.
1. Introduction
Due to its low toxicity, earth abundance and diversity (i. e. occurrence of several polymorphs and amorphous phases; surface area; porosity; particles shape and size; etc.), TiO2 is widely used as biocompatible material; food additive; photocatalyst1, 2 as well as in catalysis,3 gas sensors; PCPPs (Personal Care and Pharmaceutical Products); sun screens; self‐cleaning surfaces; pigments; etc.4, 5
The three most common TiO2 polymorphs are anatase, rutile and brookite,6 with average band gap values of 3.2, 3.0 and 3.4 eV, respectively. Notoriously, the band gap is not the only crucial parameter affecting TiO2 photocatalytic performance, which suffers from two (main) drawbacks:
poor absorption of the solar spectrum, which just contains ca. 4 % UV fraction, whereas TiO2 mainly absorbs below 380 nm, due to the band gap energy (Eg), which, in turn, slightly varies with nanoparticles (NPs) size, crystallinity and occurring phase(s);7, 8
fast e−/h+ pairs recombination rate.9 Although light absorption (occurring in ca. 10−15 s) is faster than e−/h+ pair recombination (occurring in ca. 10−10 s), the diffusion length of the charge carriers plays an important role in the recombination phenomenon, which remarkably decreases TiO2 photocatalytic activity.10, 11, 12
To cope with those issues, different types of TiO2 modifications are proposed in the literature, like doping with metals and/or non‐metals (in order to extend absorption in the Vis range);13 production of composite materials containing heterojunctions;14, 15 control of polymorphic phases and of (meso)porosity.16 Factors like NPs size, shape, exposed facets, etc. can affect polymorph stability and photocatalytic performance, as well.5, 17, 18
Notwithstanding the slightly larger bad gap as compared to rutile, in photocatalysis anatase is the most investigated polymorph. Due to low surface energy,17 ca. 10–20 nm large anatase NPs can be easily obtained by different synthesis methods. More importantly, anatase is an indirect band gap semiconductor, at variance with rutile and brookite: consequently, the photogenerated electrons and holes (e−/h+) have longer lifetime in anatase, a factor positively affecting its photocatalytic performance, especially under UV light.18 To this end, brookite and rutile mainly differ in the depth of electron trapping states, which are shallower in the former: such a moderate depth of electron traps can reduce e−/h+ recombination in brookite, finally helping its activity in either photo‐reduction or photo‐oxidation processes.19, 20 Therefore, a lot of interest is devoted to brookite: being a metastable phase, its transition to more stable phases occurs when samples are treated at high temperature before use5 and, thus, at variance with both anatase and rutile, brookite samples are hardly obtainable. As a whole, the mechanism of formation of the different phases in TiO2 NPS is not clear and controversial explanations are provided (likely due to the variety of synthesis methods employed). Recently, many papers started to appear concerning the synthesis of brookite TiO2, like nanorods grown in non‐aqueous environment,21 but most of papers deal with (brookite‐containing) mixed phases. As a matter of fact, when heterojunctions occur in TiO2 mixed phases, positive effects are observed, like in water splitting: a 20 fold greater rate of photochemical H2 production was measured in the presence of brookite‐rutile heterojunctions with respect to Degussa P25.22 The latter is the most used type of commercial TiO2 (lately named Evonik‐Degussa Airoxide and hereafter referred to as P25), which is synthesized by flame hydrolysis of TiCl4 and shows dispersed and extremely fine aggregates of NPs formed by intimately interconnected anatase and rutile phases23 (usually in 80/20 wt. % ratio, respectively). According to the literature, such interconnection between the two phases is responsible of the stabilization of the photogenerated e−/h+ pairs, finally making P25 an efficient photocatalyst under UV illumination. Presence of heterojunctions is crucial in P25, where the e−/h+ pairs stabilization is believed to occur in two ways: i) rutile can contribute to trap electrons photogenerated in the anatase phase; ii) rutile can act as an electron antenna for the anatase phase, where charge separation occurs. By both ways, a mismatch between e‐/h+ is generated and photocatalytic performance is enhanced.24, 25 In CuOx/TiO2 photocatalysts, Liu et al.14, 15 demonstrated that the interaction between the components strongly depends on TiO2 morphology, finally suggesting that TiO2 morphology engineering could be a valuable tool to tune photocatalytic properties of such composite materials
Conversely, much less is known about the role of brookite in mixed phase samples, although usually the co‐presence of brookite along with anatase or rutile improves photocatalytic activity.26, 27 For instance, the presence of brookite in mixed‐phase TiO2 has been found to be responsible of a superior activity under solar light, especially when dye‐sensitizing effects occur.28, 29 To this respect, some of us obtained encouraging results in the photocatalytic degradation of Rhodamine B by solar light illumination under low irradiance conditions (adopted in order to reduce/avoid dye‐sensitizing effects) with a TiO2 mixed phase, where the positive effect of brookite was demonstrated.29
Another means to improve TiO2 photocatalytic activity is to synthesize high surface area NPs, with regular size, and possibly characterized by intra‐ and inter‐particle mesoporosity (or hierarchical porosity), in order to facilitate diffusion of reagents/products.16 Whatever the reaction (and thus the mechanism) of concern, reagent(s) adsorption is the first step, which should occur in a time range of ca. 10−10 s in order to hamper e−/h+ pairs recombination.
Different synthesis methods are reported in the literature to obtain mesoporous TiO2 NPs with high surface area, usually relying on the sol‐gel technique, often in the presence of (hard or soft) templates. The use of hard templates is particularly sound to produce porous TiO2 films, whereas the powders studied in this paper were obtained by two types of (soft) template assisted sol‐gel synthesis and one template free sol‐gel synthesis carried out at acidic pH (Scheme 1).
Scheme 1.
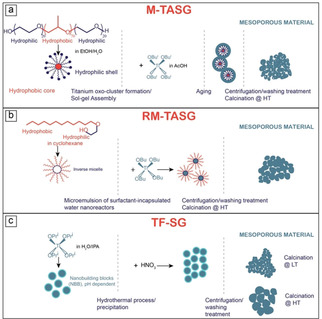
Three sol‐gel routes for the synthesis of mesoporous TiO2 samples: a) micelle template assisted sol gel (M‐TASG) method; b) reverse‐micelle template assisted sol gel (RM‐TASG) method; c) template free sol gel (TF‐SG) method under pH control
In Scheme 1, the following processes are described: a micelle template assisted sol‐gel (M‐TASG) method in the presence of a tri‐block copolymer forming micelles in water/ethanol, so to obtain TiO2 NPs characterized by both intra‐ and inter‐particle mesoporosity29 (the obtained TiO2 sample will be labelled with the prefix M); a reverse‐micelle template assisted sol‐gel (RM‐ TASG) method, where a di‐block surfactant is used in a cyclohexane/water mixture, so to obtain TiO2 NPs characterized by inter‐particle mesoporosity30 (the obtained TiO2 sample will be labelled with the prefix RM); a template free sol‐gel (TF‐SG) method under pH control so to obtain TiO2 NPs that underwent calcination at two different temperatures (either 200 or 600 °C) with the aim of tuning both the brookite content and the NPs size31 (the obtained TiO2 samples will be labelled with the prefix TF).
The samples were characterized by means of X‐ray powder diffraction (XRD) followed by Rietveld Quantitative Phase Analysis (QPA); Transmission Electron Microscopy (TEM); N2 adsorption/desorption isotherms at −196 °C; Diffuse Reflectance (DR) UV/Vis spectroscopy and ζ‐potential measurements. Those techniques were adopted with the aim of assessing, respectively, type and amount of occurring crystalline phases; NPs size and shape; Specific Surface Area and pore size distribution; band gap energy (Eg) and surface charge in water suspension.
Finally, their photocatalytic activity towards the degradation of the herbicide N‐phenylurea (NPU, Scheme 2) was studied as a test reaction both under UV and solar light (1 Sun).
Scheme 2.

The structure formula of N‐phenylurea (NPU).
NPU is a N‐containing organic compound: such type of pollutant, occurring in both wastewater and groundwater, is particularly harmful due to the presence of nitrogen, because during degradation formation of ammonium, nitrite and/or nitrate ions, which are per se pollutants, may occur.32, 33, 34 Moreover, NPU is also a micropollutant, i. e. one of those chemicals (pesticides, PPCPs, drug metabolites, caffeine, sucralose, etc.35) that are currently being discovered in the water supply (even in drinking water) at very low concentration (between few ng L−1 to μ L−1) due to more sensible detection techniques.36 Such micropollutants are also known as “contaminants of emerging concern” or simply “emerging contaminants (ECs),” since the risk posed to both human health and environment is not fully understood.
2. Results and Discussion
2.1. Physico‐Chemical Properties of the Samples
Figure 1 and Figure 2 respectively report the XRD patterns and selected TEM micrographs of the four TiO2 powders, along with those of P25, the main results of the QPA (as obtained by Rietveld refinement) being gathered in Table 1. As expected, P25 (black curve 1, Fig. 1) is a mixture of anatase (88.8 wt. %) and rutile (11.2 wt. % ), whereas the M‐TiO2 sample (blue curve 2, Fig. 1) only shows anatase‐related peaks (at 25.5 (101), 37.4 (004), 47.9 (200), 54.0 (105), 54.9 (211), 62.6 (204), 68.9 (116) 2θ values) and, accordingly, an anatase content of 100 wt. % is determined by QPA. The average size of the M‐TiO2 crystallites, as determined by XRD, is 12.4 nm (Table 1): a selected micrograph of the sample (Fig. 2b) shows indeed the occurrence of NPs with elongated shape and rather homogeneous size, at variance with P25 showing, instead, larger NPs having less regular shapes (Fig. 2a). With the RM‐TiO2 sample (green curve 3, Fig. 1), along with the peaks of anatase (at 25.2 (101), 37.8 (004), 47.9 (200), 53.8 (105), 54.9 (211), 62.6 (204), 68.7 (116) 2θ values), a weak and broad peak due to the (121) brookite diffraction is observed at about 30.7 2θ.
Figure 1.
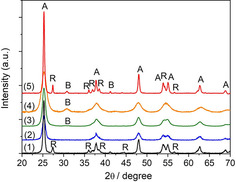
Powder XRD patterns in the 20–70 2θ range of P25 (1, black curve) and of the following samples: M‐TiO2 (2, blue curve); RM‐TiO2 (3, green curve); TF‐TiO2‐200 (4, orange curve) and TF‐TiO2‐600 (5, red curve). XRD peaks ascribed to anatase rutile and brookite are labeled as A, R and B, respectively.
Figure 2.
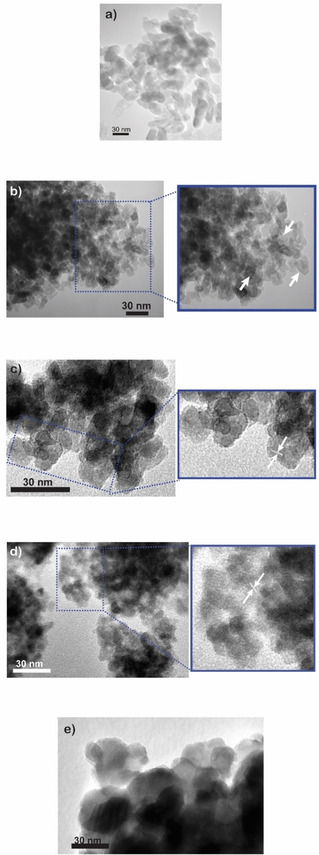
Selected TEM (Transmission Electron Microscopy) micrographs of (a) P25 and of samples (b) M‐TiO2 (arrows in the inset show the occurrence of intra‐particle mesopores, deriving from the synthesis procedure depicted in Scheme 1a); (c) RM‐TiO2 (arrows in the inset show interference fringes); (d) TF‐TiO2‐200 (arrows in the inset show interference fringes) and (e) TF‐TiO2 −600.
Table 1.
Structural and textural properties of the studied samples (as obtained by X‐Ray Diffraction and N2 isotherms at −196 °C); band‐gap energy values (as obtained by DR‐UV/Vis spectroscopy) and pH at the isoelectric point (pHIEP, as obtained by ζ‐potential measurement).
|
Sample |
Crystallite size (nm)a |
QPA results (wt %)b |
SSA (m2 g−1)c |
Band‐gap energy (Eg, eV)d,e,f |
pHIEP |
|---|---|---|---|---|---|
|
Total Pore Volume (cm3 g−1) | |||||
|
P25 |
19±3 (A) 23±4 (R) |
88.8 (A) 11.2 (R) |
74 |
3.30d |
6.2–6.9g |
|
3.03e | |||||
|
0.10 |
3.51f |
||||
|
M‐TiO2 |
12.4±1.3 (A) |
100 (A) |
150 |
3.25d |
2.37 |
|
3.15e | |||||
|
0.28 |
3.35f |
||||
|
RM‐TiO2 |
9.3±0.7 (A) 5.8±1.7 (B) |
91.1 (A) 8.9 (B) |
70 |
3.17d |
3.56 |
|
3.07e | |||||
|
0.09 |
3.29f |
||||
|
TF‐TiO2‐200 |
5.5±0.6 (A) 3.8±0.4 (B) |
78.0 (A) 22.0 (B) |
210 |
3.37d |
2.77 |
|
3.20e | |||||
|
0.31 |
3.57f |
||||
|
TF‐TiO2‐600 |
39.0±5.5 (A) 16.8±3.6 (B) 52.1±8.1 (R) |
81.6 (A) 9.3 (B) 9.1 (R) |
31 |
3.22d |
2.36 |
|
3.02e | |||||
|
0.09 |
3.36f |
a As obtained by applying the Williamson‐Hall method; b as obtained by Rietveld refinement; c as obtained by applying the BET method; d as obtained by linear extrapolation of the absorption edge; e as obtained by applying the Tauc's plot method for indirect band‐gap semiconductor (F(R)*hν)1/2; f as obtained by applying the Tauc's plot method for direct band‐gap semiconductor (F(R)*hν)2; g as reported in the literature for P25 NPs with average size in the 20–40 nm range and from ref.32
Formation of brookite in the sample is likely favored by the adopted synthesis procedure: the aqueous micro‐reactors forming in reverse micelle oil/water mixture (Scheme 1b) contain a high concentration of Ti‐precursor and, thus, of Ti4+ ions. The latter have high charge/surface ratio, leading to a high concentration of H+ ions and, thus, to an acidic environment ultimately favoring occurrence of brookite during NPs formation and growth. The QPA analysis (Table 1) shows that the occurrence of both anatase (91.1 wt. %) and brookite (8.9 wt. %). As a whole, the RM‐TASG method allows formation of a non‐negligible amount of brookite. The XRD‐determined anatase crystallite size (9.3±0.7 nm, Table 1) was very close to the NPs size (ca. 12 nm), as shown by a selected TEM micrograph reported in Fig. 2c, where crystalline planes can be appreciated in the inset. As a whole, the RM‐TiO2 sample shows highly agglomerated/aggregated NPs29 that are likely monocrystalline ones, as their average size is close to the crystallites size. It must be pointed out that NPs morphology (shape and size) is a crucial point in photocatalytic applications, as it can affect also the type of porosity, whereas NPs aggregation may lower the overall photocatalytic performance (vide infra).
The TF‐TiO2‐200 sample (orange curve 4, Fig. 1) showed diffraction peaks of both anatase (78.0 wt. %) and brookite (22.0 wt.%), the former having a smaller crystallite size (5.5±0.6 nm, Table 1) than in both M‐TiO2 and RM‐TiO2 samples. The TEM analysis of the TF‐TiO2‐200 sample shows aggregated/agglomerated NPs of variable shape and size (Fig. 2d).
As shown by the TF‐TiO2‐600 XRD pattern and the related QPA results (Table 1), the higher temperature treatment brought about a remarkable change of phase composition and crystallite size in the TF‐TiO2‐600 sample: in particular, the amount of brookite decreased, while some rutile formed, in agreement with Hu et al.,37 showing that the presence of brookite itself may favor transition to rutile in mixed anatase/brookite NPs synthesized in acid medium. Simultaneously, a larger crystallite size (with respect to the TF‐TiO2‐200 sample) was determined (Table 1), in agreement with the literature, showing that brookite to rutile transition at 600 °C is accompanied by a crystallite size increase.27
Correspondingly, Fig. 2e shows occurrence of larger NPs (with respect to TF‐TiO2‐200) and of clearly visible interference fringes, the assignment of which, however, was not straightforward. Indeed, the following UV/Vis spectroscopy and photocatalytic results will help gaining a further insight into the mixed phase nature (see below). Occurrence of larger particles should also affect the sample surface area, as shown in Table 1 and in the following discussion.
Figure 3 reports the N2 adsorption/desorption isotherms measured at −196 °C on the four synthesized samples. The M‐TiO2 sample showed a type IV isotherm (Fig. 3a, blue circles) and the likely occurrence of both intra‐ and inter‐particle mesopores, the corresponding value of SSA (Table 1) being more than twice that of P25. In agreement with the literature, P25 showed a type II isotherm (not reported for the sake of brevity), with N2 condensation at high relative pressure (i. e. P/P0 >0.85), due to the presence of some inter‐particle meso/macropores. With M‐TiO2, the observed H2 type hysteresis loop is typical of inkbottle inter‐particle mesopores: the corresponding Pore Size Distribution (PSD, Fig. 3c) shows the presence of mesopores with heterogeneous dimension, the most abundant ones having a diameter of 7.5 nm, whereas the observed smaller mesopores (Fig. 3c, blue circles) are likely intra‐particle mesopores, also observable by TEM (arrows in Fig. 2b).
Figure 3.
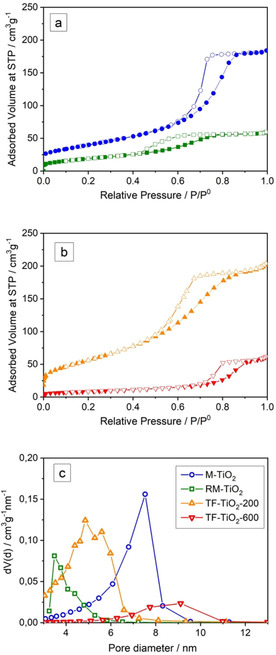
Section a: N2 adsorption/desorption isotherms measured at −196 °C on the samples M‐TiO2 (blue circles) and RM‐TiO2 (green squares). Section b: N2 adsorption/desorption isotherms measured at −196 °C on the samples TF‐TiO2‐200 (orange triangles) and TF‐TiO2‐600 (red triangles). Full symbols: adsorption isotherm; empty symbols: desorption isotherm. Section c: PSD as obtained by applying the BJH method to isotherms desorption branch with the samples: M‐TiO2 (blue circles), RM‐TiO2 (green squares); TF‐TiO2‐200 (orange triangles); TF‐TiO2‐600 (red triangles).
Concerning TiO2 porosity, calcination is a crucial step: whilst on the one side it allows removing the organic template, simultaneously inducing crystallization, on the other side, it may bring about some structure collapse, with consequent loss of SSA.
Due to such concurrent processes, M‐TiO2 mostly shows inter‐particle mesopores (in agreement with the NPs size), stemming from the template removal and the (consequent) pores shrinkage, as it often occurs with TiO2 mesostructures, for which thermal stability during calcination is an issue.16 All this notwithstanding, the M‐TiO2 sample also showed some (residual and) smaller intra‐particle mesopores, as it can be appreciated in the inset to Figure 2b (arrows). The RM‐TiO2 sample showed a type IV isotherm with H2 type hysteresis loop (Fig. 3a) ascribed to capillary condensation within inter‐particle mesoporosity, but a lower SSA area (71 m2 g−1, Table 1), the corresponding PSD (Fig. 3c) showing a maximum at 3.5 nm and a tail towards larger diameter mesopores. Within the set of samples studied in this paper, the TF‐TiO2‐200 sample showed the highest SSA, likely due to the low temperature adopted during the thermal treatment. The N2 isotherms measured with both TF‐TiO2‐200 and TF‐TiO2‐600 samples are compared in Fig. 3b: type IV isotherms with H2 hysteresis loops are observed, but smaller adsorbed volume and SSA are measured with the TF‐TiO2‐600 sample, which also showed occurrence of larger NPs (Fig. 2e) and larger crystallites (Table 1).
Figure 3c reports the Pore Size Distributions (PSD) as obtained by applying the BJH method to the isotherms desorption branch: all the synthesized samples showed occurrence of mesopores. The RM‐TiO2 sample showed a rather sharp PSD and the smallest mesopores diameter. The M‐TiO2 sample showed an asymmetric PSD curve, with maximum at 7.5 nm and a large pore volume (Table 1). Comparison between samples TF‐TiO2‐200 and TF‐TiO2‐600 shows that by increasing the calcination temperature the pore volume decreases and only few larger mesopores are observed with the TF‐TiO2‐600 sample. Such phenomena are in agreement with the largest particle size observed by TEM analysis in the TF‐TiO2‐600 sample (Fig. 2e) with respect to the TF‐TiO2‐200 sample (Fig. 2d).
Such changes in the structural and textural properties of the samples could also affect their UV/Vis absorption properties and, thus, the photocatalytic performance: Figure 4 reports the DR‐UV/Vis spectra of the synthesized samples, along with that of P25. With the exception of the TF‐TiO2‐200 sample, all the studied powders absorb in a slightly broader range of wavelengths with respect to P25 (onset at 375 nm), with corresponding onset of absorption at 382 nm (M‐TiO2), 390 nm (RM‐TiO2), 368 nm (TF‐TiO2‐200) and 385 nm (TF‐TiO2‐600). For clarity, Table 1 reports the corresponding values of Eg, as calculated according to three different methods, in order to take into account the occurrence of mixed phases, which can be considered either indirect band or direct band gap semiconductors (with the exception of M‐TiO2 sample, which is 100 % anatase). As expected, the Eg values calculated by the Tauc's plot method for indirect transition ((F(R)*hν)1/2) are closer to values obtained by linear extrapolation of the onset of absorption than to (much higher) values obtained by using the equation for direct transition ((F(R)*hν)2).38
Figure 4.
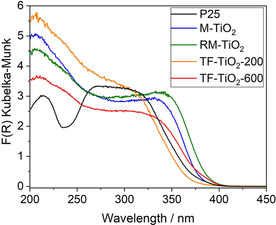
DR‐UV/Vis spectra in the 200–800 nm range of the following powders under vacuum: P25 (black curve); M‐TiO2 (blue curve); RM‐TiO2 (green curve); B‐TiO2‐200 (orange curve) and B‐TiO2‐600 (red curve).
Notwithstanding the approximations made, the values obtained by the first two methods allow drawing some qualitative considerations on the studied set of samples. With TF‐TiO2‐200, the presence of ca. 22 wt. % brookite, besides anatase (Table 1), brings about an increase of the Eg value with respect the other samples, in agreement with the literature, which reports higher Eg values for brookite (3.26–3.50 eV), with respect to both anatase (3.08–3.35 eV) and rutile (3.05 eV).39, 40, 41
It must be pointed out, however, that, as reported in the Introduction, especially under UV illumination, the band‐gap value is not the only factor affecting the photocatalytic activity (see below), since the lifetime of the e−/h+ pairs is a crucial issue, which also depends on the occurrence of mixed phases/heterojunctions.
Figure 5 reports the ζ‐potential curves measured with the synthesized samples: notoriously, Ti‐OH groups at the surface of TiO2 have an amphoteric behavior, being protonated and deprotonated below and above the pHIEP, respectively. Such a behavior may affect the interaction with species in solution, like in this work, as NPU has a pKa equal to 13.37.42 As a whole, the four samples show a lower point of zero charge (isoelectric point, pHIEP) than that usually reported for P25 NPs with average size in the 20–40 nm range43 and for pure anatase NPs with average size in the 7.0–20 nm range.44 According to Biswas et al.,44 both primary particle size and surface area affect the charge of TiO2 NPs obtained by sol‐gel methods, whereas the type of crystalline phase should not. In contrast, other authors45 measured different pHIEP with brookite, anatase and rutile samples obtained by hydrothermal treatment (in the order pHIEPbrookite < pHIEPanatase < pHIEPrutile), with brookite showing stronger Brønsted sites; the same authors also measured slightly lower pHIEP with more crystallized solids. Other authors pointed out that the type of synthesis plays a prominent role on the TiO2 surface properties.46, 47 Holmberg et al.43 predicted that TiO2 NPs with a diameter below 10 nm have a higher surface charge with respect to larger NPs and, thus, the pHIEP should increase as the NPs size decreases. Based on this considerations, the highest pHIEP of the RM‐TiO2 sample could be due to the adopted synthesis, allowing NPs nucleation and growth within reverse micelles, but followed by a calcination procedure inducing agglomeration of the original NPs (ca. 12 nm large)29 and which, according to Li et al.45 could be characterized by a brookite‐poor surface. Accordingly, the lowest pHIEP of the TF‐TiO2‐600 sample could be due to both larger particle size and a brookite‐rich surface, the “intermediate” values measured with M‐TiO2 and TF‐TiO2‐200 being ascribable with their NPs size and phase composition, as obtained by different synthesis methods. As a whole, however, very different pHIEP values are reported in the literature for TiO2 samples and very different explanations are provided (particle size, synthesis method, polymorph, etc.): therefore, the here reported results simply allow a comparison among samples measured in the same experimental conditions to assess the possible kind of interaction taking place with NPU molecules (vide infra).
Figure 5.
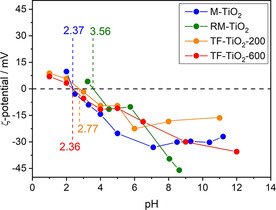
ζ‐potential curves as obtained with the samples M‐TiO2 (blue circles); RM‐TiO2 (green squares); TF‐TiO2‐200 (orange triangles) and TF‐TiO2‐600 (red triangles). The values of pHIEP are also reported
2.2. Photocatalytic Degradation of the Emerging Contaminant N‐Phenylurea
Figures 6a and 6b report the UV/Vis spectra of the supernatant solution as obtained in the presence of the samples after 4 h illumination under UV light and 1 Sun, respectively. Also reported is the UV/Vis spectrum of the starting NPU solution (dotted curve), showing two main bands (at 199 nm and 235 nm) and third weak band at about 270 nm (not appreciable at such low concentration): the three absorptions are typical of substituted benzene rings,48, 49, 50 their different intensities being due to different absorption coefficients. Concerning surface phenomena likely occurring in the studied (NPU‐water‐TiO2) system, the starting NPU solution had pH=5.7, whereas all the studied samples have a much lower pHIEP, their surface being negatively charged at the starting pH. Although strong NPU‐TiO2 surface electrostatic interactions should be excluded, other types of (van der Waals) forces are expected to occur at the NPs surface. In the present case, such interactions were likely weak, since no sizeable NPU adsorption was detected in “dark conditions”, i. e. during the system conditioning before illumination, in that the UV/Vis intensity of NPU bands did not decrease upon contact with the photocatalyst (spectra not shown for the sake of brevity).
Figure 6.
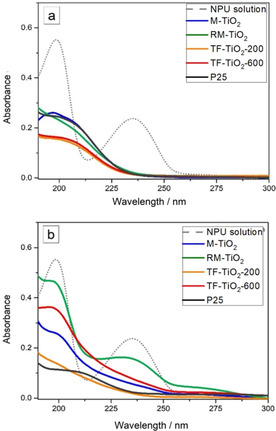
UV spectra (190‐300 nm range) of the supernatant solutions concerning the photocatalytic degradation of NPU after 4 h illumination under UV light (a) and 1 Sun (b) in the presence of 1 g L−1 P25 (black curve); M‐TiO2 sample (blue curve); RM‐TiO2 sample (green curve); TF‐TiO2‐200 sample (orange curve) and TF‐TiO2‐600 sample (red curve).
After 4 h under UV light (Fig. 6a), the band at 235 nm markedly decreases with all the samples: −NH2 substituted benzene rings usually absorb close to 230 nm and, thus, disappearance of the 235 nm band may indicate some degradation processes concerning the —NHCONH2 group. Simultaneously, a new band is seen to appear at 213 nm, likely due to formation of some hydroxylated compounds, as expected during photodegradation in water, implying the occurrence of ⋅OH radicals, which are strong oxidizing species able to attack benzene rings (phenol absorbs at 210 nm).51, 52 Unfortunately, the adopted UV/Vis spectroscopy technique does not allow gaining further insights into the degradation mechanism, which is, by the way, out of the scope of this paper. However, after 4 h under UV light (Fig. 6a), both the 199 nm and the 213 nm bands were less intense in the presence of the TF‐TiO2‐200 and TF‐TiO2‐600 samples, indicating that with the two samples also the degradation of hydroxylated products occurs in a more efficient way. Such a result is encouraging, especially by considering the low SSA and the large NPs size of the TF‐TiO2‐600 samples: likely, the presence of mixed phases plays a prominent role in the photocatalytic activity of the sample, especially as compared to TF‐TiO2‐200, which is characterized by a higher SSA. As compared to the RM‐TiO2 sample, itself characterized by occurrence of a similar brookite content, the TF‐TiO2‐600 sample is more efficient, in the adopted experimental conditions, likely due to a more favorable phases interconnection and/or to the presence of a brookite‐rich surface, as hypothesized while discussing the ζ‐potential value, which could favor degradation of NPU (vide infra, Scheme 3). Such a difference could be due to the adopted synthesis, which allows formation of larger amount of brookite by simple pH control: brookite, in turn, favors transition to rutile during calcination at 600 °C, finally providing a mixed‐phase TiO2 able to efficiently stabilize the photogenerated e−/h+ pairs, as occurs in P25.19
Scheme 3.
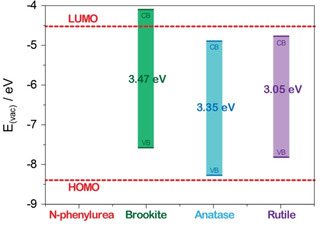
Position of the calculated VB and CB of pure brookite, anatase and rutile TiO2 polymorphs.54 The calculated HOMO and LUMO values of NPU are reported for the sake of completeness.55
Figure 6b reports the UV/Vis spectra of the NPU supernatant solutions as obtained after 4 h illumination under 1 Sun: in such conditions, the band at 235 nm is almost completely depleted in the order: TF‐TiO2‐200≅P25 > M‐TiO2 > TF‐TiO2‐600 ≫ RM‐TiO2. As expected, P25 shows good photocatalytic activity also under 1 Sun, whereas the RM‐TiO2 sample is the least active one, notwithstanding its lower band‐gap (Table 1) and the SSA value (comparable to that of P25). We tentatively ascribe the lower activity of RM‐TiO2 to its morphology: its NPs, though small, are very agglomerated/aggregated,53 finally providing a smaller accessible area. Indeed, SSA values measured by N2(g) adsorption on a solid surface can be not fully representative of the actually available surface in a liquid/solid system and, therefore, NPs aggregation/agglomeration may hamper relevant mass transfer phenomena occurring in liquid phase. Conversely, P25 is a finely dispersed material, finally providing a larger accessible area: this is a crucial point, because if powders having different dispersibility in water are tested, same amounts of photocatalyst (in mass or normalized to SSA) may provide markedly different photocatalytic performance, finally hampering any reliable comparison. Interestingly, under 1 Sun, the TF‐TiO2‐200 sample is as active as P25, the former sample being characterized by a large brookite content and a high SSA value, both factors positively affecting its photocatalytic activity. Although further studies are required, a simplified picture of the phenomenon that can support this hypothesis is reported in Scheme 3, where calculated (literature) values of the valence and conduction band (VB, CB) positions54 are reported for the three (brookite, anatase and rutile) TiO2 polymorphs, along with calculated values of the NPU HOMO (highest occupied molecular orbital) and LUMO (lowest unoccupied molecular orbital) levels as reported in the literature.55
Based on such literature values, it turns out that the position of the CB of brookite can help NPU reduction, whereas the position of the VB of anatase is very close, but not superposed, to the NPU HOMO, although it must be pointed out the calculated values are reported in the Scheme, whereas, for instance, different Eg values may be experimentally obtained, also by varying NPs size. As a whole, the reported photocatalytic results obtained with the TF‐TiO2‐200 sample can be explained by the occurrence of efficient anatase/brookite heterojunctions, which have been shown to favor separation of photogenerated e−/h+ pairs,26 and allowing a more efficient exploitation of the UV fraction of the solar spectrum. With the TF‐TiO2‐600 sample, instead, larger NPs size and smaller surface area likely decrease its efficiency under solar light, whereas the photocatalytic activity under UV light is still satisfactory. Although we aware that it is a simplified picture of an extremely complex system, Scheme 3 supports the idea that the presence of brookite could enhance exploitation of the UV fraction of the solar spectrum and the e−/h+ pairs lifetime, provided that an optimal interconnection of the mixed phases occurs. Such a phenomenon surely requires further physico‐chemical insights, as already done for the P25 anatase/rutile mixture, for instance. Here, the interesting points are that the photocatalytic activity under solar light may be enhanced in brookite‐containing mixed phases obtained by a (green) template‐free method and mild calcination temperature, thus ruling out the need of a single polymorph phase, easily obtained with anatase, but hardly attainable with brookite and implying low surface area with rutile, and that, by this way, a N‐containing emerging contaminant like NPU may undergo degradation also under solar light.
3. Conclusions
Three different types of sol‐gel synthesis were adopted to produce four samples of TiO2 NPs differing in their phase composition, surface area, morphology and aggregation. Such properties were shown to affect the NPs photocatalytic performance towards the degradation of the N‐containing emerging contaminant N‐phenylurea, under either UV light or simulated solar light (1 Sun). The N‐phenylurea degradation (especially under solar light) was positively affected by the presence of brookite, particularly with a sample obtained by a template free sol‐gel synthesis implying acidic pH conditions and without any template. This result is sound, in that photocatalytically active mixed TiO2 phases can be obtained by pH adjustment, without the need of organic templates, which, in turn, require combustion processes to be removed. Moreover, the sample obtained by the same procedure, but treated at higher temperature (600 °C) and, thus, characterized by low surface area (ca. 30 m2 g−1), was still photocatalytically active, showing that the surface area is not a major parameter regulating photocatalytic activity, whereas mixed phases do, likely when they are closely interconnected and, thus, able to stabilize photogenerated e−/h+ pairs.
Experimental Section
Materials
All the reagents used for the syntheses where ACS grade chemicals from Sigma‐Aldrich, whereas a commercial sample of Degussa P25 (hereafter referred to as P25) was used as reference. The TiO2 NPs obtained by micelle template assisted sol‐gel (M‐TASG) method in the presence of tri‐block copolymer micelles (M‐TiO2) were synthesised as follows: two solutions were prepared, A and B. Solution A was obtained by drop‐wise adding 5.0 g Ti(OC(CH3)3)4 (titanium(IV) tert‐butoxide, 97 %) to 30.0 mL acetic acid solution (20 %, v/v) and vigorously stirring for about 4 h; solution B was obtained by mixing 3.0 g Pluronic P123 and ca. 20.0 mL ethanol. Solution B was dropwise added to solution A and, then, the resulting mixture was sealed, stirred for 24 h at room temperature (r.t.) and transferred into a Teflon autoclave for hydrothermal treatment at 85 °C for 48 h. The resulting precipitate was centrifuged, dried at 80 °C and calcined in air at 450 °C for 4 h.30, 56
The TiO2 NPs obtained by reverse‐micelle TASG method (RM‐TiO2) were synthesised as follows:29, 57 the di‐block copolymer (polyoxyethylene (20) oleyl ether (commercial name: Brij O20) was dispersed in cyclohexane (the oil phase) by stirring at 50 °C. Afterwards, MilliQ water was added to the mixture and stirred for 45 min, leading to the formation of a water in oil (w/o) microemulsion of surfactant‐encapsulated aqueous nanoreactors. Ti(O(CH2)3CH3)4 (titanium(IV) butoxide, 98 %) was then dropwise added to the emulsion. The mixture was stirred for 2 h at the constant temperature of 50 °C and, finally, the emulsion was broken by addition of 2‐propanol, followed by sonication. The solid was collected by centrifugation and dried at 100 °C for 24 h, followed by 2 h calcination in air at 500 °C (temperature ramp=2.5 °C min−1) to remove the surfactant.
The TiO2 NPs obtained by template free sol gel (TF‐SG) method in acid conditions to favour brookite formation (TF‐TiO2) were synthesised by slightly modifying the method developed by Mutuma et al.31 In a typical preparation, 30.0 ml titanium isopropoxide (Ti(OPr)4) was mixed to 30.0 ml isopropyl alcohol and stirred (at 500 rpm) for 20 min in a 150 mL beaker; bi‐distilled water (300 mL) was added to the mixture under vigorous stirring. The obtained mixture was heated at 80 °C in a stove for 5 h and, then, cooled down to r.t. After cooling, pH was varied by addition of 1.0 M HNO3 solution, in order to obtain a pH equal to 2.0. The sol was stirred for 20 h in order to obtain a gel, which was repeatedly washed with bi‐distilled water, centrifuged for 12 min at 4000 rpm and dried for 12 h in a Teflon autoclave inside a stove kept at 100 °C. Afterwards, the sample was separated in two aliquots and treated at either 200 °C (TF‐TiO2‐200) or 600 °C (TF‐TiO2‐600) for 2 h (temperature ramp=5 °C min−1) before cooling down to r.t. (temperature ramp=5 °C min‐1). Before use, both the TF‐TiO2‐200 and TF‐TiO2‐600 powders were washed with an ethanol/water (1/3) mixture for four times, centrifuged for 10 min at 8000 rpm and dried for 24 h at 60 °C.
Characterization Methods
Powders X‐ray diffraction patterns were collected on a X'Pert Philips PW3040 diffractometer using Cu Kα radiation (2θ range=20°–70°; step=0.026° 2θ; time per step=0.8 s) and were indexed by making reference to the Powder Data File database (PDF 2000, International Centre of Diffraction Data, Pennsylvania). Crystallites average size (D) was determined by using the Williamson‐Hall plot calculated by the X'Pert High Score Plus 3.0e software, where λ is the wavelength of the Cu Kα radiation, b is the full width at half maximum (in radians), and θ is the angle of diffraction peak. The phase content (QPA, Quantitative Phase Analysis) was evaluated by the full‐profile Rietveld method applied to the diffraction patterns by using the X'Pert High Score Plus 3.0e software. Transmission electron microscopy (TEM) analysis was carried out on a JEOL 3010‐UHR instrument operating at 300 kV and a FEI‐TECNAI instrument operating at 120 kV, both equipped with LaB6 filaments. To obtain a good dispersion, the powders were either briefly contacted with lacey carbon Cu grids (resulting in the mere electrostatic adhesion of some particles to the sample holder), or pre‐dispersed in ethanol and, then, dropped on carbon Cu grids. N2 adsorption/desorption isotherms were measured at −196 °C (Micromeritics ASAP 2020Plus) on powders outgassed at 150 °C for 4 h to remove water and other atmospheric contaminants. The Specific Surface Area (SSA) was determined according to the Brunauer‐Emmett‐Teller (BET) method and the Pore Size Distribution (PSD) was calculated by applying the BJH (Barrett‐Joyner‐Halenda) method to the isotherm desorption branch. Diffuse Reflectance (DR) UV/Vis spectra of powder samples were measured on a Cary 5000 UV/Vis‐NIR spectrophotometer (Varian instruments) equipped with a DR sphere. ζ‐potential curves of the TiO2 NPs were obtained by measuring the electrophoretic mobility as a function of pH by means of electrophoretic light scattering (ELS) on a Zetasizer Nano‐ZS (Malvern Instruments, Worcestershire, UK). In a typical measurement, the powder was suspended in ultrapure water (MilliQ) and either sonicated for 2 min (10 W/ml, 20 kHz, Sonoplus, Bandelin, Berlin, Germany) or magnetically stirred for 5 min. The ζ‐potential was measured at r.t. after adjusting the pH gradually by addition of either 0.1 M NaOH or 0.1 M HCl.
Photocatalytic Tests
Photocatalytic tests were carried out by adding an amount of catalyst corresponding to 1.0 g L−1 concentration to 50 mL of 0.01 mM aqueous solution (natural pH=5.7) of N‐phenylurea (NPU, 97 % Sigma‐Aldrich).
A first set of experiments was carried out with the NPU solution under UV light, by illuminating with a medium‐pressure Hg lamp (light intensity of 55 mW cm−2, LC3, Hamamatsu Photonic, Hamamatsu, Japan). A second set of experiments was performed with the NPU solution under simulated solar light (AM 1.5 G, 100 mW cm−2), as obtained by means of a plasma lamp (LIFI STA‐40, LUXIM, Santa Clara, CA, USA). The following illumination conditions were adopted: 1 Sun, i. e. ∼1000 W m−2 in the visible range and ∼22 W m−2 in the UV range (corresponding to ca. 4 % of the power of the UV lamp used in the first set of experiments). During the tests, the liquid/solid suspension was continuously stirred by means of a magnetic stirrer, operated at ca. 300 rpm. Since the reaction mixture was not de‐aerated, atmospheric O2 was always present. Several aliquots of the suspension were collected at regular intervals of time. The supernatant fraction was separated by centrifugation at 12000 rpm for 10 min (Thermo Fisher) and for more volatile powders, such as P25, was further filtrated with 0.45 μm Whatman Regenerated Cellulose syringe filters. UV/Vis spectra of the supernatant solutions in the 190–800 nm range were measured by means of a Cary 5000 UV/Vis‐NIR spectrophotometer (Varian Instruments, Mulgrave, Australia), using a quartz cell with 10 mm path length.
Conflict of interest
The authors declare no conflict of interest.
Acknowledgements
Financial support from Fondazione Cariplo through the measure ‘‘Ricerca sull'inquinamento dell'acqua e per una corretta gestione idrica’’, Grant no. 2015‐0186, is acknowledged. The authors thank Profs. Gianfranco Dell'Agli (Università di Cassino e del Lazio Meridionale, Italy) for fruitful discussion about Rietveld refinement of the studied samples and Prof. Marco Sangermano, Simelys Hernandez and Tiziana Tosco (Politecnico di Torino, Italy) for lending the UV lamp, the simulated solar spectrum lamp and the ζ‐potential measure instrument, respectively.
F. S. Freyria, N. Blangetti, S. Esposito, R. Nasi, M. Armandi, V. Annelio, B. Bonelli, ChemistryOpen 2020, 9, 903.
References
- 1. Sohn Y., Huang W., Taghipour F., Appl. Surf. Sci. 2017, 396, 1696–1711. [Google Scholar]
- 2. Ma Y., Wang X., Jia Y., Chen X., Han H., Li C., Chem. Rev. 2014, 114, 9987–10043. [DOI] [PubMed] [Google Scholar]
- 3. Bonelli B., Cozzolino M., Tesser R., Di Serio M., Piumetti M., Garrone E., Santacesaria E., J. Catal. 2007, 246, DOI 10.1016/j.jcat.2006.12.015. [Google Scholar]
- 4. Chen X., Mao S. S., Chem. Rev. 2007, 107, 2891–2959. [DOI] [PubMed] [Google Scholar]
- 5. Sang L., Zhao Y., Burda C., Chem. Rev. 2014, 114, 9283–9318. [DOI] [PubMed] [Google Scholar]
- 6. Zhang H., Banfield J. F., Chem. Rev. 2014, 114, 9613–9644. [DOI] [PubMed] [Google Scholar]
- 7. Di Paola A., Bellardita M., Palmisano L., Brookite, the Least Known TiO2 Photocatalyst, 2013. [Google Scholar]
- 8. Schneider J., Matsuoka M., Takeuchi M., Zhang J., Horiuchi Y., Anpo M., Bahnemann D. W., Chem. Rev. 2014, 114, 9919–9986. [DOI] [PubMed] [Google Scholar]
- 9. Ozawa K., Emori M., Yamamoto S., Yukawa R., Yamamoto S., Hobara R., Fujikawa K., Sakama H., Matsuda I., J. Phys. Chem. Lett. 2014, 5, 1953–1957. [DOI] [PubMed] [Google Scholar]
- 10. Hossain M. A., Elias M., Sarker D. R., Diba Z. R., Mithun J. M., Azad M. A. K., Siddiquey I. A., Rahman M. M., Uddin J., Uddin M. N., Res. Chem. Intermed. 2018, 44, 2667–2683. [Google Scholar]
- 11. Guayaquil-Sosa J. F., Serrano-Rosales B., Valadés-Pelayo P. J., de Lasa H., Appl. Catal. B 2017, 211, 337–348. [Google Scholar]
- 12. Lavorato C., Argurio P., Mastropietro T. F., Pirri G., Poerio T., Molinari R., J. Catal. 2017, 353, 152–161. [Google Scholar]
- 13. Fang J., Wang F., Qian K., Bao H., Jiang Z., Huang W., J. Phys. Chem. C 2008, 112, 18150–18156. [Google Scholar]
- 14. Liu Y., Ye Z., Li D., Wang M., Zhang Y., Huang W., Appl. Surf. Sci. 2019, 473, 500–510. [Google Scholar]
- 15. Liu Y., Wang Z., Huang W., Appl. Surf. Sci. 2016, 389, 760–767. [Google Scholar]
- 16.B. Bonelli, S. Esposito, F. S. Freyria, in Titan. Dioxide (Ed.: Magdalena Janus), Intech, 2017.
- 17. Navrotsky A., Geochem. Trans. 2003, 4, 34–37. [DOI] [PMC free article] [PubMed] [Google Scholar]
- 18. Zhang J., Zhou P., Liu J., Yu J., Phys. Chem. Chem. Phys. 2014, 16, 20382–20386. [DOI] [PubMed] [Google Scholar]
- 19. Vequizo J. J. M., Matsunaga H., Ishiku T., Kamimura S., Ohno T., Yamakata A., ACS Catal. 2017, 7, 2644–2651. [Google Scholar]
- 20. Monai M., Montini T., Fornasiero P., Catalysts 2017, 7, 304. [Google Scholar]
- 21. Hezam M., Qaid S. M. H., Bedja I. M., Alharbi F., Nazeeruddin M. K., Aldwayyan A., Crystals 2019, 9, 1–8. [Google Scholar]
- 22. Wang Q., Ren H., Zhao Y., Xia X., Huang F., Cui G., Dong B., Tang B., J. Mater. Chem. A 2019, 7, 14613–14619. [Google Scholar]
- 23.T. Overview, n.d.
- 24.D. C. Hurum, A. G. Agrios, K. A. Gray, T. Rajh, M. C. Thurnauer, J. Phys. Chem. B 2003, 4545–4549.
- 25. Kapilashrami M., Zhang Y., Liu Y.-S., Hagfeldt A., Guo J., Chem. Rev. 2014, 114, 9662–9707. [DOI] [PubMed] [Google Scholar]
- 26. Ismail A. A., Kandiel T. A., Bahnemann D. W., J. Photochem. Photobiol. A 2010, 216, 183–193. [Google Scholar]
- 27. Balaganapathi T., KaniAmuthan B., Vinoth S., Thilakan P., Mater. Res. Bull. 2017, 91, 114–121. [Google Scholar]
- 28. Boppella R., Basak P., Manorama S. V., ACS Appl. Mater. Interfaces 2012, 4, 1239–1246. [DOI] [PubMed] [Google Scholar]
- 29. Nasi R., Esposito S., Freyria F. S., Armandi M., Gadhi T. A., Hernandez S., Rivolo P., Ditaranto N., Bonelli B., Materials 2019, 12, 937. [DOI] [PMC free article] [PubMed] [Google Scholar]
- 30. Freyria F. S., Compagnoni M., Ditaranto N., Rossetti I., Piumetti M., Ramis G., Bonelli B., Catalysts 2017, 7, DOI 10.3390/catal7070213. [Google Scholar]
- 31. Mutuma B. K., Shao G. N., Duck W., Taik H., J. Colloid Interface Sci. 2015, 442, 1–7. [DOI] [PubMed] [Google Scholar]
- 32. Compagnoni M., Ramis G., Freyria F. S., Armandi M., Bonelli B., Rossetti I., J. Nanosci. Nanotechnol. 2017, 17, DOI 10.1166/jnn.2017.14006. [Google Scholar]
- 33. Freyria F. S., Armandi M., Compagnoni M., Ramis G., Rossetti I., Bonelli B., J. Nanosci. Nanotechnol. 2017, 17, DOI 10.1166/jnn.2017.14014. [Google Scholar]
- 34. Piumetti M., Freyria F. S., Armandi M., Geobaldo F., Garrone E., Bonelli B., Catal. Today 2014, 227, 71–79. [Google Scholar]
- 35. Richardson S. D., Ternes T. A., Anal. Chem. 2011, 4614–4648. [DOI] [PubMed] [Google Scholar]
- 36. Freyria F. S., Geobaldo F., Bonelli B., Appl. Sci. 2018, 8, 170. [Google Scholar]
- 37. Hu Y., Tsai H. L., Huang C. L., J. Eur. Ceram. Soc. 2003, 23, 691–696. [Google Scholar]
- 38. López R., Gómez R., J. Sol-Gel Sci. Technol. 2012, 61, 1–7. [Google Scholar]
- 39.L. Kavan, M. Grätzel, S. E. Gilbert, C. Klemenz, H. J. Scheel, 1996, DOI 10.1021/JA954172 L.
- 40. Reyes-Coronado D., Rodríguez-Gattorno G., Espinosa-Pesqueira M. E., Cab C., De Coss R., Oskam G., Nanotechnology 2008, 19, 145605. [DOI] [PubMed] [Google Scholar]
- 41. Asahi R., Taga Y., Mannstadt W., Phys. Rev. B 2000, 61, 7459–7465. [Google Scholar]
- 42.E. B. I. (EMBL-EBI), “ChEMBL: Compound Report Card,” can be found under https://www.ebi.ac.uk/chembl/compound_report_card/CHEMBL168445/, n.d.
- 43. Holmberg J. P., Ahlberg E., Bergenholtz J., Hassellöv M., Abbas Z., J. Colloid Interface Sci. 2013, 407, 168–176. [DOI] [PubMed] [Google Scholar]
- 44. Biswas P., Sahu M., Charinpanitkul T., Jiang J., Suttiponparnit K., Suvachittanont S., Nanoscale Res. Lett. 2010, 1–8. [DOI] [PMC free article] [PubMed] [Google Scholar]
- 45. Li H., Vrinat M., Berhault G., Li D., Nie H., Afanasiev P., Mater. Res. Bull. 2013, 48, 3374–3382. [Google Scholar]
- 46. Azeez F., Al-Hetlani E., Arafa M., Abdelmonem Y., Nazeer A. A., Amin M. O., Madkour M., Sci. Rep. 2018, 8, 7104. [DOI] [PMC free article] [PubMed] [Google Scholar]
- 47. Liao D. L., Wu G. S., Liao B. Q., Colloids Surf. A 2009, 348, 270–275. [Google Scholar]
- 48. Burgess O. T. C., Uv-Visible Spectrophotometry of Water and Wastewater, Elsevier, 2013. [Google Scholar]
- 49. Jordan L. S., Coggins C. W., Day B. E., Clerx W. A., Weeds 2007, DOI 10.2307/4040624. [Google Scholar]
- 50. Taniguchi M., Lindsey J. S., Photochem. Photobiol. 2018, 94, 290–327. [DOI] [PubMed] [Google Scholar]
- 51. Farkas J., Náfrádi M., Hlogyik T., Cora Pravda B., Schrantz K., Hernádi K., Alapi T., Environ. Sci. Water Res. Technol. 2018, 4, 1345–1360. [Google Scholar]
- 52. Freyria F. S., Compagnoni M., Ditaranto N., Rossetti I., Piumetti M., Ramis G., Bonelli B., Catalysts 2017, 7, DOI 10.3390/catal7070213. [Google Scholar]
- 53.Nasi, S. Esposito, F. S. Freyria, M. Armandi, T. A. Gadhi, S. Hernandez, P. Rivolo, N. Ditaranto, B. Bonelli, n.d., DOI 10.3390/ma12060937. [DOI] [PMC free article] [PubMed]
- 54. Buckeridge J., Butler K. T., Catlow C. R. A., Logsdail A. J., Scanlon D. O., Shevlin S. A., Woodley S. M., Sokol A. A., Walsh A., Chem. Mater. 2015, 27, 3844–3851. [Google Scholar]
- 55. Varghese H. T., Bhagysree J. B., Ulahannan R. T., Renjith R., Panicker C. Y., Orient. J. Chem. 2013, 29, 361–367. [Google Scholar]
- 56. Piumetti M., Freyria F. S., Armandi M., Geobaldo F., Garrone E., Bonelli B., Catal. Today 2014, 227, DOI 10.1016/j.cattod.2013.11.013. [Google Scholar]
- 57. Chandra P., Doke D. S., Umbarkar S. B., Biradar A. V., J. Mater. Chem. A 2014, 2, 19060–19066. [Google Scholar]


