Figure 6.
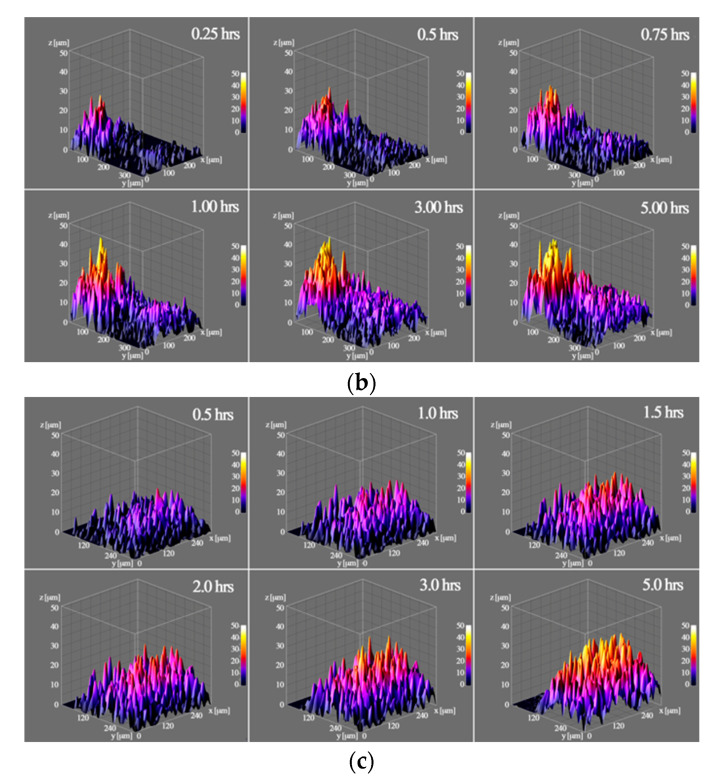
3D surfaces of the thicknesses extracted from the acquired and processed data. (a) The 3D surface on the left is related to the thickness of the cartilage cell structure computed from the CARS signal, in the center, the 3D surface is related to thickness of the collagen and thus the ECM from the SHG signal, while on the right the 3D surface is related to the EV penetration depths in the cartilage after 5 h from the TPEF signal; (b) the 3D surfaces show the dynamic of the EV penetration in the cartilage during the time-lapse; in the top right corner of each image the related timeframe is depicted; (c) the 3D surfaces show the dynamic of the EV penetration in the chondrocytes micromass during the time-lapse, in the top right corner of each image the related timeframe is depicted.


