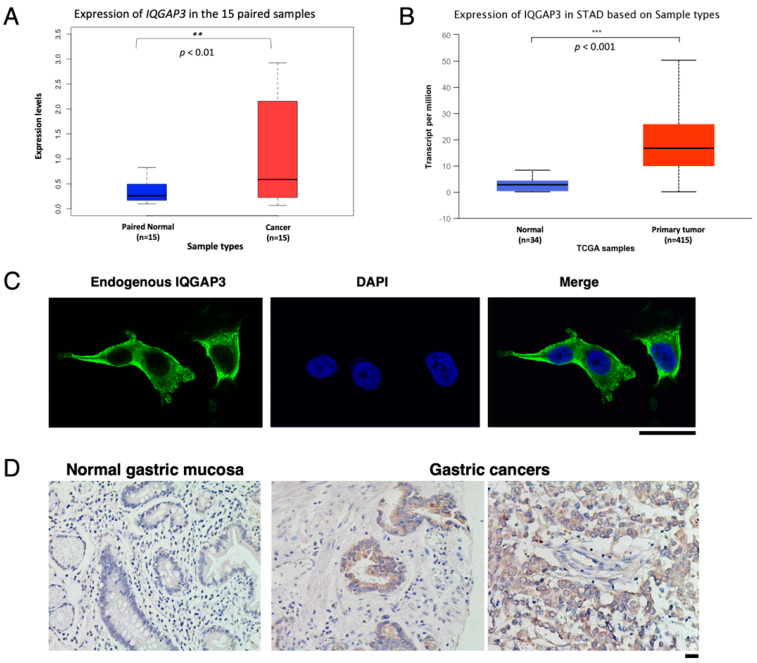
Figure 1.
Expression of IQGAP3 gene and protein in gastric cancer. (A) Average expression levels of IQGAP3 between the paired 15 gastric cancer and normal tissue samples. (B) Average expression of IQGAP3 in patients with primary gastric cancer (n = 415) comparing to normal controls (n = 34). The analysis was performed using the TCGA database on UALCAN (http://ualcan.path.uab.edu/). STAD: Stomach adenocarcinoma. Blue box: Paired-normal tissues from the 15 patients or the normal gastric tissues from the TCGA database. Red box: Gastric cancer tissues. (C) Subcellular localization of endogenous IQGAP3 in MKN1 gastric cancer cells. Magnification; ×1000. Scale bar: 50 mm. (D) Representative immunohistochemical staining of IQGAP3 in non-cancerous gastric tissue, intestinal-type gastric cancer tissue and diffuse-type gastric cancer tissue. Magnification; ×200. Scale bar: 50 mm.

