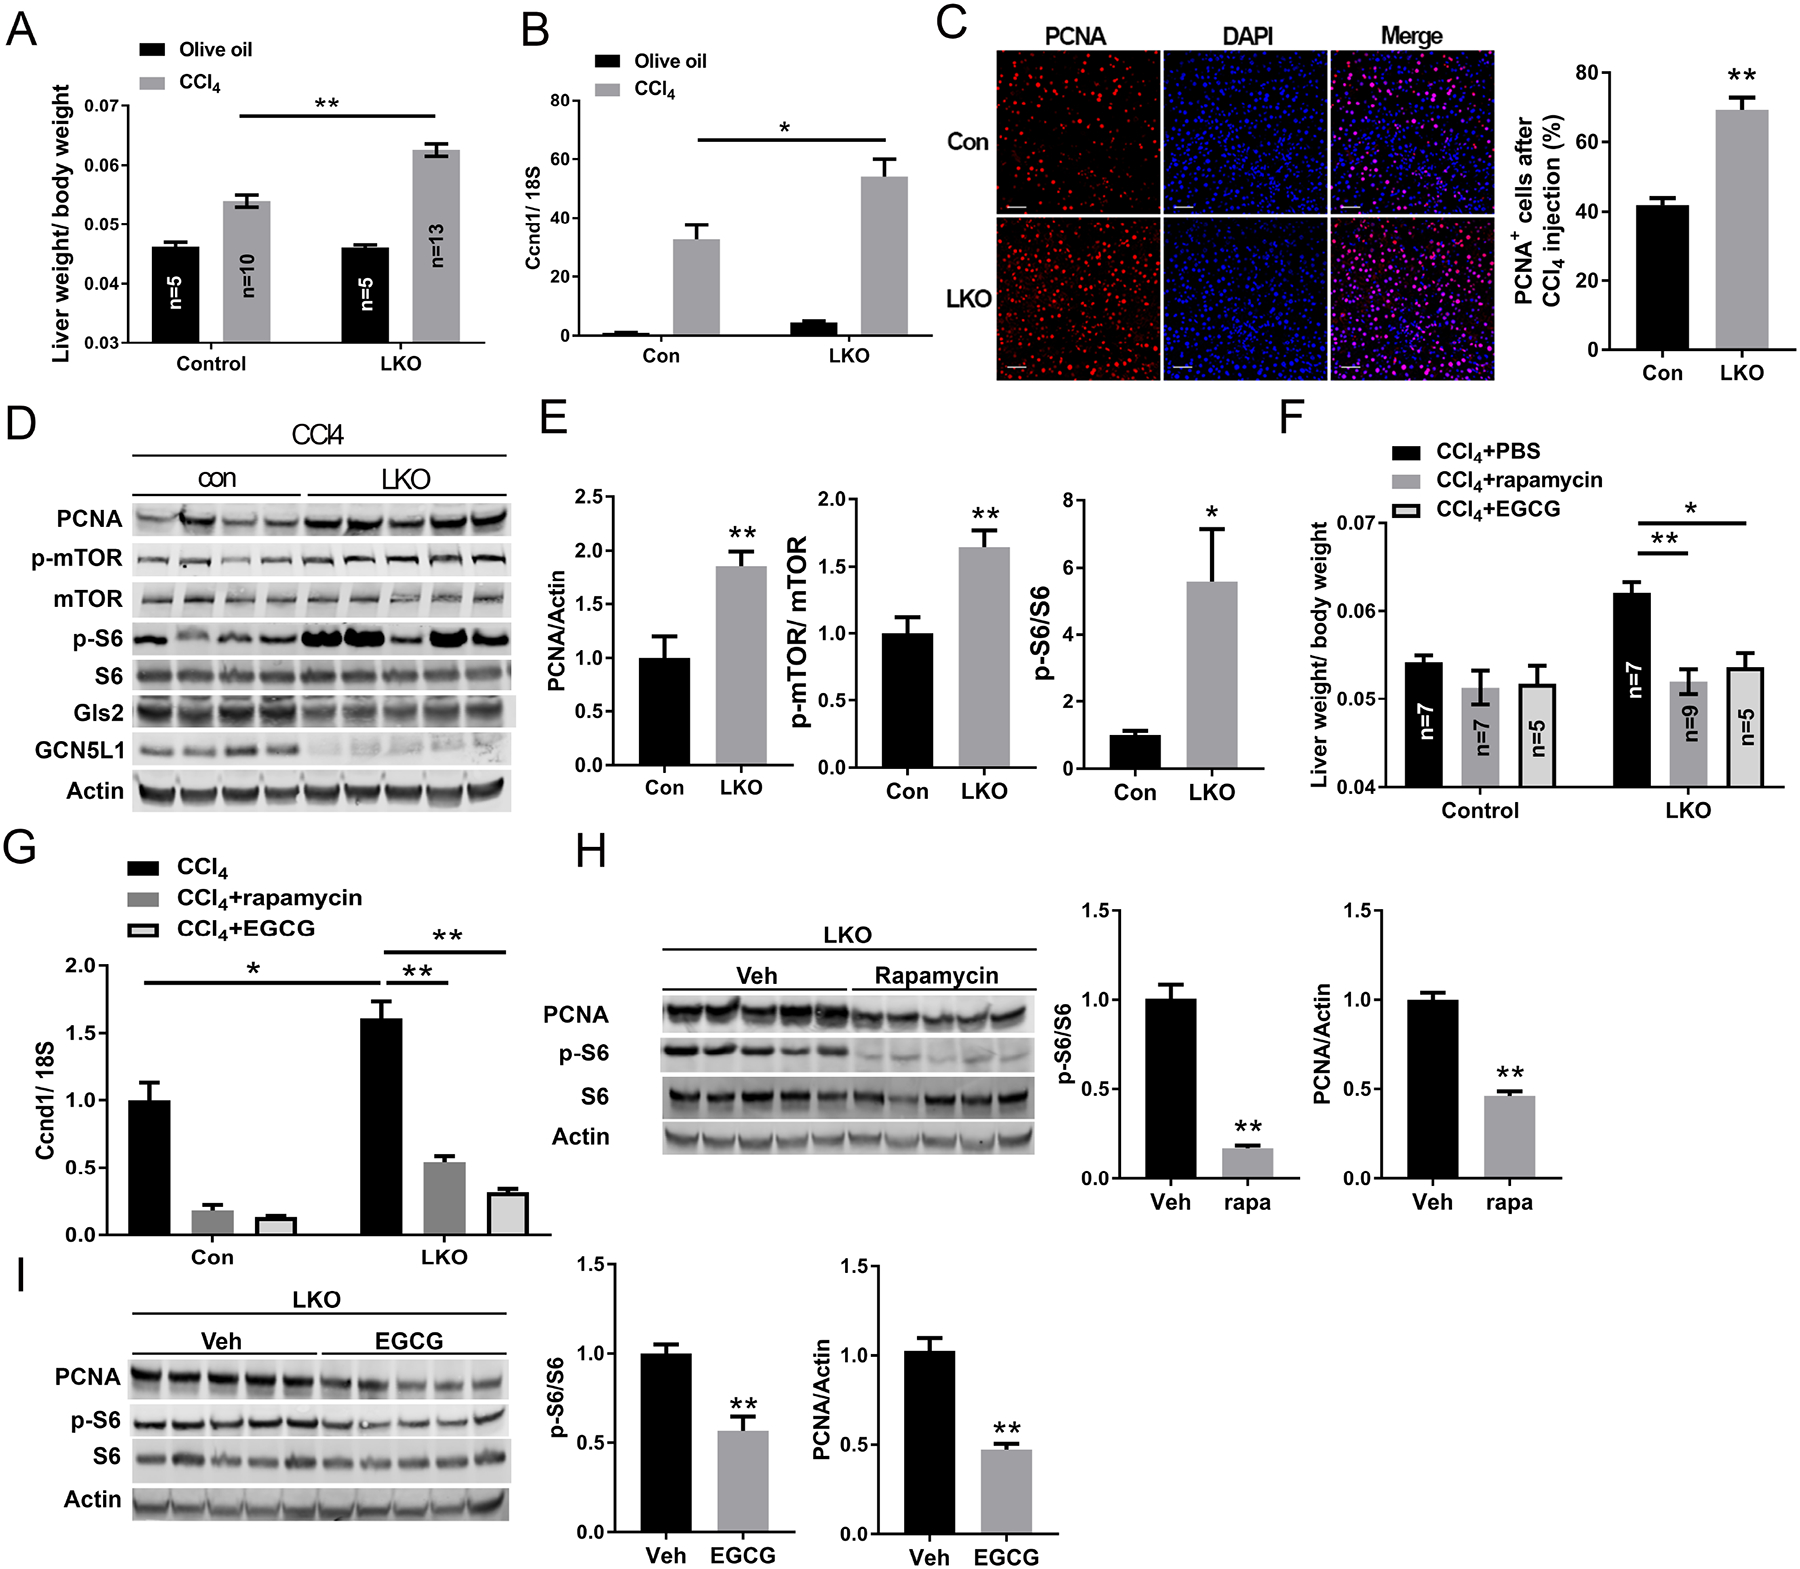
FIG. 6.

GCN5L1 LKO promotes liver regeneration following CCl4 exposure by increasing glutaminolysis and mTOR activation. (A) GCN5L1 LKO mice and flox/flox littermates at 8–9 weeks were treated for 2 days with vehicle (olive oil) or CCl4 (n = 5–13 per group). Animals were sacrificed at 48h after CCl4 injection. Liver weight was determined relative to body weight (n = 5–13 per group). (B) Quantitative RT-PCR analyses of hepatic mRNA abundance of cyclin D1 upon CCl4 or vehicle injection. (C) Proliferation marker PCNA staining was employed on liver paraffin sections with concurrent DAPI staining. The percentage of PCNA positive cells was analyzed by ImageJ. Scale bar indicates 50μm. (D and E) Immunoblotting of liver extracts using the indicated antibodies. Representative results are shown for individual mice of CCl4 treatment (D). Actin was used as loading control. Phosphorylation levels of mTOR and S6 were determined by densitometric quantification (E). (F) 6h after CCl4 injection, mice were injected i.p. with PBS, rapamycin or EGCG twice at 24h intervals. 48h after CCl4 injection mice were sacrificed and liver weight was determined relative to body weight (n = 5–9 per group). (G) Quantitative RT-PCR analyses of hepatic mRNA of cyclin D1 upon treatments in E. (H and I) Immunoblotting of liver extracts using the indicated antibodies. Representative results are shown for individual mice with CCl4 and rapamycin treatment (H) or CCl4 and EGCG treatment (I). Quantification of the immunoblots were shown on the right of each panel. Values are expressed as mean ± s.e.m. *P<0.05, **P < 0.01 versus respective control groups by unpaired Student’s t-test.
