

Abstract
In breast adipose tissue, macrophages that encircle damaged adipocytes form “crown-like structures of breast” (CLS-B). Although CLS-B have been associated with breast cancer, their role in benign breast disease (BBD) and early carcinogenesis is not understood. We evaluated breast biopsies from three age-matched groups (n = 86 each, mean age 55 years), including normal tissue donors of the Susan G. Komen for the Cure Tissue Bank (KTB), and subjects in the Mayo Clinic Benign Breast Disease Cohort who developed cancer (BBD cases) or did not develop cancer (BBD controls, median follow-up 14 years). Biopsies were classified into histologic categories, and CD68-immunostained tissue sections were evaluated for the frequency and density of CLS-B. Our data demonstrate that CLS-B are associated with BBD: CLS-B–positive samples were significantly less frequent among KTB biopsies (3/86, 3.5%) than BBD controls (16/86 = 18.6%, P = 0.01) and BBD cases (21/86 = 24%, P = 0.002). CLS-B were strongly associated with body mass index (BMI); BMI < 25: 7% CLS-B positive, BMI 25–29: 13%, and BMI ≥ 30: 29% (P = 0.0005). Among BBD biopsies, a high CLS-B count [>5 CLS-B/sample: 10.5% (BBD cases) vs 4.7% (BBD controls), P = 0.007] conferred a breast cancer OR of 6.8 (95% CI, 1.4–32.4), P = 0.02, after adjusting for adipose tissue area (cm2), histologic impression, and BMI. As high CLS-B densities are independently associated with an increased breast cancer risk, they may be a promising histologic marker of breast cancer risk in BBD.
Introduction
Chronic low-grade inflammation is an established risk factor for many cancers, including breast cancer (1). In adipocyte-rich tissues, a distinctive type of chronic inflammation occurs when damaged or necrotic adipocytes are encircled by macrophages, forming a syncytial arrangement designated a “crown-like” structure (CLS) (2). Originally described in visceral and subcutaneous adipose tissues, CLSs are associated with obesity, fatty liver disease, and insulin resistance (3–5). However, CLSs are also found in breast tissues of patients with breast cancer (CLS-B), are enriched in overweight and obese patients, and appear to adversely impact disease recurrence rates and survival (6–9). CLS-B are associated with elevations in growth-promoting inflammatory mediators, including TNFα and prostaglandin E2 among others, as well as aromatase, which catalyzes the rate-limiting step in the biosynthesis of estrogen (10–14). As such, CLS-B may be involved in direct stimulation of tumor growth and local production of estrogen. To date, macrophagic CLS-B have not been evaluated in precarcinogenic breast tissues or benign breast disease (BBD), and their role as a histologic marker of breast cancer risk has not been explored.
In this study, we characterized and quantitated the stromal CLS-B microenvironment in normal donor and BBD tissues to evaluate (i) the association with clinical parameters including BMI and age as well as (ii) the association with established pathologic risk factors of breast cancer, including histologic categories of BBD and lobular involution. We designed an age-matched case–control study composed of subjects from the well-characterized Mayo Benign Breast Disease cohort with long-term follow-up for breast cancer events and donor breast tissues from women with no clinical breast disease from the Komen Tissue Bank (KTB). Ultimately, our goal was to assess the utility of CLS-B as an independent inflammatory histologic marker of breast cancer risk.
Materials and Methods
Patient sample
Study approval was granted by the Mayo Clinic Institutional Review Board. Study participants were derived from three age-matched groups: 86 normal breast tissue donors from the Susan G. Komen for the Cure Tissue Bank at Indiana University Simon Cancer Centre (KTB; Indianapolis, IN); 86 subjects in the Mayo Clinic Benign Breast Disease Cohort with an initial benign biopsy who subsequently developed cancer (BBD cases); and 86 Mayo BBD subjects with benign biopsies who did not develop breast cancer (BBD controls) with follow-up time (at minimum) equivalent to that of their matched BBD cases. Follow-up time was calculated from the date of the index benign biopsy until the diagnosis of breast cancer or until one of the following events: prophylactic mastectomy, last clinical follow-up, or death.
KTB samples were obtained from donor women with no clinical breast abnormalities. We have previously reviewed a large sample of these tissues to confirm that the majority have no histologic abnormalities (15). The Mayo BBD Cohort is a large, well-characterized cohort of approximately 13,500 women with biopsy-proven BBD, diagnosed between 1967 and 2001 (16, 17). Details of the Mayo BBD cohort design with methodology for collection of follow-up data, including breast cancer events, have been described previously (16). Among the BBD cases in this study sample, the median interval from biopsy to development of breast cancer was 7 years (range, 0.7–14 years). Among BBD controls, the median duration of breast cancer-free follow-up was 14 years (range, 2–19 years).
Histology
For all three groups, the original H&E-stained tissue sections were reviewed by a pathologist with expertise in breast pathology (D.W. Visscher), blinded to participant characteristics and outcomes. Using the criteria of Dupont and Page, the breast epithelium was classified into one of the following categories: no histologic abnormality, nonproliferative disease, proliferative disease without atypia, or with atypical hyperplasia (18). In addition, lobular involution was assessed and graded as none, partial, or complete using a previously published scoring system (19).
IHC and digital image analysis
IHC was performed on deparaffinized, rehydrated sections obtained from representative formalin-fixed, paraffin-embedded tissue blocks (one block/sample), using antibody-specific epitope retrieval techniques with the Dako Envision (Dako) automated system for detection of CD68 (DAKO, M0876 at 1:100; ref. 20). The unstained tissue sections were sequentially cut from the corresponding tissue blocks and were within an estimated 100 to 200 μm of the original H&E-stained section. Whole slide digital images of anti–CD68-immunostained slides were captured with the Aperio Scanscope XT slide scanner (Aperio). The digital images were analyzed using Aperio ImageScope software primarily to measure the tissue area per slide. In addition, the percentage of adipose tissue on the slide was visually estimated to the nearest decile. For ease of quantitation, the number of CLS-B, defined as individual adipocytes circumferentially surrounded by CD68-expressing macrophages, were manually counted and annotated on the digital image (2). CLS-B were identified as scattered single adipocytes encircled by macrophages, lacked other inflammatory cells and were not associated with any evidence of mechanical tissue damage. As such, they are histologically distinct from injury-associated adipose tissue necrosis. Using the estimated adipose tissue area, CLS-B density (# of CLS-B/cm2 adipose tissue) was calculated. Stromal CD68+ macrophages were also manually scored in a semiquantitative fashion generating a macrophage stromal score (MSS), using a numeric scoring system (1–3) corresponding to low, moderate, and high stromal CD68+ macrophagic infiltration.
Statistical analysis
Descriptive statistics were reported with frequency and percentage for categorical variables and median (range) for continuous variables. Conditional logistic regression was used to examine associations with BBD case versus control status by univariate and multivariate analysis with the matched set as a stratification variable. Models assessing the presence of any CLS-B, >5 CLS-B, or CLS-B count were adjusted for adipose tissue area (cm2) to account for different tissue sizes. Because of a large number of samples with a zero count for CLS-B in the KTB group, comparisons with that group were performed using negative binomial regression on CLS-B count with log(adipose area (cm2)) as an offset variable. Correlations were calculated using the Spearman rank method. P values <0.05 were considered statistically significant. Analysis was performed using SAS (Version 9.3, SAS Institute Inc.).
Results
Clinical characteristics
In the final age-matched study set of 86 triplet samples, the mean participant age was 54.7 years. Using age as an approximation of menopausal status, a minority (18.6%) were premenopausal (age < 45), 37.2% were perimenopausal (age 45–55), and 44.2% were postmenopausal (age > 55; Table 1). The mean body mass index (BMI; at the time of biopsy) was significantly higher for KTB subjects (mean 29.1, P = 0.02 and P = 0.04 compared with BBD controls and cases, respectively), but similar for BBD cases and controls (BBD controls: 26.6; and BBD cases: 27.5, P = 0.67).
Table 1.
Clinicopathologic characteristics
| Overall N = 258 |
KTB n = 86 |
BBD controls n = 86 |
BBD cases n = 86 |
|
|---|---|---|---|---|
| Age | ||||
| <45 | 48 (18.6%) | 16 (18.6%) | 16 (18.6%) | 16 (18.6%) |
| 45–55 | 96 (37.2%) | 35 (40.7%) | 30 (34.9%) | 31 (36.0%) |
| >55 | 114 (44.2%) | 35 (40.7%) | 40 (46.5%) | 39 (45.3%) |
| BMI | ||||
| Not available | 8 | 0 | 5 | 3 |
| <25 | 86 (34.4%) | 24 (27.9%) | 32 (39.5%) | 30 (36.1%) |
| 25–29 | 88 (35.2%) | 30 (34.9%) | 25 (30.9%) | 33 (39.8%) |
| ≥30 | 76 (30.4%) | 32 (37.2%) | 24 (29.6%) | 20 (24.1%) |
| Lobular involution | ||||
| Not available | 12 | 3 | 1 | 8 |
| None | 36 (14.6%) | 4 (4.8%) | 12 (14.1%) | 20 (25.6%) |
| Partial | 114 (46.3%) | 35 (42.2%) | 37 (43.5%) | 42 (53.8%) |
| Complete | 96 (39.0%) | 44 (53.0%) | 36 (42.4%) | 16 (20.5%) |
| Histologic impression | ||||
| Not available | 2 | 2 | 0 | 0 |
| No histologic abnormality | 54 (21.1%) | 54 (64.3%) | 0 | 0 |
| Nonproliferative disease | 79 (30.9%) | 22 (26.2%) | 34 (39.5%) | 23 (26.7%) |
| Proliferative disease without atypia | 87 (34.0%) | 7 (8.3%) | 38 (44.2%) | 42 (48.8%) |
| Atypia | 36 (14.1%) | 1 (1.2%) | 14 (16.3%) | 21 (24.4%) |
Histologic findings
The histologic findings of KTB biopsies were similar to our previous observations of donor biopsies (Table 1; ref. 15). Comparing BBD cases and controls, BBD cases predictably had a higher proportion of women with proliferative disease (49% vs. 44%) and atypical hyperplasia (24% vs. 16%), and a smaller proportion with nonproliferative disease (27% vs. 40%). Lobular involution scores also showed the expected distribution across the three groups: complete involution (a feature of lower risk; ref. 21) was observed in 53% of KTB samples, 42% of BBD controls, and 21% of BBD cases (Table 1). The clinicopathologic features of the carcinomas that subsequently developed in the BBD cases are listed in Table 2.
Table 2.
Pathologic features of carcinomas in BBD cases
| BBD cases (n = 86) |
|
|---|---|
| Cancer laterality relative to index BBD biopsy | |
| Contralateral | 37 (43.0%) |
| Ipsilateral | 49 (57.0%) |
| Estrogen receptor status of carcinoma | |
| Negative | 20 (23.8%) |
| Positive | 64 (76.2%) |
| Missing | 2 |
| Invasive carcinoma (vs. in situ) | |
| No | 22 (25.9%) |
| Yes | 63 (74.1%) |
| Missing | 1 |
| Nodal status | |
| Negative | 66 (77.6%) |
| Positive | 19 (22.4%) |
| Missing | 1 |
| TNM stage | |
| 0 | 22 (25.9%) |
| 1 | 37 (43.5%) |
| 2 | 18 (21.2%) |
| 3 | 8 (9.4%) |
| Missing | 1 |
CLS-B and stromal macrophage scores
Overall, CD68-positive CLS-B were identified in 40 of 258 (15.5%) of all samples. CLS-B formed scattered individual lesions or small clusters within the interlobular stromal adipose tissue rather than being juxtaposed to epithelial elements (Fig. 1A and B). There was no histologic or IHC evidence of conventional adipose tissue necrosis. The numeric MSS correlated with the presence of CLS-B, as the frequency of CLS-B–positive samples was 2%, 17%, and 47% for samples with MSS of 1, 2, and 3, respectively (P < 0.0001).
Figure 1.
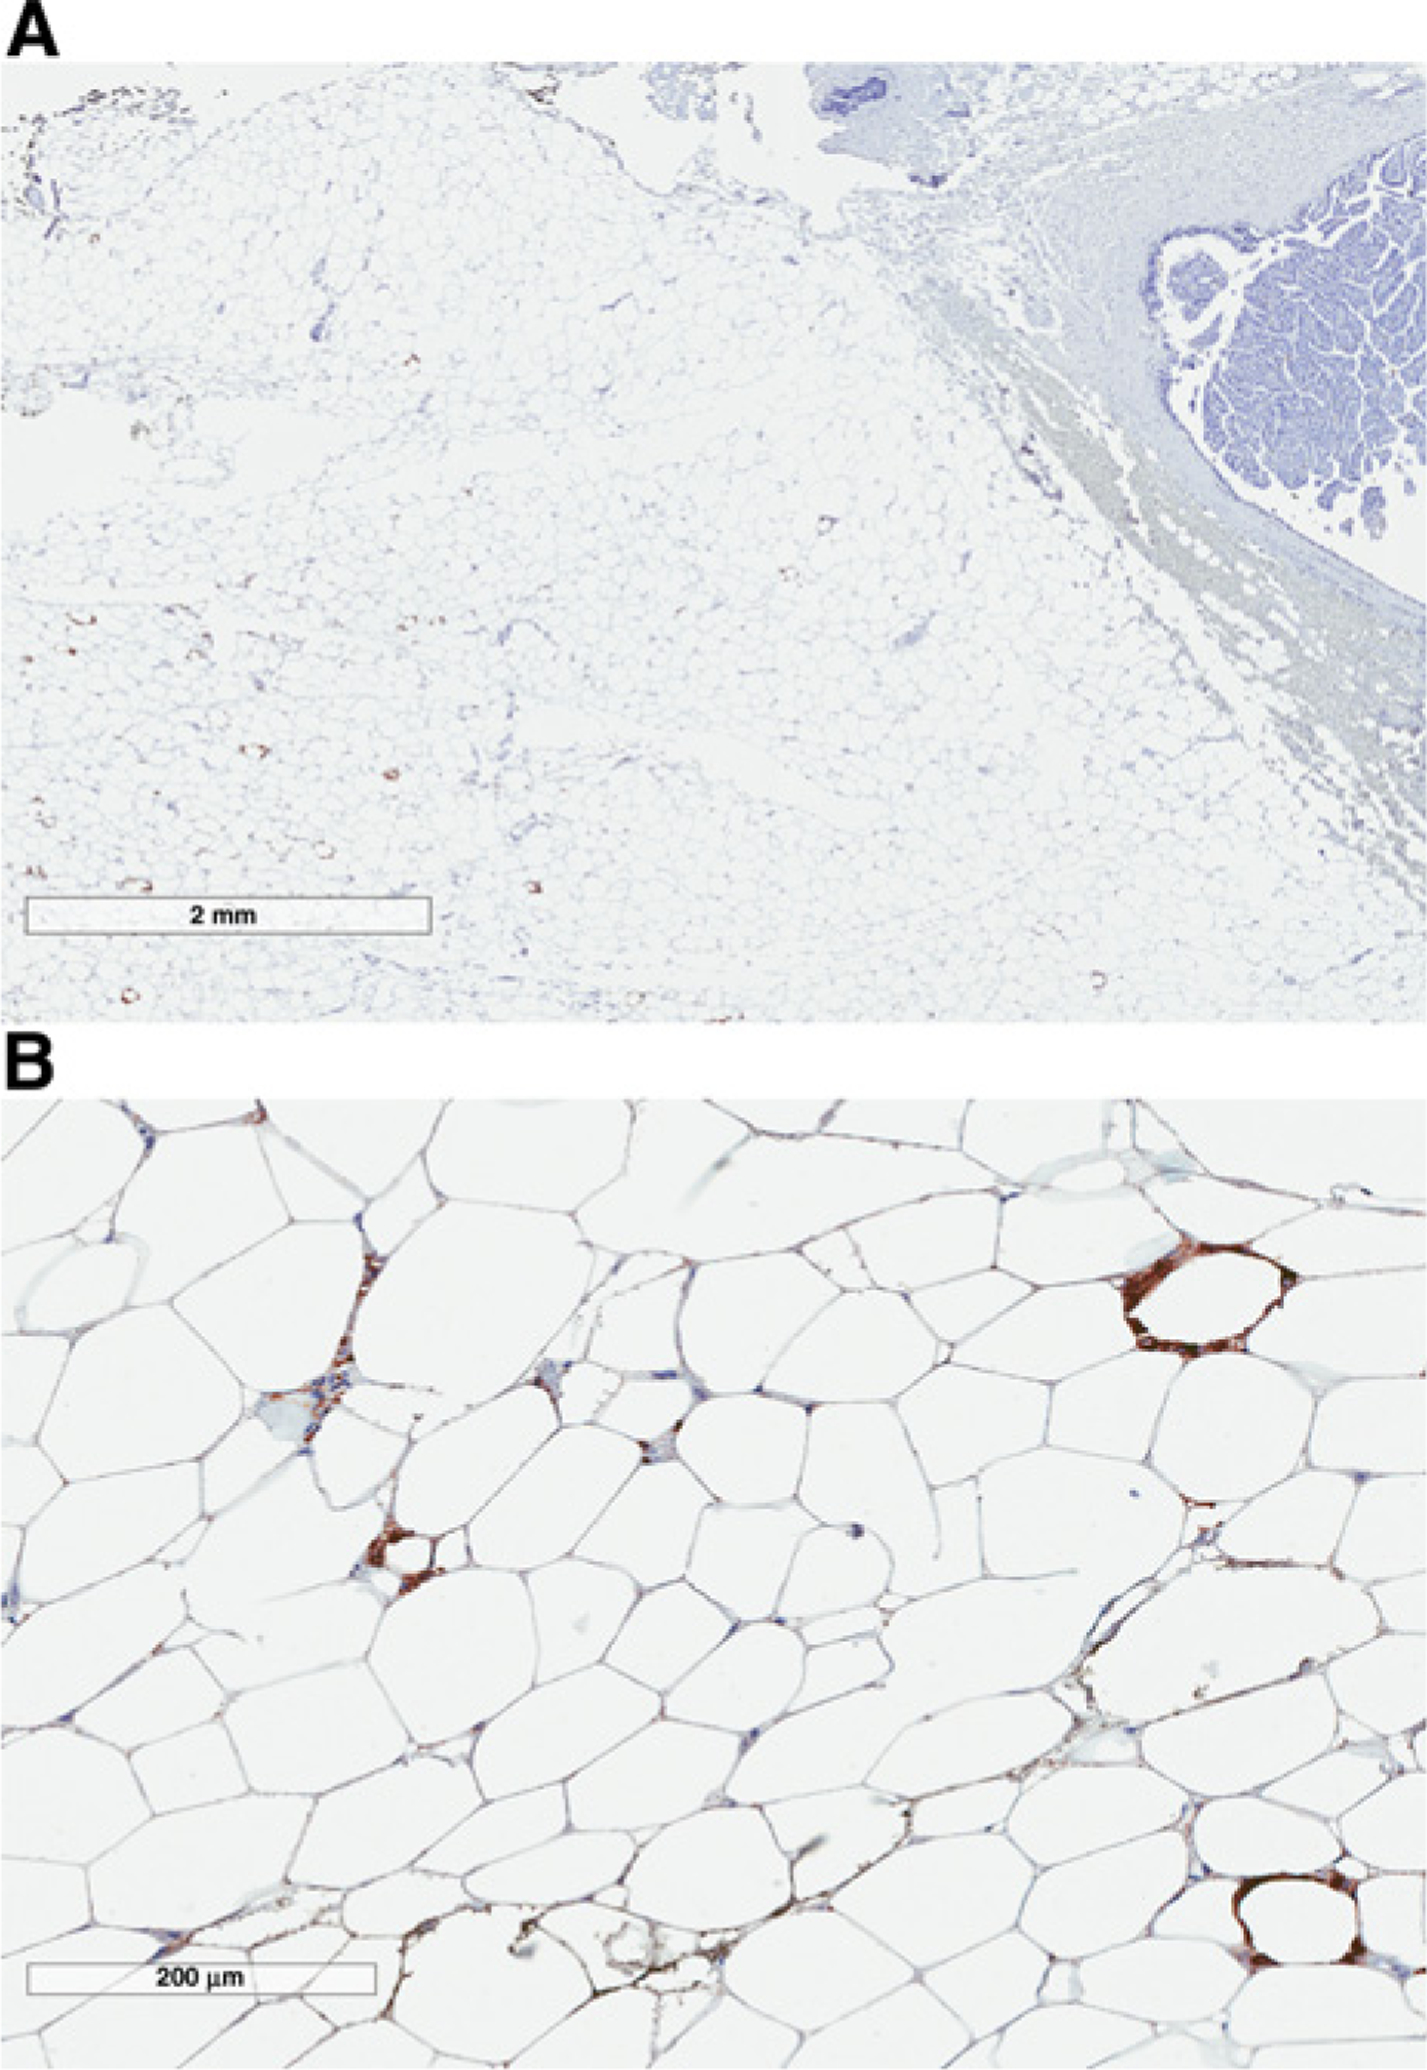
CD68-immunostained breast biopsy from a CLS-B–positive BBD case sample showing interlobular stromal distribution of macrophagic CLS-B at low (A) and intermediate (B) magnification.
BBD cases versus BBD controls
Among BBD samples, cases were more likely to have CLS-B compared with BBD controls (24.4% versus 18.6% with any CLS-B, P = 0.07 adjusted for adipose area, Table 3). Although overall, the median CLS-B densities were low, 2.7/cm2 adipose tissue (BBD controls) and 3.3/cm2 adipose tissue (BBD cases), a subset of BBD samples (particularly BBD cases) had large numbers of CLS-B (ranging up to 55 CLS-B/sample; Table 3). The number of BBD cases with >5 CLS-B/sample was double that of BBD controls (10.5% vs 4.7%, respectively, P = 0.007). Furthermore, among BBD samples, the presence of >5 CLS-B per sample conferred a breast cancer OR of 7.6 [95% confidence interval (CI), 1.7–33.7; P0.007] after adjusting for adipose area, and 7.3 (95% CI, = 1.6–33.8; P = 0.01) after additionally adjusting for histologic impression and 6.8 (95% CI, 1.4–32.4; P = 0.02), after additionally adjusting for BMI (Table 3).
Table 3.
Association between CLS-B and subsequent cancer risk
| BBD controls n = 86 | BBD cases n = 86 | Pa | Pb | Pc | |
|---|---|---|---|---|---|
| Any CLS-B, n (%) | 16 (18.6%) | 21 (24.4%) | 0.07 | 0.09 | 0.11 |
| >5 CLS-B, n (%) | 4 (4.7%) | 9 (10.5%) | 0.007 | 0.01 | 0.02 |
| Number of CLS-B (among CLS-B-positive samples) | |||||
| Median (range) | 3 (1–55) | 5 (1–37) | 0.81 | 0.80 | 0.84 |
| CLS-B densityd (among CLS-B-positive samples) | |||||
| Median (range) | 2.7 (0.7–19.7) | 3.3 (0.7–27.0) | 0.74 | 0.33 | 0.42 |
| MSS, n (%) | 0.54 | 0.73 | 0.93 | ||
| 1 | 25 (29.1%) | 30 (34.9%) | |||
| 2 | 37 (43.0%) | 33 (38.4%) | |||
| 3 | 24 (27.9%) | 23 (26.7%) | |||
| Mean (SD) | 1.99 (0.76) | 1.92 (0.79) |
P value from conditional logistic regression, adjusted for adipose area (cm2) for measures not standardized to area.
P value from conditional logistic regression adjusting for adipose area (cm2) as above and also histologic impression.
P value from conditional logistic regression adjusting for adipose area (cm2) as above and also histologic impression and BMI.
Lesions/cm2 adipose tissue
Among BBD cases, breast cancers that developed during follow-up among subjects with CLS-B >5 were ipsilateral to the index biopsy in 8/9 (89%) compared with 41/77 (53%) in subjects with fewer or no CLS-B, P = 0.03. A similar trend was observed for the presence of any CLS-B, although this comparison did not reach statistical significance, with 15/21 (71%) of subjects with any CLS-B developing ipsilateral breast cancer versus 34/65 (52%) ipsilateral in subjects with no CLS-B (P = 0.12). Presence of any CLS-B or >5 CLS-B was not significantly associated with estrogen receptor status of the carcinoma (P = 0.64 and P = 0.40) or invasive versus in situ disease (P = 0.38 and P = 0.20), and presence of > 5 CLS-B did not significantly impact the time interval to diagnosis of breast cancer (mean interval 7.1 years vs. 7.6 years for cases without and with >5 CLS-B, respectively, P = 0.58).
CLS-B and MSS in KTB samples
KTB tissue samples had a median adipose area of 0.24 cm2. CLS-B were observed in only 3 of 86 KTB samples (3.5%), each with only one CLS-B. Given the predominance of zero CLS-B counts, negative binomial regression models adjusted for adipose tissue area were used and demonstrated that KTB samples had significantly fewer CLS-B–positive samples as compared with BBD controls (P = 0.01) and BBD cases (P = 0.002). With regard to MSS, 81% of KTB samples had a score of 1, 16% had a score of 2, and 2% had a score of 3. MSS in KTB samples were significantly lower than those of BBD controls (P <0.0001) and BBD cases (P < 0.0001; Table 3).
Correlation of CLS-B with BMI, age, epithelial proliferation, and involution
CLS-B were strongly associated with BMI overall: CLS-B–positive biopsies occurred in 7% of patients with BMI <25, 13% of patients with BMI 25–29, and 29% of patients with BMI ≥ 30, P = 0.0005 (Table 4). This association appeared to be driven largely by the BBD samples, as CLS-B were rare in KTB samples regardless of BMI. Among BBD samples, CLS-B–positive biopsies had similar frequency in obese women (46% in controls and 45% in cases), but at BMI <30, CLS-B–positive samples were more frequent in cases versus controls (19% vs 7%, P = 0.048).
Table 4.
Association between CLS-B and BMI
| N (%) with any CLS-B | Overall N = 250 |
KTB n = 86 |
BBD controls n = 81 |
BBD cases n = 83 |
|---|---|---|---|---|
| BMI < 25 | 6/86 (7.0%) | 0/24 | 2/32 (6.3%) | 4/30 (13.3%) |
| BMI 25–29 | 11/88 (12.5%) | 1/30 (3.3%) | 2/25 (8.0%) | 8/33 (24.2%) |
| BMI ≥ 30 | 22/76 (28.9%) | 2/32 (6.3%) | 11/24 (45.8%) | 9/20 (45.0%) |
CLS-B were also associated with increasing degrees of epithelial proliferation (Table 5). This effect was driven mainly by BBD cases, as the frequency of CLS-B was similar across histologic categories for the other two groups, whereas in BBD cases, CLS-B were more frequent with proliferative disease (± atypia). Presence of CLS-B was not associated with age (P = 0.98), with similar proportions of CLS-B–positive samples (15%, 16%, and 16%, respectively) for age groups <45, 45–55, and >55 years, or involution status (6% of samples with no involution, 19% with partial involution, and 15% with complete involution, P = 0.48).
Table 5.
Association of CLS-B with histologic impression and lobular involution
| N (%) with any CLS-B | ||||
|---|---|---|---|---|
| Overall | KTB | BBD controls | BBD cases | |
| Histologic impression | ||||
| No histologic abnormality | 2/54 (3.7%) | 2/54 (3.7%) | - | - |
| Nonproliferative disease | 11/79 (13.9%) | 1/22 (4.5%) | 8/34 (23.5%) | 2/23 (8.7%) |
| Proliferative disease without atypia | 18/87 (20.7%) | 0/7 (0%) | 5/38 (13.2%) | 13/42 (31.0%) |
| Proliferative disease with atypia | 9/36 (25.0%) | 0/1 (0%) | 3/14 (21.4%) | 6/21 (28.6%) |
| Lobular involution | ||||
| None | 2/36 (5.6%) | 1/4 (25.0%) | 0/12 (0%) | 1/20 (5%) |
| Partial | 22/114 (19.3%) | 1/35 (2.9%) | 7/37 (18.9%) | 14/42 (33.3%) |
| Complete | 14/96 (14.6%) | 1/44 (2.3%) | 9/36 (25.0%) | 4/16 (25.0%) |
Discussion
Macrophagic CLSs are a hallmark of chronic inflammation within adipose tissue (2, 4) and are frequently present in breast adipose tissue from women with breast cancer and in breast tissues of obese women (22). However, prior to our study, CLS-B have not been evaluated in BBD (11, 23). Using a well-characterized BBD cohort and normal tissue donors, we assessed the frequency and quantity of CLS-B in stromal breast tissues from women with long-term follow-up for breast cancer events to evaluate whether CLS-B are a biomarker of early carcinogenesis and breast cancer risk.
Our data demonstrate that BBD stromal tissues are far more frequently inflamed than donor breast tissues: the number of CLS-B–positive KTB samples was much lower (3/86, 3.5%) than that of BBD controls (16/86 = 18.6%, P = 0.01) and BBD cases (21/86 = 24%, P = 0.002). Although the frequency of CLS-B–positive BBD biopsies was lower than the reported rate of approximately 40% to 50% in breast tissues from patients with breast cancer, risk-reducing mastectomies or in reduction mammoplasties, we evaluated only a single slide in this study compared with multiple slides in previous studies, and the likely decrease in evaluated adipose tissue area may contribute to the differences in CLS-B incidence across these studies (11, 22, 23). Nevertheless, despite the differences in incidence of CLS-B–positive samples, the density of CLS-B inflammation observed in the subsets of CLS-B–positive BBD samples [median 2.7/cm2 adipose tissue (BBD controls) and 3.3/cm2 adipose tissue (BBD cases)] corresponds to a severe CLS-B index inflammation score as described by Iyengar and colleagues (6). These data suggest that CLS-B–associated adipose tissue inflammation occurs in a significant subset of individuals with BBD. We have previously reported that lobules of BBD tissues have a significantly higher density of CD68-positive macrophages, among other immune cell types, compared with that of lobules in KTB donor breast tissues (24). Together, these findings support the hypothesis that BBD is associated with an epithelial and stromal chronic inflammatory environment.
Although neither the frequency of CLS-B–positive samples or the median CLS-B density differed significantly between BBD controls and cases, a subset of cases had markedly elevated numbers of CLS-B (ranging up to 55 per sample). In this subset, high numbers of CLS-B (defined as >5 per sample) were an independent risk factor for breast cancer after adjusting for adipose area, histologic impression, and BMI with OR 6.8, P = 0.02. These findings suggest that it is the extent or quantity of CLS-B inflammation in BBD tissues, rather than its presence or absence, that may predict breast cancer risk.
In addition, the functional state of stromal macrophages and macrophagic CLS-B may define their roles in carcinogenesis. Macrophages are adaptive and differentiate into microenvironment-driven functional roles, generally referred to as M1- and M2-polarized states, with proinflammatory and anti-inflammatory roles, respectively (25). Chronic inflammatory mediators, such as TNFα and prostaglandin E2, upregulate CYP19A1 expression in stromal preadipocytic fibroblasts (26–28). Evaluation of the functional status of stromal macrophages and local production of inflammatory mediators in BBD tissues may shed light onto the role of macrophages in early carcinogenesis. Finally, adipokines, such as leptin and adiponectin, have well-established roles in breast cancer development and progression (29–31). Within the context of BBD, the impact of macrophages on the “cross-talk” between stromal adipocytes, fibroblasts, and benign or atypical epithelial lesions remains largely unexplored.
CLS-B, age, and BMI
Prior studies have reported that CLS-B are associated with the postmenopausal state (23). In our study, participants were stratified by age into groups approximating pre-, peri-, and postmenopausal states (Table 1). In unadjusted analysis, age was not associated with presence of CLS-B or with high CLS-B counts (>5 CLS-B/sample). By multivariate analysis, adjusting for histologic impression, BMI, and (estimated) adipose tissue area, age was not significantly associated with presence of CLS-B in the BBD samples. However, as age is a surrogate of menopausal status, we cannot definitively conclude whether our data can be extrapolated to menopausal status. Furthermore, as we evaluated CLS-B in BBD and Iyengar and colleagues evaluated CLS-B in breast tissues from women with breast cancer or undergoing prophylactic mastectomy for risk reduction, we cannot determine whether these factors may be contributing to the differences in age association with CLS-B.
Several reports have established the association of CLS with obesity (6, 7, 11). Although we observed that CLS-B correlated with BMI, the relationship does not appear to be entirely straightforward. Among BBD controls and cases, obese patients (BMI ≥ 30) had the highest numbers of CLS-B–positive samples, with no significant difference between the two groups (46% and 45%, respectively). In contrast, although KTB donors had a higher mean BMI than women in either BBD group, CLS-B–positive samples were very rare in KTB samples across all BMI, with only 6% in BMI> 30 compared with 45% in the BBD samples, and no KTB samples had high CLS-B densities. These data suggest that BMI is not the sole determinant of macrophagic breast adipose tissue inflammation. Moreover, among BBD samples, in women with BMI <30, CLS-B–positive samples were significantly more frequent in BBD cases versus controls. Recently, Iyengar and collagues reported that increased CLS-B densities and aromatase in breast tissues from women with normal BMI correlated with higher circulating levels of insulin and inflammatory mediators (32), consistent with the phenomenon of metabolic obesity in normal weight individuals (33). We suspect that the increased frequency of CLS-B–positive samples among individuals with BMI <30 in the BBD case group may reflect a similar phenomenon.
Strengths of our study include the use of normal donor breast tissues as well as a large, well-characterized BBD cohort with long-term clinical follow-up, to evaluate the relationship of CLS-B with risk of breast cancer in the context of established clinical and histologic risk factors. Limitations of the study include the relatively small tissue area of biopsy specimens and relative rarity of CLS-B, raising a reasonable concern over sampling limitations in biopsy material. However, we addressed this limitation by adjusting for the percentage of adipose tissue within samples.
In conclusion, this study demonstrates that CLS-B are associated with BBD, and although uncommon, high CLS-B counts are independently associated with subsequent breast cancer risk, after adjusting for histologic impression, adipose tissue area, and BMI. These data suggest that CLS-B may be a promising histologic marker of breast cancer risk. Additional study in a larger cohort with longitudinal and more extensive tissue sampling should clarify the role of macrophages and macrophagic CLS-B in risk prediction and their contribution to early breast carcinogenesis.
Acknowledgments
This research was supported by a grant to Amy C. Degnim from Susan G. Komen for the Cure. Samples from the Susan G. Komen for the Cure Tissue Bank at the IU Simon Cancer Center were used in this study. We thank contributors, including Indiana University who collected samples used in this study, as well as donors and their families, whose help and participation made this work possible.
Footnotes
Disclosure of Potential Conflicts of Interest
No potential conflicts of interest were disclosed.
References
- 1.Mantovani A, Allavena P, Sica A, Balkwill F. Cancer-related inflammation. Nature 2008;454:436–44. [DOI] [PubMed] [Google Scholar]
- 2.Cinti S, Mitchell G, Barbatelli G, Murano I, Ceresi E, Faloia E, et al. Adipocyte death defines macrophage localization and function in adipose tissue of obese mice and humans. J Lipid Res 2005; 46:2347–55. [DOI] [PubMed] [Google Scholar]
- 3.Strissel KJ, Stancheva Z, Miyoshi H, Perfield JWII, DeFuria J, Jick Z, et al. Adipocyte death, adipose tissue remodeling, and obesity complications. Diabetes 2007;56:2910–8. [DOI] [PubMed] [Google Scholar]
- 4.Le KA, Mahurkar S, Alderete TL, Hasson RE, Adam TC, Kim JS, et al. Subcutaneous adipose tissue macrophage infiltration is associated with hepatic and visceral fat deposition, hyperinsulinemia, and stimulation of NF-kappaB stress pathway. Diabetes 2011; 60:2802–9. [DOI] [PMC free article] [PubMed] [Google Scholar]
- 5.Ioannou GN, Haigh WG, Thorning D, Savard C. Hepatic cholesterol crystals and crown-like structures distinguish NASH from simple steatosis. J Lipid Res 2013;54:1326–34. [DOI] [PMC free article] [PubMed] [Google Scholar]
- 6.Iyengar NM, Morris PG, Zhou XK, Gucalp A, Giri D, Harbus MD, et al. Menopause is a determinant of breast adipose inflammation. Cancer Prev Res 2015;8:349–58. [DOI] [PMC free article] [PubMed] [Google Scholar]
- 7.Vaysse C, Lomo J, Garred O, Fjeldheim F, Lofteroed T, Schlichting E, et al. Inflammation of mammary adipose tissue occurs in overweight and obese patients exhibiting early-stage breast cancer. NPJ Breast Cancer 2017;3:19. [DOI] [PMC free article] [PubMed] [Google Scholar]
- 8.Koru-Sengul T, Santander AM, Miao F, Sanchez LG, Jorda M, Gluck S, et al. Breast cancers from black women exhibit higher numbers of immunosuppressive macrophages with proliferative activity and of crown-like structures associated with lower survival compared to non-black Latinas and Caucasians. Breast Cancer Res Treat 2016;158:113–26. [DOI] [PMC free article] [PubMed] [Google Scholar]
- 9.Iyengar NM, Zhou XK, Gucalp A, Morris PG, Howe LR, Giri DD, et al. Systemic Correlates of White Adipose Tissue Inflammation in Early-Stage Breast Cancer. Clin Cancer Res 2016;22:2283–9. [DOI] [PMC free article] [PubMed] [Google Scholar]
- 10.Subbaramaiah K, Howe LR, Bhardwaj P, Du B, Gravaghi C, Yantiss RK, et al. Obesity is associated with inflammation and elevated aromatase expression in the mouse mammary gland. Cancer Prev Res 2011;4:329–46. [DOI] [PMC free article] [PubMed] [Google Scholar] [Retracted]
- 11.Morris PG, Hudis CA, Giri D, Morrow M, Falcone DJ, Zhou XK, et al. Inflammation and increased aromatase expression occur in the breast tissue of obese women with breast cancer. Cancer Prev Res 2011;4:1021–9. [DOI] [PMC free article] [PubMed] [Google Scholar]
- 12.Subbaramaiah K, Morris PG, Zhou XK, Morrow M, Du B, Giri D, et al. Increased levels of COX-2 and prostaglandin E2 contribute to elevated aromatase expression in inflamed breast tissue of obese women. Cancer Discov 2012;2:356–65. [DOI] [PMC free article] [PubMed] [Google Scholar] [Retracted]
- 13.Howe LR, Subbaramaiah K, Hudis CA, Dannenberg AJ. Molecular pathways: adipose inflammation as a mediator of obesity-associated cancer. Clin Cancer Res 2013;19:6074–83. [DOI] [PMC free article] [PubMed] [Google Scholar]
- 14.Mullooly M, Yang HP, Falk RT, Nyante SJ, Cora R, Pfeiffer RM, et al. Relationship between crown-like structures and sex-steroid hormones in breast adipose tissue and serum among postmenopausal breast cancer patients. Breast Cancer Res 2017;19:8. [DOI] [PMC free article] [PubMed] [Google Scholar]
- 15.Degnim AC, Visscher DW, Hoskin TL, Frost MH, Vierkant RA, Vachon CM, et al. Histologic findings in normal breast tissues: comparison to reduction mammaplasty and benign breast disease tissues. Breast Cancer Res Treat 2012;133:169–77. [DOI] [PMC free article] [PubMed] [Google Scholar]
- 16.Hartmann LC, Sellers TA, Frost MH, Lingle WL, Degnim AC, Ghosh K, et al. Benign breast disease and the risk of breast cancer. N Engl J Med 2005;353:229–37. [DOI] [PubMed] [Google Scholar]
- 17.Hartmann LC, Radisky DC, Frost MH, Santen RJ, Vierkant RA, Benetti LL, et al. Understanding the premalignant potential of atypical hyperplasia through its natural history: a longitudinal cohort study. Cancer Prev Res 2014;7:211–7. [DOI] [PMC free article] [PubMed] [Google Scholar]
- 18.Dupont WD, Page DL. Risk factors for breast cancer in women with proliferative breast disease. N Engl J Med 1985; 312:146–51. [DOI] [PubMed] [Google Scholar]
- 19.Milanese TR, Hartmann LC, Sellers TA, Frost MH, Vierkant RA, Maloney SD, et al. Age-related lobular involution and risk of breast cancer. J Natl Cancer Inst 2006;98:1600–7. [DOI] [PubMed] [Google Scholar]
- 20.Degnim AC, Brahmbhatt RD, Radisky DC, Hoskin TL, Stallings-Mann M, Laudenschlager M, et al. Immune cell quantitation in normal breast tissue lobules with and without lobulitis. Breast Cancer Res Treat 2014;144:539–49. [DOI] [PMC free article] [PubMed] [Google Scholar]
- 21.Milanese TR, Hartmann LC, Sellers TA, Frost MH, Vierkant RA, Maloney SD, et al. Age-related lobular involution and risk of breast cancer. J Natl Cancer Inst 2006;98:1600–7. [DOI] [PubMed] [Google Scholar]
- 22.Sun X, Casbas-Hernandez P, Bigelow C, Makowski L, Joseph Jerry D, Smith Schneider S, et al. Normal breast tissue of obese women is enriched for macrophage markers and macrophage-associated gene expression. Breast Cancer Res Treat 2012;131: 1003–12. [DOI] [PMC free article] [PubMed] [Google Scholar]
- 23.Iyengar NM, Morris PG, Zhou XK, Gucalp A, Giri D, Harbus MD, et al. Menopause is a determinant of breast adipose inflammation. Cancer Prev Res 2015;8:349–58. [DOI] [PMC free article] [PubMed] [Google Scholar]
- 24.Degnim AC, Hoskin TL, Arshad M, Frost MH, Winham SJ, Brahmbhatt R, et al. Alterations in the immune cell composition in premalignant breast tissue that precede breast cancer development. Clin Cancer Res 2017;23:3945–3952. [DOI] [PubMed] [Google Scholar]
- 25.Mantovani A, Sozzani S, Locati M, Allavena P, Sica A. Macrophage polarization: tumor-associated macrophages as a paradigm for polarized M2 mononuclear phagocytes. Trends Immunol 2002;23:549–55. [DOI] [PubMed] [Google Scholar]
- 26.Zhao Y, Nichols JE, Valdez R, Mendelson CR, Simpson ER. Tumor necrosis factor-alpha stimulates aromatase gene expression in human adipose stromal cells through use of an activating protein-1 binding site upstream of promoter 1.4. Mol Endocrinol 1996;10:1350–7. [DOI] [PubMed] [Google Scholar]
- 27.Chen D, Reierstad S, Lin Z, Lu M, Brooks C, Li N, et al. Prostaglandin E(2) induces breast cancer related aromatase promoters via activation of p38 and c-Jun NH(2)-terminal kinase in adipose fibroblasts. Cancer Res 2007;67:8914–22. [DOI] [PubMed] [Google Scholar]
- 28.Bulun SE, Chen D, Moy I, Brooks DC, Zhao H. Aromatase, breast cancer and obesity: a complex interaction. Trends Endocrinol Metab 2012;23:83–9. [DOI] [PMC free article] [PubMed] [Google Scholar]
- 29.Duffy MJ, McGowan PM, Harbeck N, Thomssen C, Schmitt M. uPA and PAI-1 as biomarkers in breast cancer: validated for clinical use in level-of-evidence-1 studies. Breast Cancer Res 2014;16:428. [DOI] [PMC free article] [PubMed] [Google Scholar]
- 30.Schaffler A, Scholmerich J, Buechler C. Mechanisms of disease: adipokines and breast cancer – endocrine and paracrine mechanisms that connect adiposity and breast cancer. Nat Clin Pract Endocrinol Metab 2007;3:345–54. [DOI] [PubMed] [Google Scholar]
- 31.Newman G, Gonzalez-Perez RR. Leptin-cytokine crosstalk in breast cancer. Mol Cell Endocrinol 2014;382:570–82. [DOI] [PMC free article] [PubMed] [Google Scholar]
- 32.Iyengar NM, Brown KA, Zhou XK, Gucalp A, Subbaramaiah K, Giri DD, et al. Metabolic obesity, adipose inflammation and elevated breast aromatase in women with normal body mass index. Cancer Prev Res 2017;10:235–43. [DOI] [PMC free article] [PubMed] [Google Scholar]
- 33.St-Onge MP, Janssen I, Heymsfield SB. Metabolic syndrome in normal-weight Americans: new definition of the metabolically obese, normal-weight individual. Diabetes Care 2004;27: 2222–8. [DOI] [PubMed] [Google Scholar]