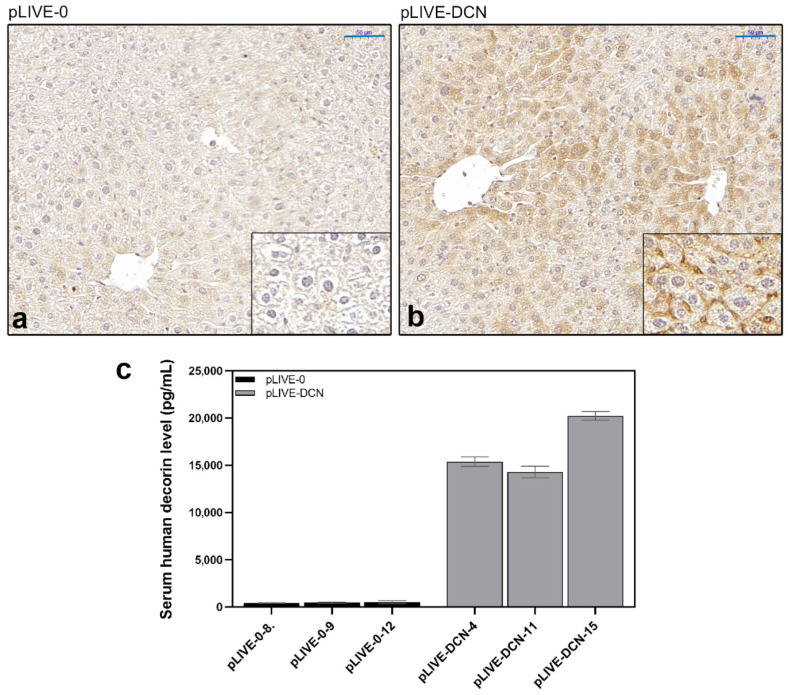
Figure 3.
Expression of human decorin in the liver of mock-transfected (pLIVE-0) (a) and decorin-transfected (pLIVE-DCN) (b) groups. Strong immunopositivity was detected around the central veins and the portal tracts of decorin-transfected livers. (c) Human decorin ELISA from sera of control (pLIVE-0) and decorin-transfected (pLIVE-DCN) groups following c38 injection. The absolute proteoglycan level is marked on the y-axis (pg/mL) and individual mice are shown on the x-axis (n = 3 in both groups). Data are displayed as mean ± SD. Scale bar = 50 μm.

