

Abstract
Cytokines that stimulate T cell proliferation, such as IL15, have been explored as a means of boosting the anti-tumor activity of chimeric antigen receptor (CAR)-T cells. However, constitutive cytokine signaling in T cells and activation of bystander cells may cause toxicity. IL23 is a two-subunit cytokine known to promote proliferation of memory T cells and Th17 cells. We found that, upon T cell receptor (TCR) stimulation, T cells upregulate the IL23 receptor and the IL23α p19, but not the p40, subunit. We engineered expression of the p40 subunit in T cells (p40-Td cells), and obtained a selective proliferative activity in activated T cells via autocrine IL23 signaling. Compared to CAR-T cells, p40-Td CAR-T cells showed improved anti-tumor capacity in vitro, with increased granzyme B and decreased PD-1 expression. In two xenograft and two syngeneic solid tumor mouse models, p40-Td CAR-T cells showed superior efficacy compared with CAR-T cells and attenuated side effects compared with CAR-T cells expressing IL18 or IL15.
T cells can be rendered tumor specific via genetic engineering with a tumor-targeting T cell receptor (TCR) or a chimeric antigen receptor (CAR)1. Both TCR-engineered and CAR-T cells promote substantial objective clinical responses in synovial carcinoma2 and B cell lymphoid malignancies3, respectively. However, although CAR-T cells expand in vivo in patients with B cell leukemia and can persist up to 24 months post infusion4, in solid tumors, the suppressive tumor microenvironment (TME) usually hinder T cell expansion and persistence within by multiple factors, such as inducing checkpoint inhibition5 and metabolic starvation6 of T cells.
T cell proliferation requires optimal T cell activation, which integrates signals downstream of the T cell receptor (TCR)/CD3 complex, engagement of costimulatory molecules and cytokines7. CAR-based engineering provides stimulation through the TCR/CD3 complex and costimulatory molecules, whereas TCR-based engineering provides TCR engagement without adequate costimulation7. The cytokine component is a limiting factor for both TCR- and CAR-engineering strategies. The major pro-proliferative cytokine secreted by engineered T cells is interleukin 2 (IL2), which may however support the activation and expansion of regulatory T cells (Treg cells)8, limiting anti-tumor effects. T cells have been engineered to express common γ chain cytokines such as IL15 in addition to the CAR, which is effective in supporting their proliferation and effector function, while having only limited effects on Treg cells9,10. However, this type of cytokine engineering can lead to side effects, as these cytokines are constitutively produced and their receptors are expressed by most T cells and natural killer (NK) cells, requiring the inclusion of safety switches to contain potential toxic effects11–13. Thus, the development of inducible and selective engineering processes supporting T cell expansion and survival within the TME remain critical in adoptive T cell therapies in solid tumors for both TCR and CAR-engineered T cells.
Most of the studies on cytokines to support T cell immunotherapies focus on STAT5 inducing cytokines, such as IL2 and IL159,10,14,15. Recent studies showed that STAT3 signaling enhances CAR-T cell effector function in pre-clinical models16 and it is associated with better clinical outcome in patients with chronic lymphocytic leukemia17. IL23 is one of the STAT3 activating cytokines and consists of IL23α p19 and IL12β p40 subunits18, both expressed by activated macrophages and dendritic cells19,20. IL23 is known to promote the proliferation of memory T cells, and especially Th17 cells expressing the IL23R19,21,22. In particular, skewing CAR-T cells towards a Th17 profile by including the ICOS endodomain into the CAR construct has been shown to augment their antitumor activity23. Here, we found activation-induced expression of the IL23R and IL23α p19 subunit in T cells, which allowed us to couple the release and activity of IL23 with T cell activation by supplementing the IL12β p40 subunit to T cells. p40-expressing T (p40-Td) cells produce IL23 upon T cell activation, which drives T cell proliferation and survival. Incorporating p40 in CAR- or TCR-engineered T cells enhanced their antitumor activity in xenograft and syngeneic mouse models. Furthermore, IL23 produced by p40-Td cells functions predominantly through an autocrine mechanism with limited effects on bystander cells. Our approach provides robust and selective proliferative signaling to adoptively transferred tumor-specific T cells within the TME.
Results
TCR/CD28 stimulation upregulates the expression of IL23R in T cells.
We first evaluated whether the IL23R is expressed in T cells expanded ex vivo following procedures used to generate CAR T cells for clinical use and that expand T cells phenotypically resembling memory T cells24 (here collectively called ex-TM cells, expressing CD45RO, CD27 and CD28 phenotypic markers. While ex-TM cells expanded ex vivo at day 10 - 12 and rested from cytokines express low level of IL23R, stimulation of ex-TM cells with αCD3/αCD28 antibodies upregulates IL23R expression at both mRNA and protein levels (Fig. 1a–b). IL23R expression in ex-TM cells is functional because recombinant IL23 supports the expansion of activated ex-TM cells, as previously observed in IL23R+ Th17 cells25, while ex-TM cells are irresponsive to IL23 in the absence of TCR/CD28 stimulation (Fig. 1c). Furthermore, ex-TM cells responding to IL23 were not polarized to Th17 cells as they show similar CD4 and CD8 ratio as untreated T cells (Fig. 1d), retain a type I cytokine production profile (Fig. 1e), and show similar T-bet/RORγT expression26 (Fig. 1f). This lack of Th17 polarization may be attributed to the restricted plasticity of ex-TM cells and/or requirement of additional Th17 skewing cytokines such as TGFβ, IL6 and IL1β reported previously27. This selective activity of IL23 without skewing towards a pathogenic Th17 subset prompted us to explore whether the IL23/IL23R axis can be exploited to support the expansion of activated T cells within the TME.
Figure 1. IL23 supports the expansion of T cells in an activation-inducible dependent manner.
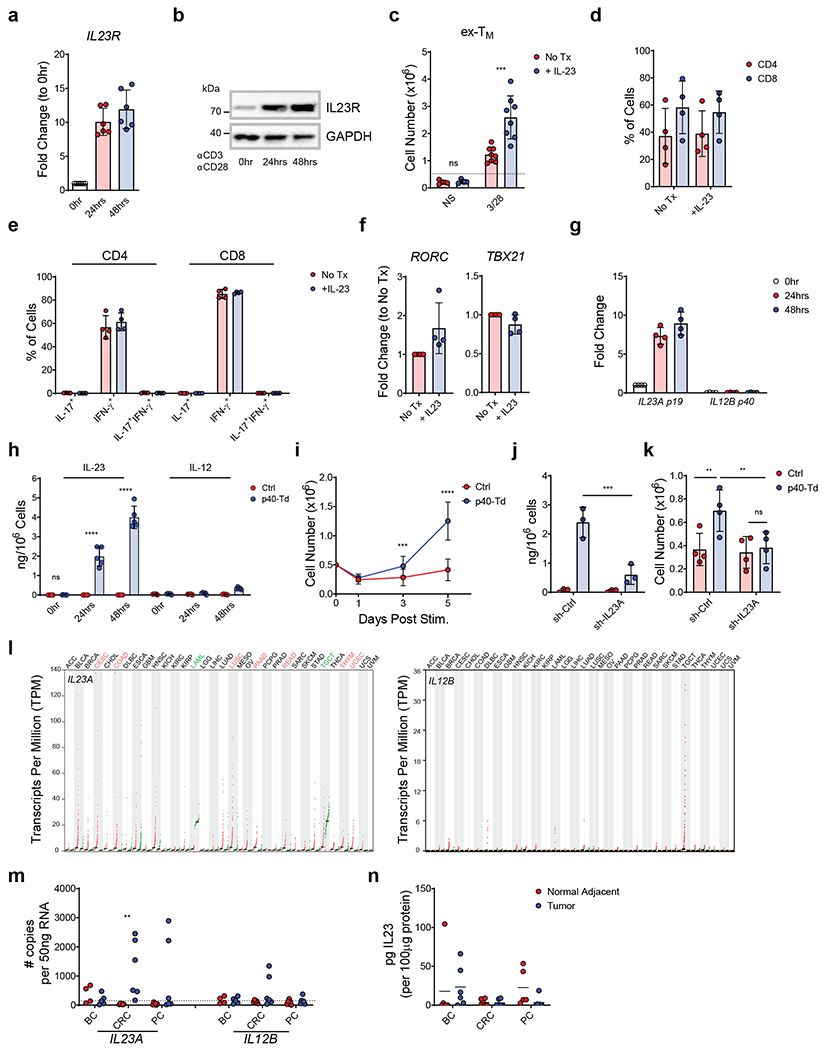
(a,b) IL23R expression at mRNA (a) and protein level (b) measured by qRT-PCR and western blot, respectively in human T cells activated and expanded ex vivo (ex-TM) at time 0, 24, 48 hours after TCR activation. Data are represented as fold change in expression normalized to the housekeeping gene 18S and to the expression at time 0. Data shown are individual values and mean ± SD (n = 6 in (a) and n = 5 in (b)). (c) Expansion of ex-TM cells with or without activation with αCD3 and αCD28 Abs and with or without rIL23 (50 ng/mL). Cell numbers were numerated by flow cytometry at day 7. Data shown are individual values and mean ± SD (n = 4), ***p=0.0002 determined by repeated measured 2-way ANOVA with Sidak post hoc test. (d) Distribution of CD4+ and CD8+ T cells in ex-TM cells activated with αCD3 and αCD28 Abs in the presence or absence of 50 ng/mL rIL23 at day 7. Data shown as mean ± SD (n = 4). (e) Intracellular detection of IFN-γ and IL-17 in CD4+ and CD8+ T cells in ex-TM cells activated with αCD3 and αCD28 Abs in the presence or absence of 50 ng/mL rIL23 for 7 days. Data shown as or individual values, mean ± SD (n = 4). (f) Relative expression of the Th17 and Th1 transcription factor RORγT and Tbet, respectively assessed by qRT-PCR in ex-TM cells activated with αCD3 and αCD28 Abs in the presence or absence of 50 ng/mL rIL23 for 7 days. Data shown as individual values, mean ± SD (n = 4). (g) mRNA expression of the IL23 subunits p19 (IL23A) and p40 (IL12B) in ex-TM cells activated with αCD3 and αCD28 Abs at time 0, 24, 48 hours as determined by qRT-PCR. Data are expressed as fold change in expression normalized to the housekeeping gene 18S and to the expression at time 0. Data shown as individuals and mean ± SD (n = 4). (h) Detection of IL23 secreted by Ctrl cells or p40-Td cells activated with αCD3 and αCD28 Abs for 0, 24 and 48 hours as measured by ELISA. Data shown as individuals and mean ± SD (n = 5). ****p<0.0001 determined by repeated measured 2-way ANOVA with Sidak post hoc test. (i) Numeric expansion of Ctrl cells and p40-Td cells activated with αCD3 and αCD28 Abs. Data shown as mean ± SD (n = 13). ***p=0.0006, ****p<0.0001 determined by repeated measured 2-way ANOVA with Sidak post hoc test. (j) Detection of IL23 secreted by activated Ctrl cells and p40-Td cells co-transduced with either the vector encoding control shRNA (sh-Ctrl cells) or IL23A-shRNA (sh-IL23A). Data shown as individual values and mean ± SD (n = 3). ***p=0.0002 determined by repeated measured 2-way ANOVA with Sidak post hoc test. (k) Cell counts at day 5 of sh-Ctrl cells or sh-IL23A cells activated with αCD3 and αCD28 Abs. Data shown as individual values and mean ± SD (n = 4). **p=0.0069 for Ctrl cells:sh-Ctrl cells vs. p40-Td cells:sh-Ctrl cells and **p=0.0056 for p40:sh-Ctrl cells vs. p40-Td cells:sh-IL23A cells, determined by repeated measured 2-way ANOVA with Sidak post hoc test. (I) Expression (transcript per million) of IL23A (left) and IL12B (right) mRNA in the tumor (red dots) and adjacent normal tissues (green dots) from different cancer patients plotted using TCGA data. Tumor types highlighted in red indicate higher expression in tumor tissues vs. normal tissues, while those highlighted in green indicate lower expression. (m) Expression of IL23A and IL12B genes determined by qRT-PCR in breast cancer (BC), colon rectal cancer (CRC) and pancreatic cancer (PC) and paired adjacent normal tissues. Data are shown as copies of RNA per 50 ng RNA (n = 6). Dotted line indicates the detection limit of the qRT-PCR assay used (CT > 35). **p=0.0019 was determined by 1-way ANOVA with Sidak post hoc test. (n) Detection of IL23 by ELISA in the supernatant of single cell suspension of paired tumors and adjacent normal tissues. Data are shown as pg of IL23 per 100 μg supernatant protein input, individual values and mean ± SD (n = 6).
Functional engineering of the IL23/IL23R axis in T cells.
Unexpectedly, we observed that ex-TM cells upregulate the IL23α p19 subunit upon TCR stimulation, but not the IL12β p40 subunit (Fig. 1g). The observed inducible expression of both IL23R and IL23α p19 subunit in ex-TM cells in response to TCR stimulation offers the unique opportunity to genetically engineer these cells with the IL12β p40 subunit to produce and utilize IL23 upon TCR stimulation. We have supplemented the p40 subunit to ex-TM cells via gamma retroviral transduction to generate p40-expressing T (p40-Td) cells (Supplementary Fig. 1a). p40-Td cells, but not empty vector-transduced T (Ctrl) cells, secrete IL23 upon TCR stimulation (Fig. 1h). Of note, p40-Td cells released limited amount of IL12 (~ 200 pg/mL/106 cells), a cytokine that shares the p40 subunit with IL2322 (Fig. 1h). In the absence of TCR/CD28 stimulation, p40-Td and Ctrl cells showed comparable phenotypic characteristics and expansion in culture (Supplementary Fig. 1b–e). In contrast, p40-Td cells showed superior expansion upon TCR/CD28 activation as compared to Ctrl cells (Fig. 1i). This effect can be attributed to both increased cell division (Supplementary Fig. 2a–b) and reduced apoptosis (Supplementary Fig. 2c). IL23-mediated responses of p40-Td cells requires the endogenous IL23α subunit because knockdown of the IL23A gene abolishes both IL23 production (Fig. 1j) and IL23-mediated T cell expansion (Fig. 1k) of p40-Td cells. Even if p40-Td cells produce IL12, the amount produced is low and does not induce IL12 signaling in activated naïve CD4+ T cells (Supplementary Fig. 3a–b). Moreover, IFN-γ production and TBX21 gene expression are comparable in activated Ctrl and p40-Td cells (Supplementary Fig. 3c–d), confirming the absence of IL12 signaling in p40-Td cells. Due to this unique activation-inducible nature of IL23R and IL23A expression, we further characterized the kinetics of their upregulation and IL23 secretion. We found that both gene upregulation and IL23 secretion are tightly linked to T cell activation. IL23R/IL23A expression and IL23 secretion continued to increase upon continued T cell stimulation up to day 5, but declined to baseline when T cells were removed from the stimulation (Supplementary Fig. 4a–c). Furthermore, we also determined whether T cell activation through native TCR-MHC/peptide engagement also induces IL23R/IL23A expression. We used T cells transduced with the tyrosinase TCR28, and cocultured them with T2 cells pulsed with tyrosinase peptide for 24 hours. We found that both IL23R and IL23A were induced upon TCR engagement (Supplementary Fig. 4d), albeit at a lower level (for IL23A) compared to stimulation by αCD3/αCD28 antibodies (Fig. 1g).
Previous studies showed elevated IL23A mRNA levels in tumor biopsies, suggesting the potential role of IL23 in tumor progression, especially in colorectal carcinoma (CRC)29,30. However, as a heterodimeric protein, both IL23α and IL12β subunits must be present in the same cell to produce and release IL23. Analysis of RNA-sequencing data from The Cancer Genome Atlas (TCGA) showed that while the IL23A transcript is upregulated in many tumor specimens, the IL12B transcript is barely detectable in both tumor and normal tissue specimens (Fig. 1l), predicting the absence of IL23 within the TME. We also measured the expression of the IL23 subunits at both mRNA and protein levels with qPCR and ELISA, respectively in 18 tumor specimens (CRC, pancreatic ductal adenocarcinoma (PDAC) and breast cancer (BC)). While IL23A gene is upregulated in CRC tumor specimens, IL12B was not expressed (Fig. 1m) and IL23 protein was absent in most of the supernatants obtained from CRC specimens (Fig. 1n). Therefore, IL23 p40 engineering of T cells may support T cell expansion in a TCR activation dependent manner within the TME that is deprived of IL23.
Transcriptome analysis of activated p40-Td cells reveals enriched STAT3 and hypoxia gene signature.
We performed RNA-Seq analysis to define the molecular pathways involved in p40-Td cells. Ctrl cells and p40-Td cells shared similar gene expression profile in the absence of TCR stimulation (Fig. 2a). In contrast, after TCR activation, p40-Td cells showed a different molecular signature as compared to Ctrl cells (Fig. 2a–c), indicating the requirement of TCR stimulation to fully exploit the effects of the engineered IL23/IL23R axis in ex-TM cells. Specifically, gene set enrichment analysis (GSEA)31 showed a significant enrichment of STAT3 upregulated genes in activated p40-Td cells and STAT3 downregulated genes in Ctrl cells (Fig. 2d), suggesting an elevated STAT3 activity in p40-Td cells. The molecular signature was validated by detecting increased STAT3 phosphorylation in activated p40-Td cells (Fig. 2e), and differential expression of STAT3 regulated genes (SOX2, SOCS3, CEBPD, ABCA1, IFIT1, IFIT3, USP18 and CDKN2B) (Fig. 2f). Furthermore, we observed an enrichment of genes within the hypoxia hallmark gene set in TCR stimulated p40-Td cells as compared to Ctrl cells (Fig. 2g) and mRNA upregulation of hypoxia-inducible factors (HIFs) and other HIF target genes (Fig. 2h). Overall, these data highlight the activation of the STAT3 pathway upon TCR activation in p40-Td cells, indicating a dominant role of IL23 signaling in these cells.
Figure 2. T cell receptor activation induces STAT3 and hypoxia gene signature in p40-Td cells.
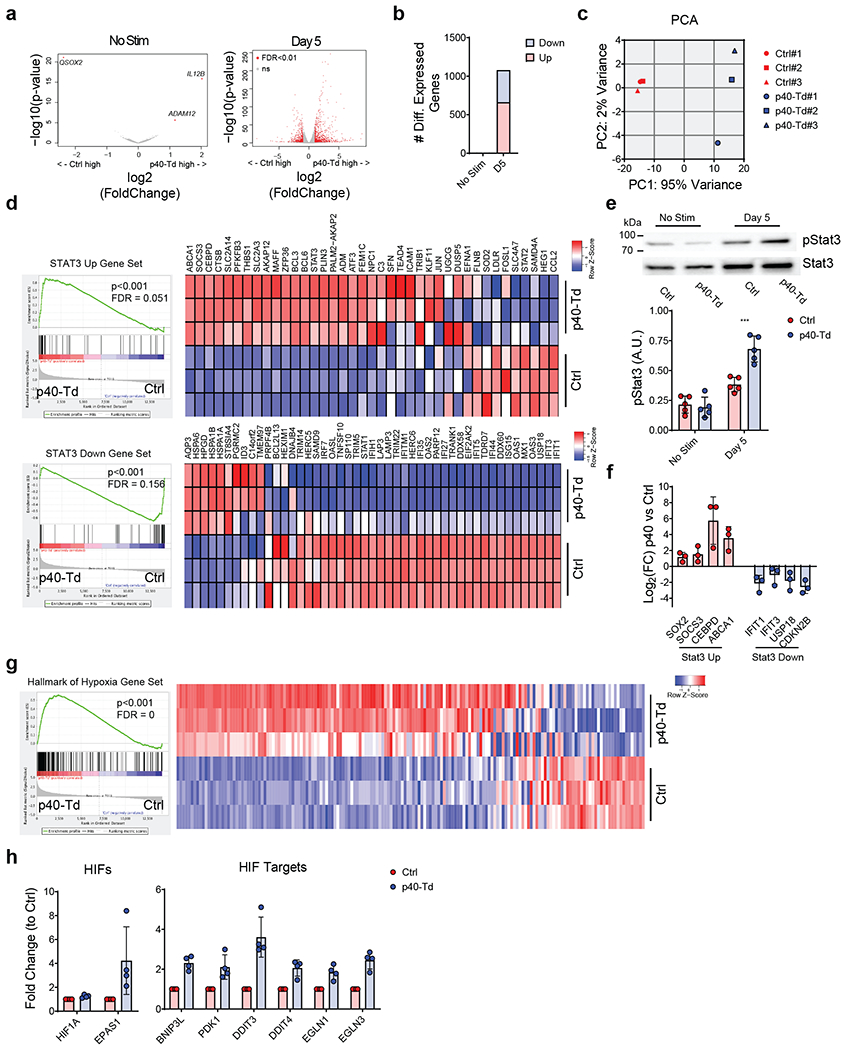
(a) Volcano plot of gene expression before (left) and 5 days after activation (right) with αCD3 and αCD28 Abs of Ctrl cells and p40-Td cells (n = 3). Volcano plot was constructed using log2fold change and −log10(FDR) of all genes. Red dots represent genes with more than 2-fold change (up or down) and FDR<0.01. (b) Number of differentially expressed genes before and after stimulation of Ctrl cells and p40-Td cells. (c) Principal component analysis (PCA) of activated Ctrl cells and p40-Td cells (n = 3). (d) GSEA for the expression profiles of the activated Ctrl cells as compared to activated p40-Td cells using “STAT3 upregulated” (up) and “STAT3 downregulated” (down) gene sets and the expression heatmap of genes in the gene sets (n = 3). The nominal p values and FDR q values were calculated by GSEA software (Broad Institute). (e) Representative western blot showing Ser727 and Tyr705 phosphorylation of STAT3 in Ctrl cells and p40-Td cells before and 5 days after stimulation with αCD3 and αCD28 Abs (upper panel). Densitometry of pSTAT3 (lower panel), mean ± SD (n = 5). ***p=0.0001 determined by repeated measured 2-way ANOVA with Sidak post hoc test. (f) qRT-PCR quantification of upregulated (red) or downregulated (down) genes STAT3 pathway related. Data were first normalized to housekeeping gene 18S and the mean ± SD log2fold change of gene expression of activated Ctrl cells vs. p40-Td cells (n = 4) were shown. (g) GSEA for the expression profiles of activated Ctrl cells and p40-Td cells using “hallmark of hypoxia” gene set (left panel) and expression heatmap of genes in the gene sets (right panel) (n = 3). The nominal p values and FDR q values were calculated by GSEA software (Broad Institute). (h) qRT-PCR quantification of hypoxia pathway related genes in activated Ctrl cells and p40-Td cells. Data were first normalized to housekeeping gene 18S and then to the expression level to Ctrl cells. Data shown as individual values and mean ± SD (n = 4).
p40 expression enhances the anti-tumor activity of CAR T cells in xenograft models of solid tumors.
We assessed whether IL23 p40 expression in CAR T cells improves their antitumor activity. We expressed p40 in CAR T cells (CAR.p40-Td) targeting the GD2 antigen expressed in neuroblastoma (NB) (Supplementary Fig. 5a–b). CAR.p40-Td cells showed robust expansion (Supplementary Fig. 5c) and reduced apoptosis (Supplementary Fig. 5d) when stimulated in vitro with an anti-idiotype antibody that crosslinks the CAR32, as compared to control CAR T cells (CAR.Ctrl cells). IL23 was only detected in activated CAR.p40-Td cells, while IL2 secretion remained unchanged (Supplementary Fig. 5e). The anti-tumor effects of CAR T cells in vitro was assessed using repetitive tumor co-culture assays in which human NB cell lines (LAN-1 or CHLA-255) were used at high tumor to T cell ratio (Supplementary Fig. 6a). In this stress culture condition test, CAR.Ctrl cells failed to control tumor growth after the first/second round of co-culture, while CAR.p40-Td cells remain effective (Fig. 3a–b). In parallel, the number of CAR.Ctrl cells gradually reduced after each round of co-culture, while CAR.p40-Td cells persisted and retained CAR expression (Fig. 3c–d and Supplementary Fig. 6b). In addition to enhanced proliferation, the CAR.p40-Td cells showed superior effector function at individual cell level. Specifically, CAR.p40-Td cells expressed higher level (percentage and MFI) of the lytic enzyme granzyme B (Fig. 3e) and reduced expression of the exhaustion markers PD1 and CD10133 (Fig. 3f), as compared to CAR.Ctrl cells. In addition, after repeated stimulation, CAR.Ctrl cells underwent progressive reduction of T cells producing IFNγ and TNFα, an indicator of functional exhaustion34, while CAR.p40-Td cells continued to produce IFNγ and TNFα (Fig. 3g). In a metastatic NB model in NOD/SCID/IL-2Rnull (NSG) mice, treated with suboptimal doses (2 × 10⁶ cells) of CAR T cells, CAR.p40-Td cells promoted enhanced tumor control and improved survival as compared to CAR.Ctrl cells (Fig. 3h–k). Consistently, CAR.p40-Td cells showed superior initial expansion (day 10) in vivo in peripheral blood, spleen and liver (Fig. 3l), and prolonged persistence in the same organs at the time of euthanasia (Fig. 3m). When a higher dose (4 × 10⁶ cells) of CAR T cells was used in tumor-bearing mice, both CAR.Ctrl cells and CAR.p40-Td cells promoted tumor regression (Fig. 3n–p), but only the mice receiving CAR.p40-Td cells were protected from tumor re-challenge 4 weeks after T cell treatment (Fig. 3n–p). Notably, the enhanced anti-tumor activity provided by p40-overexpression is not restricted to CAR T cells cultured ex vivo with IL7 and IL15 (Supplementary Fig. 6c) nor to CAR T cells encoding CD28 costimulatory endodomain (Supplementary Fig. 7). Moreover, the enhanced anti-tumor activity of CAR.p40-Td cells was confirmed in a PDAC model using CAR T cells targeting the B7-H3 antigen (Supplementary Fig. 8)35. CAR.p40-Td cells showed superior anti-tumor effects and better persistence in stressed coculture conditions against the human PDAC cell line BXPC-3 compared to CAR.Ctrl cells (Fig. 4a–b). Furthermore, in an orthotopic PDAC model using the BXPC-3 cell line that constitutively express high level of PD-L1 and is more resistant to CAR T cell effects35, CAR.p40-Td cells showed superior anti-tumor effects and better persistence when compared to CAR.Ctrl cells (Fig. 4c–g and Supplementary Fig. 8b–c). Therefore, p40 engineering of CAR T cells promotes anti-tumor activity sustaining T cell persistence and expansion.
Figure 3. p40 expression enhances the anti-tumor activity of CAR T cells in a neuroblastoma model.
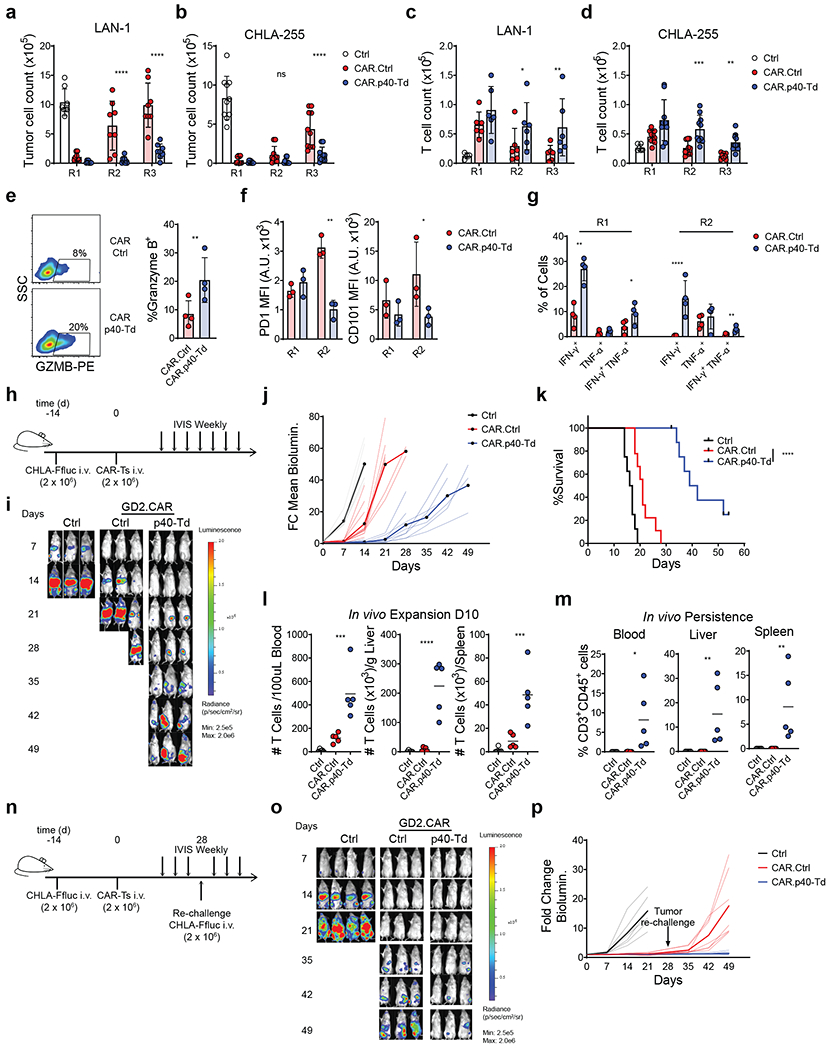
(a-b) Counts of neuroblastoma tumor cells (LAN-1 and CHLA-255) after each round of repetitive coculture (R1, R2 and R3) with either control T cells (Ctrl.), GD2-specific CAR T cells (CAR.Ctrl) or GD2-specific CAR T cells coexpressing p40 (CAR.p40-Td). Data shown as individual values and mean ± SD (n = 8). ****p<0.0001 determined by repeated measure 2-way ANOVA with Sidak post hoc test. (c-d) T cell counts after each round of repetitive coculture illustrated in (a-b). Data shown as individual values and mean ± SD (n = 8). *p=0.03 for LAN1 R2; **p=0.0049 for LAN1 R3; ***p=0.0003 for CHLA-255 R2; **p=0.0091 for CHLA-255 R3 determined by repeated measure 2-way ANOVA with Sidak post hoc test. (e) Intracellular staining of granzyme B of CAR.Ctrl cells and CAR.p40-Td cells at the end of R1. Data shown as individual values and mean ± SD (n = 3). **p=0.0052 determined by two-sided paired t test. (f) Expression of PD1 and CD101 in CAR.Ctrl cells and CAR.p40-Td cells after R1 and R2 of repetitive coculture with LAN-1 tumor cells. Data shown as individual values and mean ± SD (n = 3). **p=0.0014 for PD1 R2; *p=0.0365 for CD101 R2 determined by repeated measure 2-way ANOVA with Sidak post hoc test. (g) Intracellular staining of IFN-γ and TNF-α of CAR.Ctrl cells and CAR.p40-Td cells at the end of R1 and R2 of coculture with LAN1 tumor cells. Data shown as individual values and mean ± SD (n = 3). **p=0.002 for IFN-γ+ cells at R1; *p=0.0409 for IFN-γ+TNF-α+ cells at R1; ****p<0.0001 for IFN-γ+ cells at R2; **p=0.009 for IFN-γ+TNF-α+ cells at R2 determined by repeated measure 2-way ANOVA with Sidak post hoc test. (h) Schematic representation of the metastatic neuroblastoma xenograft model. (i) Representative tumor bioluminescence (BLI) of 2 independent experiments. (j) Kinetics of tumor BLI of 2 independent experiments (n = 8 mice/group for Ctrl group, n = 9 mice/group for CAR.Ctrl and CAR.p40-Td groups). Solid lines delineate mean fold change over time, while dashed lines indicate data of each individual mouse. (k) Kaplan-Meier survival curve summarizing 2 independent experiments (n = 8 mice/group). (l) Frequency of human CD3+CD45+ cells in blood, spleen and liver collected 10 days post T cell infusion. Data shown as individual values, mean ± SD (n = 5 mice/group) and are representative of 2 experiments. ***p=0.0006 for blood; ****p<0.0001 for liver and p=0.0007 for spleen determined by 1-way ANOVA with Sidak post hoc test. (m) Frequency of human CD3+CD45+ cells in blood, spleen and liver collected at the time of mouse euthanasia (median collection time: 18, 22 and 52 for Ctrl, CAR.Ctrl and CAR.p40-Td group, respectively). Data shown as individual values, mean ± SD (n = 5 mice/group) and are representative of 2 experiments. *p=0.0132 for blood; **p<0.0067 for liver and p=0.0071 for spleen determined by 1-way ANOVA with Sidak post hoc test. (n) Schematic representation of the metastatic neuroblastoma xenograft model and tumor rechallenge. (o) Representative tumor BLI of 2 independent experiments. (p) Kinetics of tumor BLI of 2 independent experiments (n = 6 mice/group for Ctrl, n = 7 mice/group for CAR.Ctrl and CAR.p40-Td groups). Solid lines delineate mean fold change over time, while dashed lines indicate data of each individual mouse.
Figure 4. p40 expression enhances the anti-tumor activity of CAR T cells in a pancreatic cancer model.
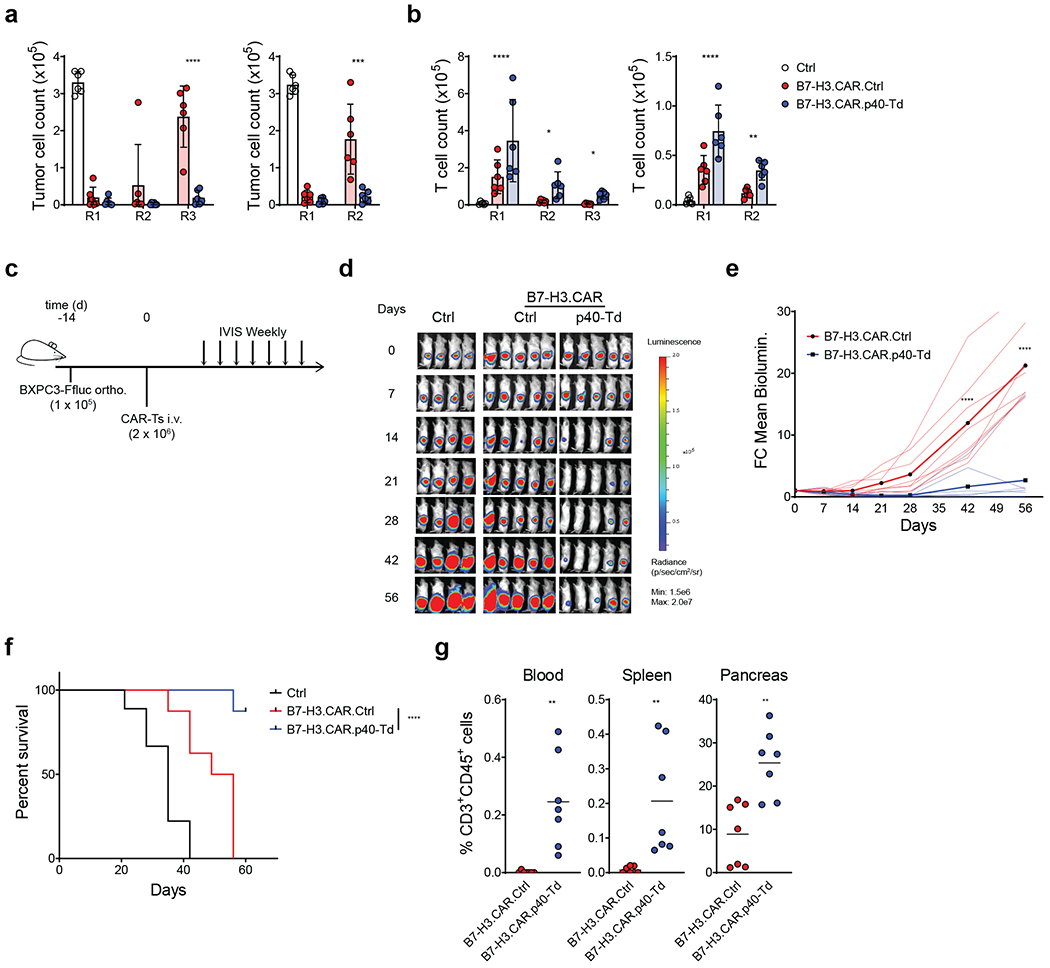
(a) Counts of pancreatic cancer cell (BXPC-3) after each round of repetitive coculture (R1, R2 and R3) with either control T cells (Ctrl.), B7-H3-specific CAR T cells (CAR.Ctrl) or B7-H3-specific CAR T cells coexpressing p40 (CAR.p40-Td) at T cell to tumor cell ratios 1:2 (left panel) or 1:5 (right panel). Data shown as individual values, mean ± SD (n = 6). ***: p=0.0003, ****: p<0.0001 determined by repeated measured 2-way ANOVA with Sidak post hoc test. (b) T cell counts after each round of repetitive coculture illustrated in (a). Data shown as individual values and mean ± SD (n = 6). *: p=0.0195 for R2, p=0.021 for R3, **: p=0.0024, ****: p<0.0001 determined by repeated measured 2-way ANOVA with Sidak post hoc test. (c) Schema of the orthotopic pancreatic cancer model. (d) Representative tumor BLI of 2 independent experiments (n = 8 mice/group). (e) Kinetics of tumor BLI of 2 independent experiments (n = 8 mice/group). Solid lines delineate mean fold change over time, while dashed lines indicate data of each individual mouse. (f) Kaplan-Meier survival analysis of 2 independent experiments (n = 8 mice/group). (g) Frequency of human CD3+CD45+ cells in blood, spleen and pancreas collected from mice at day 60 post T cell infusion. Data shown as individual values and mean (n = 7 mice/group for 2 independent experiments **: p=0.0017 for blood, p=0.00065 for spleen and p=0.0014 for tumor) determined by two-sided unpaired Student t-test.
Incorporation of p40 in murine T cell promotes local effects of IL23 in syngeneic tumor models of melanoma and pancreatic cancer.
To evaluate the effects of IL23 in immune replete mice, we implemented syngeneic tumor models. We first confirmed that IL23R, IL23A, but not IL12B genes are inducible in ex vivo activated murine T cells that resemble human ex-TM cells generated for adoptive T cell transfer (Fig. 5a–b). Recapitulating the observation in human ex-TM cells, gene transfer of the murine IL12B in murine T cells resulted in the activation inducible IL23 secretion (Fig. 5c), and enhanced T cell expansion in vitro upon TCR stimulation (Fig. 5d). We tested the anti-tumor effects of murine T cells expressing the murine p40 subunit using the B16-OVA melanoma mouse model and adoptive transfer of ex vivo expanded OT1 T cells (Fig. 5e). When B16-OVA bearing mice were treated with suboptimal doses (1 × 10⁶ cells/mouse) of OT1 T cells, OT1 T cells engineered to express p40 (OT1-mp40-Td cells) had superior tumor control as compared to OT1 T cells transduced with the empty vector (OT1-EV) (Fig. 5f left). Treatment with a higher dose (2 ×10⁶ cells/mouse) of OT1-mp40-Td cells showed sustained tumor control up to 30 days post tumor inoculation (Fig. 5f right). Notably, IL23 was only detected in the supernatant obtained from the tumor, but not in the serum of mice treated with OT1-mp40-Td cells (Fig. 5g). Correspondingly, in mice infused with OT1-mp40-Td cells, we observed higher percentage of CD8+ OT1 T cells within the tumor, but not in the blood, spleen and tumor draining lymph nodes (dLN) where the frequency of OT1 T cells was similar to mice receiving control OT1-EV T cells (Fig. 5h). Furthermore, no alteration in the composition of CD4 and CD8 T cells, B cells, NK cells and myeloid cells was observed in the blood, spleen, tumor and draining lymph nodes (Fig. 5i). To further validate our approach using CAR T cells, we used our previously established syngeneic PDAC model and B7-H3-specific CAR T cells35 (Fig. 5j). Specifically, the KPC PDAC cell line expressing murine B7-H3 was orthotopically engrafted in C57BL/6 mice. As previously reported, the engrafted tumors host a comprehensive immune microenvironment that includes B cells, regulatory T cells, macrophages, Gr1+ myeloid derived suppressor cells and also tumor associated fibroblasts (Supplementary Fig. 9)36–38. Upon engraftment, mice were treated with murine T cells expressing the B7-H3-specific CAR (Supplementary Fig. 10) co-expressing either an empty vector (B7-H3.CAR.EV) or the murine p40 subunit (B7-H3.CAR.mp40-Td). Mice treated with B7-H3.CAR.mp40-Td cells showed significantly better tumor control as compared to mice treated with B7-H3.CAR.EV cells (Fig. 5k). Collectively, we demonstrated that p40 engineering in murine T cells expressing either a tumor specific TCR or CAR exert a local effect that enhances their anti-tumor activity without disturbance of global immune composition.
Figure 5. p40 expression enhances the anti-tumor activity of T cells in syngeneic tumor models.
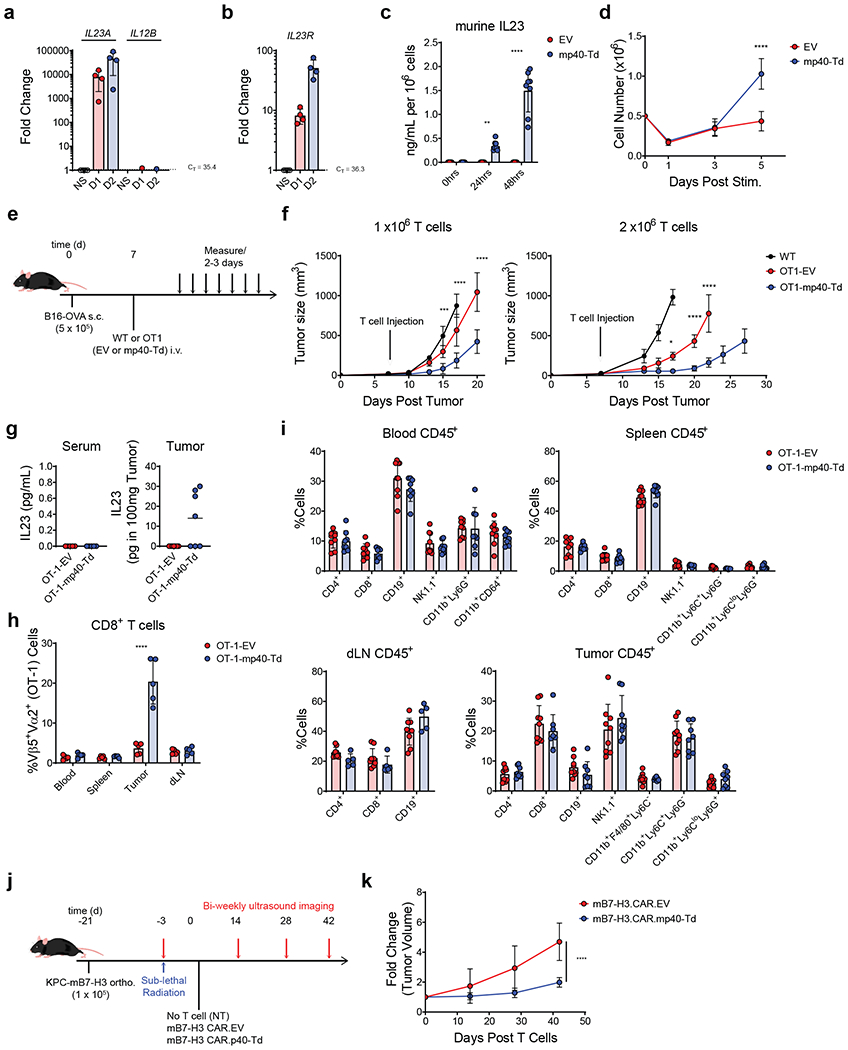
(a-b) Expression of IL23A, IL12B (a) and IL23R (b) genes determined by qRT-PCR in ex vivo activated and expanded murine splenic T cells after re-stimulation with αCD3 and αCD28 Abs for 0, 24 and 48 hours. Data shown as fold change in gene expression normalized to the housekeeping gene CD3E and to the value at time 0. Data shown are individual values and mean ± SD (n = 4). (c) Measurement of murine IL23 released by murine splenic T cells transduced either with the empty vector (EV) or the vector encoding murine IL12B gene (mp40-Td) and re-stimulated with αCD3 and αCD28 Abs for 0, 24 and 48 hours. Data shown are individual values and mean ± SD (n = 8). (d) Cell counts of EV and mp40-Td murine T cells at day 1, 3 and 5 after re-stimulation with αCD3 and αCD28 Abs. Data shown are mean ± SD (n = 3). ****: p<0.0001 determined by repeated measured 2-way ANOVA with Sidak post hoc test. (e) Schematic representation of the syngeneic B16 melanoma model. (f) Measurement of the tumor volume post tumor engraftment. Data shown as mean ± SD of 2 independent experiments. For experiment with 1 × 10⁶ T cells, n = 5 mice/group for WT cells and n = 8 mice/group for OT1-EV cells and OT1-mp40-Td cells. For experiments with 2 × 10⁶ T cells, n = 6 mice/group for WT cells and OT1-EV cells and n = 7 mice/group for OT1-mp40-Td cells. *: p=0.0182; ***: p=0.0007; ****:p<0.0001 determined by 2-way ANOVA with Sidak post hoc test. (g) Detection of murine IL23 in the serum and tumor supernatant collected 14 days after T cell infusion. Data shown as individual values and mean (n = 5 mice/group for serum and n = 7mice/group for tumor). (h) Frequency of OT1 TCR+ (Va2+Vb5+) cells within the CD8+ T cells in the tissues collected from treated mice. Data shown as mean ± SD (n = 5 mice/group). ****p<0.0001 determined by 2-way ANOVA with Sidak post hoc test. (i) Immune composition of the peripheral blood, spleen, draining lymph nodes (dLN) and tumor at the time of euthanasia. Data shown as individual values and mean ± SD of 2 independent experiments (n = 9 mice/group). (j) Schematic representation of the syngeneic PDAC orthotopic model. Murine cell line KPC-4662 engineered to express murine B7-H3 (KPC-mB7-H3) was implanted (0.1 × 10⁶ cells/mouse) into the pancreas of 6 week old C57BL/6 mice. Eighteen days post tumor cell implantation, mice were irradiated with 400 cGy and 3 days later infused i.v. with syngeneic B7-H3.CAR.EV cells (1 × 10⁷ cells/mouse) or B7-H3.CAR.mp40-Td cells (1 × 10⁷ cells/mouse). Tumor growth was monitored by US. (k) Summary of the fold change (compared to day 0) in tumor volume from 2 independent experiments (n = 8 mice/group). ****p <0.0001 determined by 2-way ANOVA with Sidak post hoc test between B7-H3.CAR.EV cells vs B7-H3.CAR.mp40-Td cells at day 42.
CAR T cells equipped with p40 showed superior anti-tumor efficacy and safety than CAR T cells engineered with IL18 or IL15.
Incorporation of cytokines such as IL1839,40,41 and IL1542 into CARs improves the anti-tumor activity of CAR T cells. Therefore, we performed a side-by-side comparison between CAR.p40-Td cells and CAR T cells engineered with either IL18 (CAR.IL18-Td) or IL15 (CAR.IL15-Td). CAR.p40Td cells showed the most significant cell expansion following CAR stimulation in vitro (Supplementary Fig. 11a), while CAR.IL15-Td cells showed some levels of activation-independent cell proliferation as previously described42 (Supplementary Fig. 11b). CAR.p40-Td cells also showed more consistent and prolonged anti-tumor control in the repetitive coculture assay (Supplementary Fig. 11c). In the metastatic neuroblastoma model in immunodeficient mice, using low CAR T cell doses (2 × 10⁶ cells), CAR.p40-Td cells showed better antitumor control without any apparent side effect, as compared to mice treated with CAR.IL18-Td cells or CAR.IL15-Td cells that, despite showing antitumor activity, caused weight loss (Supplementary Fig. 12–13). We further corroborated the superior antitumor activity of p40-Td cells versus IL18 and IL15 in the B16-OVA-OT1 immunocompetent murine model (Supplementary Fig. 14). Collectively, tumor-specific T cells equipped with p40 out-performed tumor-specific T cells co-expressing either IL18 or IL15 for both anti-tumor activity and safety.
Engineered IL23 functions predominantly through an autocrine mode of action.
To better characterize the mode of action of IL23 in p40-expressing T cells, we mixed in vitro p40-Td cells, which are tagged with a truncated form of NGFR (NGFR+)43, with control T cells tagged with a truncated form of CD19 (ΔCD19-Td)44 at 1:1 ratio and stimulated the mixed cells with αCD3 and αCD28 Abs (Fig. 6a). Despite sharing the same culture media containing IL23, expressing comparable levels of IL23R (Fig. 6b) and equally responsive to exogenously supplemented IL23 (Supplementary Fig. 15a), p40-Td cells expanded more than ΔCD19-Td cells (Fig. 6c–d). Similarly, after multiple-round coculture assay with mixed CAR.p40-Td cells and control CAR.ΔCD19-Td cells, CAR.p40-Td cells preferentially expanded in response to tumor cells as compared to control CAR T cells (Fig. 6e–f). To further study the self-beneficial effects of IL23 in p40-Td cells, we evaluated whether IL23 produced by p40-Td cells preferentially binds with the IL23R expressed by p40-Td cells rather than the IL23R expressed by bystander cells. We generated a p40-GFP fusion protein that allow us to track the location of IL23 (p19-p40-GFP heterodimers) produced by T cells (Fig. 6g). We co-cultured p40-GFP-transduced (p40-GFP-Td) T cells with CD19-tagged control T cells and measured the cell surface binding of the p40-GFP fusion protein using an anti-GFP antibody conjugated to a far-red fluorochrome to discriminate true extracellular binding of the p40-GFP protein from the GFP signal within the cells (Fig. 6h). Upon TCR stimulation, both flow cytometry (Fig. 6i) and confocal microscopy (Fig. 6j) showed abundant GFP surface binding on p40-GFP-Td cells, but not on ΔCD19-Td cells, even if the p19-p40-GFP heterodimers can be readily detected in the culture media (Fig. 6g). These data confirm the preferential binding of IL23 to T cells that are producing IL23. One possible explanation for the IL23 preferential binding to IL23-producing T cells is that IL23 is captured by IL23R in p40-Td cells before its diffusion. To test this hypothesis, we used a soluble recombinant human IL23R (rhIL23R) that binds IL23 preventing its engagement with the IL23R expressed by T cells (Supplementary Fig. 15b). We found that even when IL23 in diffusion was fully sequestered, the surface binding of p40-GFP to p40-Td cells remains unchanged as measured by both flow cytometry (Fig. 6k) and confocal microscopy (Fig. 6l). In addition, rhIL23R did not hamper IL23-mediated expansion of p40-Td cells (Fig. 6m), suggesting that the free IL23 does not contribute to the binding nor to the function of IL23 in p40-Td cells. Collectively, these data showed an autocrine mode of action of IL23 that has limited effects on bystander cells.
Figure 6. Engineered IL23 functions predominantly through an autocrine mode of action.
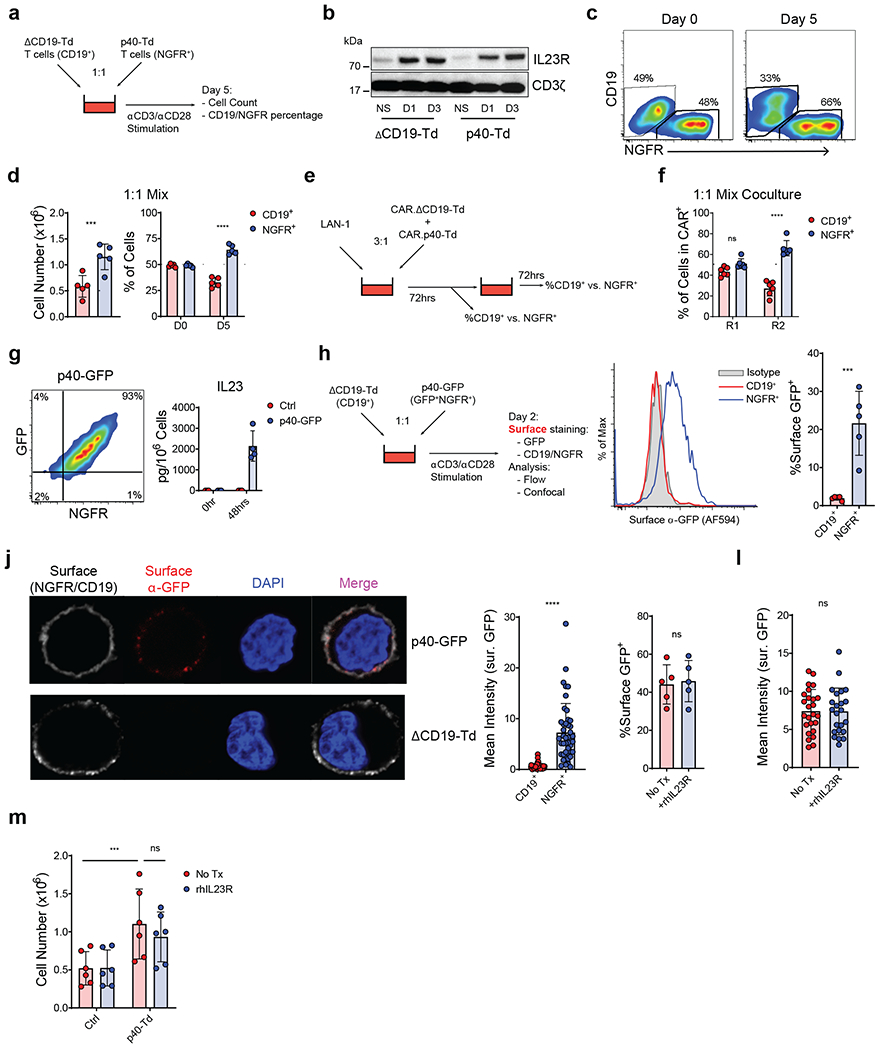
(a) Schematics of the co-activation experiment with p40-Td cells and ΔCD19-Td cells. (b) Representative western blot showing the expression of IL23R in ΔCD19-Td cells and p40-Td cells at days 1 or 3 after activation (n = 3). (c) Representative plot of NGFR+ (p40-Td cells) and CD19+ (bystander cells) at days 0 and 5 post-activation. Data representative of 5 independent experiments. (d) Cell number and percentage of NGFR+ and CD19+ cells 5 days post-activation. Data shown as individual values and mean ± SD (n = 5). Dotted line indicates starting cell number and percentage, respectively. ****p<0.0001 determined by two-sided paired Student t test. (e) Schematics of the sequential coculture of GD2-specific CAR T cells coexpressing either ΔCD19 (CAR.ΔCD19-Td) or p40 (CAR.p40-Td) with the LAN-1 tumor cell line. (f) Percentages of NGFR+ and CD19+ CAR T cells detected at the end of the first (R1) and second (R2) round of coculture. Data shown as individuals and mean ± SD (n = 6). ****: p<0.0001 determined by repeated measured 2-way ANOVA with Sidak post hoc test. (g) Flow plot illustrating the coexpression of NGFR and GFP (left panel) and detection of IL23 in the supernatant (right panel) of T cells transduced with a vector encoding the p40-GFP fusion protein. Data shown as mean ± SD (n = 4). (h) Schematics and staining procedure of the co-activation experiment with p40-GFP cells and ΔCD19-Td cells. (i) Representative flow histograms showing the surface binding of the p40-GFP protein on CD19+ or NGFR+ T cells. Individual values and mean ± SD (n = 5). ***p=0.0003 determined by two-sided paired Student t test. (j) Representative confocal microscopy imaging (left panel) showing the surface binding of p40-GFP protein in CD19+ or NGFR+ cells, representative of 5 independent experiments and quantification (right panels) of fluorescence intensity of the surface GFP signal for CD19+ or NGFR+ cells. Data shown as individual values and mean ± SD (n = 49 cells for CD19+ cells and n = 44 for NGFR+ cells). ****p<0.0001 determined by two-sided paired Student t test. (k,l) Surface binding of p40-GFP in p40-GFP-Td cells in the absence or presence of the soluble recombinant human IL23R (hIL23R) determined by flow cytometry (k) and confocal microscopy (l). Data are presented as individual values and mean ± SD (n = 5 independent experiments for (k) with 25 and 23 analyzed cells for No Tx and +rhIL23R group, respectively, in (l)). (m) T cell numbers of Ctrl cells or p40-Td cells at day 5 post-activation with αCD3 and αCD28 Abs in the absence or in the presence of soluble rhIL23R. Data are presented as individual values and mean ± SD (n = 6). ***p=0.0006 determined by repeated measure 2-way ANOVA with Sidak post hoc test.
Discussions
In this study, we have demonstrated that providing the p40 subunit of IL23 to tumor-specific T cells is sufficient to cause the production and release of IL23. Furthermore, IL23 exerts its function exclusively through activated T cells because both the IL23 production and IL23R expression occur upon T cell activation. This tightly regulated IL23/IL23R engineered pathway is further controlled by an autocrine mode of action of the secreted IL23 that prevents cytokine usage by other bystander immune cells.
The role of IL23 in tumor cell growth remains controversial. Studies showed that low amounts of endogenous IL23 produced by either tumor associated macrophages, dendritic cells or tumor cells may promote inflammation favoring early tumor initiation and progression21,29,30,45. IL23 was also reported to promote metastasis in some CRC models46. On the contrary, high levels of IL23, obtained either by IL23-engineered tumor cells or administration of rIL23, caused anti-tumor effects47,48. Our data in multiple mouse models demonstrated the anti-tumor benefit of IL23, when this cytokine is produced by engineered tumor-specific T cells, while exhibiting no obvious side effects as compared to other previously reported cytokine engineering strategy. Furthermore, we observed that IL23 by itself is not sufficient to promote the differentiation of ex vivo generated tumor-specific T cells into IL17 producing cells, the main culprit for promoting carcinogenesis in IL23 sensitive tumors, such as CRC30.
We have made the unexpected observation that the IL23A p19 gene, but not the IL12B p40 gene, is expressed in ex vivo generated tumor-specific T cells when these cells are activated either via engagement of the endogenous TCR or engagement of an inserted CAR. Furthermore, the observed activation-dependent p19 expression is conserved in both murine and human T cells, and especially in murine T cells where p19 expression is upregulated by more than 10000-fold upon activation. Notably, p19 is sufficiently expressed to allow functional production and release of IL23 if the p40 subunit is provided. To our knowledge, no specific functions have been attributed to the single p19 subunit. It is generally accepted that IL23 in its heterodimer form is assembled intracellularly and that p19 is not secreted as an independent protein nor in association with proteins other than p4018,49. However, one study showed that human gastric carcinoma cells can secret p19 in the absence of p40 subunit50, which implies that the subunit may have IL23 independent functions. While our data suggest that IL23A knockdown does not cause detrimental effects in T cells, a more exhaustive assessment of the function of p19 in T cells is warranted.
The p40 engineering we propose has potential multiple advantages. While a milieu of cytokines supporting T cell survival and proliferation is critical to obtain anti-tumor effects after T cell adoptive therapies, the clinical experience demonstrates that toxic effects secondary to systemic and uncontrolled cytokine spread occur. The proposed p40-enginiering restricts cytokine spread because IL23 is released exclusively upon T cell activation within the TME. In fact, even if the p40 subunit is constitutively expressed in engineered T cells, IL23 is only assembled when the p19 subunit is upregulated in response to T cell activation. Upon secretion within the TME, γc-chain cytokines can be used by a variety of immune cells that express γc-chain receptor, which either amplifies or attenuates T cell-mediated immune responses51,52. In contrast, IL23R expression is much more restricted and T cells releasing IL23 express high levels of IL23R. This scenario was previously modeled in the context of IL2 and regulatory T cells, showing that it favors the preferential capture of the cytokine by its producing cells and limits diffusion and bystander effects53,54. Indeed, IL23 released by p40-enginiered T cells is preferentially bound to the IL23R expressed by the same cells. This model for IL23 was supported by our data showing that soluble IL23R sequestering soluble IL23 did not reduce its binding and activity in p40-Td cells. Therefore, this autocrine mode of action of IL23 further improves the specificity and safety of p40-engineering in tumor specific T cells.
The generation of autologous cellular T cell products in cancer patients has the caveats that T cells may be functionally impaired due to age, specific disease and previous therapies the patient may have received. It was recently shown that in patients with chronic lymphocytic leukemia, which is characterized by the presence of dysfunctional T cells, the activation of the STAT3 signaling pathways correlated with better performance of CAR T cells generated ex vivo16,17. Our data support the beneficial role of STAT3 associated pathways, which are induced by IL23 through p40-engineering. Downstream of STAT3 signaling, we also observed an enrichment of hypoxia related genes in p40-Td cells. We speculate that this effect is possibly due to the cooperative transactivation of STAT3 and HIFs transcription factor55,56. Furthermore, this molecular profile resembles our previously described hypoxia-signature in effector-memory T cells that likely contributes to the proliferative and anti-apoptotic functions of p4024.
In summary, we described a novel strategy to incorporate a highly regulated cytokine signaling into tumor-specific T cells that improves their efficacy. Our approach has substantial translational potential considering it can be used for both CAR- and TCR-engineered T cells because both TCR and CAR activation allows upregulation of the IL23R and p19 subunits and the endogenous p19 subunit can be coupled with the ectopically expressed p40 subunit.
Online Methods
Cell Lines
The CHLA-255 neuroblastoma cell line was provided by L.S. Metelitsa of Baylor College of Medicine57 and the LAN-1 cell line was obtained from M. Brenner at Baylor College of Medicine58. Human PDAC cell line BXPC-3 and T2 cells were purchased from American Type Culture Collection (ATCC). Tumor cell lines were transduced with eGFP or firefly luciferase (Ffluc) for coculture and mouse experiments, respectively as previously described59. Human tumor cell lines in this study (LAN-1, CHLA-255, BXPC-3, T2) were maintained in complete RPMI medium (500mL RPMI-1640 (Gibco), 10% FBS (Germini), 2 mM GlutaMAX (Gibco), 100 unit/mL of Penicillin and 100 μg/mL of streptomycin (Gibco)). Mouse melanoma B16-OVA was provided by Benjamin Vincent at University of North Carolina at Chapel Hill and was maintained in complete RPMI medium with addition of 100μM β-mercaptoethanol (Fisher) and 500ug/mL G418 (Gibco) to maintain OVA expression. Mouse PDAC cell line KPC-mB7-H3 was established and described previously35 and maintained in complete RPMI media. All cell lines were routinely tested for mycoplasma and for surface expression of target antigens.
Plasmid construction and retrovirus production.
The full-length human IL12B (accession number NM_002187.3), human IL18 (accession number NM_001562.4), murine IL12B (accession number NM_001303244.1), murine IL18 (accession number NM_008360.2) and murine IL15 (accession number NM_008357.2) genes were amplified by PCR from cDNA clone purchased from Origene, and cloned into the retroviral vector SFG. Human IL12B and IL18 were then subcloned into SFG vector containing the internal ribosomal entry site (IRES) and truncated NGFR selectable marker (p40(i)NGFR, Supplementary Fig. 1a). As control, we used an empty vector containing the IRES and NGFR gene (Ctrl(i)NGFR). Murine IL12B, IL18 and IL15 were subcloned into SFG vector containing IRES and GFP marker with empty vector (EV) with IRES/GFP as control. The shRNA construct for IL23A gene was purchased from Origene (HuSH-29™) and the promoter and shRNA sequence were amplified by PCR and cloned into SFG vector following a reverse (3’ to 5’) orientation. The p40-GFP fusion protein was generated by fusing the coding region of IL12B (1-328 amino acids) with the GFP gene by fusion PCR and cloned into the SFG(I)NGFR. The CAR constructs used in this study were described previously42,60,61.
Retroviral supernatants used for the transduction were prepared as previously described62. To transduced human T cells, retrovirus with RD114 envelope was used. For murine T cells transduction, retrovirus was generated using packaging vector encoding Eco envelope protein.
Transduction and expansion of human T cells.
Buffy coats from healthy donors were purchased from the Gulf Coast Regional Blood Center, Houston, TX. Peripheral blood mononuclear cells (PBMCs) isolated with Lymphoprep density separation (Fresenius Kabi Norge) were activated on plates coated with 1 μg/mL CD3 (Miltenyi Biotec) and 1 μg/mL CD28 (BD Biosciences) agonistic mAbs. On day 2, T lymphocytes were transduced with retroviral supernatants using retronectin-coated plates (Takara Bio Inc.). To generate CAR.Ctrl, CAR.p40-Td and CAR.IL18-Td cells, a double transduction was performed sequentially (Day 2 CAR transduction, Day 3 Ctrl(i)NGFR or p40(i)NGFR or IL18(i)NGFR transduction). On day 4, transduced T cells were collected from retronectin plate and expanded in complete T cell medium (45% RPMI-1640 and 45% Click’s medium (Irvine Scientific), 10% FBS (Hyclone), 2 mM GlutaMAX, 100 unit/mL of Penicillin and 100 μg/mL of streptomycin) with IL-7 (10 ng/mL; PeproTech) and IL-15 (5 ng/mL; PeproTech), changing medium every 2 - 3 days63. On day 10 - 14 days post transduction, cells are collected for in vitro and in vivo experiments. T cells were cultured in IL-7/IL-15 depleted medium for one days prior to being used in in vitro assays.
Preparation of ex vivo expanded murine T cells.
Murine T cells were isolated using Mojosort T cell isolation kit (Biolegend) from splenocytes obtained from C57BL/6J or C57BL/6-Tg(TcraTcrb)1100Mjb/J (OT1) mice acquired from The Jackson Laboratory or in-house breeding. T cells were then stimulated on plates coated with 1 μg/mL mCD3 (eBioscience) and 1 μg/mL mCD28 mAbs (eBioscience) for 48 hours. Activated murine T lymphocytes were transduced with retroviral supernatants using retronectin-coated plates with the same protocol used to transduce human T cells. After removal from the retronectin plates, T cells were expanded in complete medium (RPMI-1640 (Gibco), 10% FBS (Hyclone), 2mM GlutaMAX, 100 μM β-mercaptoethanol, 100 unit/mL of Penicillin and 100 μg/mL of streptomycin) with IL-7 (10 ng/mL) and IL-15 (5 ng/mL) changing medium every 2 days. On day 5, T cells were collected and used for subsequent assays.
Quantitative real-time PCR.
RNA was extracted from cells with RNeasy Plus Kit (Qiagen), quantified using Nanodrop or Qubit and reverse-transcribed into cDNA using Superscript VILO (Thermo). Quantitative real-time PCR was performed using QuantStudio 6 Flex real-time PCR system (Thermo). Taqman system was used in most assays except for the validation of RNA-Seq analysis (STAT3 regulated and hypoxia pathway genes), which used the SYBR Green system. For comparison of gene expression in human T cells, 18S RNA was used as housekeeping gene for normalization. For assays in mouse T cells, CD3E was used as housekeeping gene for normalization. For assays in patient specimens, absolute quantification of copies was conducted using standard curved generated with plasmid containing IL23A or IL12B cDNA.
The Taqman primers for the following genes were purchased from Applied Biosystem:
human IL23A (assay ID: Hs00372324_m1)
human IL12B (assay ID: Hs01011518_m1)
human 18S RNA (assay ID: Hs03003631_g1)
human IL23R (assay ID: Hs00332759_m1)
human TBX21 (assay ID: Hs00894392_m1)
human RORC (assay ID: Hs01076112_m1)
human IFNG (assay ID: Hs00989291_m1)
murine IL23A (assay ID: Mm00518984_m1)
murine IL12B (assay ID: Mm01288989_m1)
murine CD3E (assay ID: Mm01179194_m1)
murine IL23R (assay ID: Mm00519943_m1)
The SYBR Green primers for the following genes were purchased from Sigma:
| 18S | F: AACCCGTTGAACCCCATT; R: CCATCCAATCGGTAGTAGCG |
| SOX2 | F: ATAATAACAATCATCGGCGG; R: AAAAAGAGAGAGGCAAACTG |
| SOCS3 | F: CCTATTACATCTACTCCGGG; R: ACTTTCTCATAGGAGTCCAG |
| CEBPD | F: CAGACTTTTCAGACAAACCC; R: TTTCGATTTCAAATGCTGC |
| ABCA1 | F: GTGTTTCTGGATGAACCC; R: TTCCATTGACCATGATTGC |
| IFIT1 | F: CTGCCTAATTTACAGCAACC; R: TGATCCAAGACTCTGTTTTC |
| IFIT3 | F: ATGAGTGAGGTCACCAAG; R: CCTTGAAGTTCCAGGTG |
| USP18 | F: TGGTTTACACAACATTGGAC; R: ATCCTCTTCAATATCCTGGTG |
| CDKN2B | F: GACTAGTGGAGAAGGTGC; R: TCATCATGACCTGGATCG |
| HIF1A | F: AAAATCTCATCCAAGAAGCC; R: AATGTTCCAATTCCTACTGC |
| EPAS1 | F: CAGAATCACAGAACTGATTGG; R: TGACTCTTGGTCATGTTCTC |
| BNIP3L | F: AGGCATCTATATTGGAAAGC; R: GCTTACAATGGTCTCAAGTT |
| PDK1 | F: ATGATGTCATTCCCACAATG; R: AAGAGTGCTGATTGAGTAAC |
| DDIT3 | F: CTTTTCCAGACTGATCCAAC; R: GATTCTTCCTCTTCATTTCCAG |
| DDIT4 | F: AATGTAAGAGTAGGAAGGGG; R: ACAGTTCTAGATGGAAGACC |
| EGLN1 | F: CCCAAATTTGATAGACTGCTG; R: ACACCTTTTTCACCTGTTAG |
| EGLN3 | F: ATCATTCATAGCAGATGTGG; R: ATATCTGGTTGCGTAAGAGG |
Immunoblotting analysis.
Cellular protein was extracted from cells using RIPA buffer (Thermo) supplemented with proteinase and phosphatase inhibitor (Thermo). Same amount of protein was separated on pre-cast 4-15% gradient gels (BioRad) by SDS-PAGE and transferred to PVDF membranes (BioRad). The membranes were blocked with 5% Milk in TBS-5% Tween buffer and probed with primary antibodies at 4 degree overnight. Then, the membranes were washed and incubated with secondary antibodies conjugated to HRP. The following primary and secondary antibodies were used: anti-IL23R (Novus Biological 1:1000 Dilution), anti-GAPDH (clone 6C5, Santa Cruz, 1:1000 Dilution), anti-phospho-STAT3(Tyr705) (clone D3A7, Cell Signaling Technology, 1:1000 dilution), anti-phospho-STAT3(Ser727) (clone 6E4, Cell Signaling Technology, 1:1000 Dilution), anti-STAT3 (clone D3Z2G, Cell Signaling Technology, 1:1000 Dilution) and anti-CD3ζ (clone 6B10.2, Santa Cruz, 1:1000 Dilution). Blot images were acquired with ChemiDoc MP system (BioRad) and the densitometry was calculated by Image Lab software (Bio-Rad).
Flow cytometry.
For surface staining, cells were incubated with antibodies at room temperature for 15mins or at 4°C for 30min. For intracellular staining, cells were fixed and permeabilized using Cytofix/CytoPerm (BD Biosciences) for 15mins at room temperature and washed with 1X PermWash (BD Biosciences). Subsequent staining was performed using 1X PermWash as staining and wash buffer. For CellTrace Violet (CTV) staining, cells were labeled with 5uM CTV (Thermo) before culture. In most assays, cells were stained with Zombie Aqua Live/Dead Discrimination dye (Biolegend) to gate out dead cells for analysis.
The following antibodies used for the flow cytometry analysis were obtained from BD Biosciences:
APC-conjugated anti-CD4 (Clone RPA-T4), FITC-conjugated anti-CD8 (Clone RPA-T8), Alexa Fluor 700-conjugated anti-CD8 (Clone RPA-T8), PE-conjugated anti-IL17A (Clone SCPL1362), Alexa Fluor 647-conjugated anti-IFNγ (Clone B27), Alexa Fluor 647-conjugated anti-CD271 (NGFR, Clone C40-1457), APC-conjugated anti-CD45RO (Clone UCHL1), PE-conjugated anti-CD45RA (Clone H100), PE-Cy7-conjugated anti-CD28 (Clone CD28.2), BV421-conjugated anti-CD27 (Clone M-T271), PE-Cy7-conjugated anti-CD279 (PD1, Clone EH12.1), BV711-conjugated anti-Tim3 (Clone 7D3), PE-conjugated anti-CD223 (LAG3, Clone T47-530), Alexa Fluor 647-conjugated anti-Ki67 (Clone B56), PE-conjugated Annexin V, 7AAD, PE-conjugated rat-anti-mouse IgG1 (Clone X56), APC-Cy7-conjugated anti-CD3 (Clone SK7), PE-conjugated anti-granzyme B (Clone GB11), PE-conjugated anti-CD101 (Clone V7.1), PE-conjugated anti-TNF-α (Clone MAB11), PE-conjugated anti-CD45 (Clone HI30). FITC-conjugated rat anti-mouse CD19 (Clone 1D3), APC-Cy7-conjugated hamster anti-mouse CD3e (Clone 145-2C11), PE-conjugated rat anti-mouse Ly6G (Clone 1A8), BV421-conjugated rat anti-mouse Ly6C (Clone AL21), APC-Cy7 rat anti-mouse CD11b (Clone M1/70), PerCP-Cy5.5-conjugated hamster anti-mouse CD11c (Clone HL3), PerCP-Cy5.5-conjugated rat anti-mouse CD4 (RM4-5), PE-conjugated rat anti-mouse Vα2 TCR (Clone B20.1), FITC-conjugated rat anti-mouse Vb5.1 5.2 TCR (Clone MR9-4).
The following antibodies were obtained from Thermo: Alexa Fluor 647-conjugated anti-CD19 (Clone SJ25-C1), Alexa Fluor 594-conjugated anti-GFP (Polyclonal).
The following antibodies were obtained from Biolegend: BV711-conjugated rat anti-mouse CD45 (Clone 30-F11), APC-conjugated rat anti-mouse CD8 (Clone 53-6.7), APC-conjugated rat anti-mouse CD64 (Clone X54-5/7.1), PE-Cy7-conjugated rat anti-mouse F4/80 (Clone BM8).
Flow cytometry data were collected on BD LSRFortessa (BD Biosciences) using BD FACSDIVA software and the flow data were analyzed by FlowJo software (v9.32, Tree Star).
Acquisition and processing of frozen patient tumor samples.
Frozen patient tumor specimens and matching adjacent normal tissues were obtained from the Tissue Procurement Facility at University of North Carolina at Chapel Hill. For RNA extraction, 20-30mg of frozen tissues were lysed using RLT buffer from RNeasy Plus Kit (Qiagen). To extract extracellular protein within interstitial fluid for IL23 ELISA, 40mg of frozen tissues were incubated in DPBS to obtain single cell suspension and the supernatant was collected. Total protein amount was quantified using Bradford assay (Bioard) and 100ug of protein was used for ELISA.
RNA Sequencing and GSEA.
Total RNA was extracted as described above and the library is prepared by the High Throughput Sequencing Facility (HTSF) at University of North Carolina at Chapel Hill using the KAPA Stranded mRNA-Seq Kit (Kapa Biosystem). 12 samples were pooled and sequenced using HiSeq 4000 (Illumina) with high output paired end 50bp setting (>20×106 reads per sample). Sequencing reads were aligned to the human genome (hg38) using STAR aligner (v2.4.2)64 and subsequently quantified using Salmon (v0.8.2)65. The differential expression analysis was conducted using DESeq2 (v3.8)66 running on R (ver 3.5.0). Genes having >1 log2foldchange and an FDR rate less than 0.05 between Ctrl and p40-Td cells are being considered significant.
For visualization of PCA plot, genes with low expression (<20 counts across 6 samples (3 Ctrl and 3 p40-Td cells)) were filtered and data was transformed using regularized-logarithm transformation.
GSEA was performed using the GSEA v2 software (Broad Institute)31 on genes that are differentially expressed between day 5 activated Ctrl and p40-Td cells. Gene sets specified in this study are:
DAUER_STAT3_TARGETS_UP (M12391) – STAT3 Upregulated Genes67
DAUER_STAT3_TARGETS_DN (M13696) – STAT3 Downregulated Genes67
HALLMARK_HYPOXIA (M5891) – Genes upregulated in response to hypoxia
Selected differentially expressed genes in STAT3 or hypoxia pathways identified in RNA-Seq were independently validated using qRT-PCR.
All RNA-Sequencing data will be publicly available before the acceptance of the manuscript.
In vitro repetitive coculture assays.
2.5 × 10⁶ tumor cells (LA-N-1, CHLA-255 and BXPC-3, all labeled with GFP) were seeded in tissue culture treated 12 well plate for 24 hrs. 5 × 10⁴ (E:T = 1:5) or 1.25 ×10⁵ (E:T = 1:2) CAR T cells were then added to tumor cells. After 3-5 days (due to donor variability in cytotoxicity) when tumor cells were completely eradicated (Round 1, R1). All cells in the well were collected and washed with PBS, resuspend in fresh media and added to a new plate seeded with 2.5 × 10⁶ tumor cells for 3 days (Round 2, R2). This procedure was repeated for one more time, if applicable (Round 3, R3). At the end of each round, a duplicate well was collected for counting of residual tumor cells (GFP+) and CAR T cells (CD3+) and other phenotypic analysis (Granzyme B, PD1, CD101) on CAR T cells by flow cytometry.
For cytokine production assay after repetitive coculture, 3 × 10⁶ tumor cells (LA-N-1) were irradiated at 40Gy before seeding to reduce tumor burden for T cells. 1 × 10⁵ (E:T = 1:3) CAR T cells were cocultured with tumors in this assay.
Mouse experiments.
Male and female 6 - 8 weeks old NSG (NOD/SCID/IL-2Rnull) mice were purchased from the Animal Core Facility at UNC. Male and female 6 - 8 weeks old C57BL/6J and OT1 mice were purchased from The Jackson Laboratory. All the mice were housed in the Animal Core Facility at UNC. All mouse experiments were performed in accordance with UNC Animal Husbandry and Institutional Animal Care and Use Committee (IACUC) guidelines and were approved by UNC IACUC.
Xenogeneic mouse models.
For metastatic neuroblastoma models, CHLA-Ffluc (2 × 10⁶) tumor cells were injected intravenously into 8-10 weeks old female NSG mice. Two weeks later mice are infused intravenously with GD2-specific CAR.Ctrl cells or CAR.p40-Td cells. Tumor progression is monitored weekly by bioluminescence imaging using IVIS lumina II in vivo imaging system (PerkinElmer). For rechallenge experiment, another dose of CHLA-Ffluc (3 × 10⁶) cells were injected intravenously at 4 weeks post T cell infusion. Mice were euthanized when signs of discomfort were detected by the investigators or as recommended by the veterinarian who monitored the mice three times a week. Peripheral blood, spleen and liver (primary tumor site) were collected at indicated time points to measure the expansion and persistence of infused T cells (hCD45+hCD3+) by flow cytometry.
For orthotopic PDAC model, BxPC-3-Ffluc (1 × 10⁵) tumor cells were suspended in 25 μL DPBS, mixed with 25 μL Matrigel (Corning) and surgically implanted into the pancreas of 8 - 10 weeks old male NSG mice as previously described35. 14 days after tumor cell inoculation, control vector transduced T (Ctrl) cell, B7-H3 specific CAR.Ctrl or CAR.p40-Td cells were injected intravenously via tail injection (i.v.) (2 × 10⁶ cells/mouse). Tumor growth was monitored weekly by bioluminescence imaging using IVIS lumina II in vivo imaging system (PerkinElmer). In this model, the engraftment does not induce lethality of the mice even left untreated for more than 8 weeks post T cell infusion. The mice were arbitrarily considered dead in survival analysis when luciferase signal reached 15-fold over initial signal at week 0. All mice were euthanized at 8 weeks post T cell infusion and the peripheral blood, spleen and pancreas were collected to measure the persistence of infused T cells (hCD45+hCD3+) by flow cytometry.
Syngeneic mouse model.
B16-OVA cells (5 × 10⁵ cells/mouse) were suspended in 50 uL DPBS mixed with 50 uL Matrigel (Corning) and were subcutaneously injected into left flank of 7 - 8 weeks male C57BL/6 mice. Seven days post tumor engraftment, WT or OT1-TCR T cells were infused intravenously. Tumor size was monitored every 2 - 3 days after T cell infusion using a caliper. Tumor volume was calculated as length x width x width x 0.5 as previously described14, and mice with >1000cm3 were euthanized. After euthanization, blood, spleen, tumor and tumor dLN was collected for immunophenotyping by flow cytometry.
For the orthotopic PDAC model, the murine tumor cell line KPC-4662 was engineered to express mB7-H3, and implanted into pancreas of six week old C57BL/6J female mice by surgery (1 × 10⁵ cells/mouse). Eighteen days post tumor cell implantation, mice were irradiated with 400 cGy to create a lymphodepleted environment. Two days post-irradiation, mice were infused i.v. with syngeneic T cells (1 × 10⁷ cells/mouse). Tumor growth was monitored by US imaging biweekly. Some mice from untreated group were euthanized at day 40 post tumor engraftment for immunohistochemistry staining of the tumor microenvironment.
Confocal microscopy.
Cell were collected and split in half. One half was stained with Alexa594-conjugated mouse anti-GFP antibody (Thermo) and Alexa647-conjugated anti-NGFR (BD Biosciences) while the other half were stained with Alexa594-conjugated mouse anti-GFP antibody and Alexa647-conjugated anti-CD19 antibody (Thermo). Cells were stained for 30min at 4°C and subsequently washed with ice old DPBS. Cells were then fixed with Cytofix (BD Biosciences) for 10min at room temperature, washed with DPBS and loaded onto a glass slide using Cytospin Cytocentrifuge (Thermo). Prolong Diamond Antifade Mountant with DAPI (Thermo) was applied before sealing the slide with a category 1.5 cover slip (Thermo). The slides were imaged using Zeiss LSM710 and image data were analyzed with FIJI (Image J).
To quantify binding of p40-GFP fusion protein on cell surface, the cell membrane was first defined based on Alexa647 signal (anti-NGFR or anti-CD19 that marks p40-Td or ΔCD19-Td cells, respectively). In parallel, an irrelevant area (either area with no cell or intracellular space) were selected as background area. The mean fluorescence intensity (MFI) of Alexa594 signal (anti-GFP) was measured on membrane area and background area and the surface binding of p40-GFP was calculated as MFI(membrane)-MFI(background).
Statistical Analysis.
Student’s t test was used to determine statistically significant differences between 2 samples. When multiple comparison analyses were required, statistical significance was evaluated by ANOVA (one-way or two-way), followed by Sidak post-hoc analysis. If the data reflected measurement of 1 sample over time or under different conditions, repeated-measures ANOVA was used, followed by Sidak post-hoc analysis. All statistical analyses were performed with 2-tailed tests. Graph generation and statistical analyses were performed using GraphPad Prism, version 7 (GraphPad Software). A p value of less than 0.05 was considered statistically significant.
Supplementary Material
Table 1.
Ranked Gene List for Hypoxia Signature for Fig. 2g
| 1 | RRAGD | 43 | AK4 | 85 | UGP2 | 127 | TES |
| 2 | PPP1R15A | 44 | CA12 | 86 | PFKL | 128 | VHL |
| 3 | DDIT3 | 45 | KDELR3 | 87 | PGF | 129 | SLC37A4 |
| 4 | NDRG1 | 46 | CITED2 | 88 | GAPDH | 130 | SRPX |
| 5 | CXCR4 | 47 | ADORA2B | 89 | GPC3 | 131 | SERPINE1 |
| 6 | PDGFB | 48 | MT2A | 90 | HK1 | 132 | HMOX1 |
| 7 | KLF7 | 49 | ERRFI1 | 91 | HDLBP | 133 | PHKG1 |
| 8 | DUSP1 | 50 | DPYSL4 | 92 | ETS1 | 134 | PGAM2 |
| 9 | PLAUR | 51 | VEGFA | 93 | PGK1 | 135 | XPNPEP1 |
| 10 | PFKFB3 | 52 | DTNA | 94 | S100A4 | 136 | B3GALT6 |
| 11 | GPC4 | 53 | GPI | 95 | CDKN1C | 137 | BCAN |
| 12 | SLC2A3 | 54 | PPP1R3C | 96 | TKTL1 | 138 | NEDD4L |
| 13 | AKAP12 | 55 | ATF3 | 97 | TPST2 | 139 | KLF6 |
| 14 | SLC2A1 | 56 | KIF5A | 98 | FOXO3 | 140 | GLRX |
| 15 | MAFF | 57 | P4HA1 | 99 | SIAH2 | 141 | IDS |
| 16 | VLDLR | 58 | CYR61 | 100 | MYH9 | 142 | LXN |
| 17 | ZFP36 | 59 | KLHL24 | 101 | SLC25A1 | 143 | GPC1 |
| 18 | MXI1 | 60 | LDHA | 102 | ILVBL | 144 | PRKCA |
| 19 | EXT1 | 61 | BTG1 | 103 | GBE1 | 145 | RBPJ |
| 20 | BNIP3L | 62 | PLIN2 | 104 | GAA | 146 | CHST3 |
| 21 | EFNA3 | 63 | LOX | 105 | HSPA5 | 147 | GCK |
| 22 | PDK1 | 64 | ENO1 | 106 | HEXA | 148 | NDST1 |
| 23 | PPFIA4 | 65 | BHLHE40 | 107 | PRDX5 | 149 | HS3ST1 |
| 24 | DDIT4 | 66 | HOXB9 | 108 | PFKP | 150 | PDK3 |
| 25 | ANKZF1 | 67 | FAM162A | 109 | ENO3 | 151 | STBD1 |
| 26 | CCNG2 | 68 | MIF | 110 | PGM2 | 152 | PYGM |
| 27 | NFIL3 | 69 | JMJD6 | 111 | ANXA2 | 153 | NAGK |
| 28 | TIPARP | 70 | HK2 | 112 | MAP3K1 | 154 | CP |
| 29 | KDM3A | 71 | AMPD3 | 113 | JUN | 155 | IER3 |
| 30 | RORA | 72 | ALDOA | 114 | NR3C1 | 156 | CHST2 |
| 31 | PIM1 | 73 | TPD52 | 115 | TGFB3 | 157 | SLC6A6 |
| 32 | TMEM45A | 74 | P4HA2 | 116 | GYS1 | 158 | IGFBP3 |
| 33 | PNRC1 | 75 | CASP6 | 117 | FBP1 | 159 | PLAC8 |
| 34 | STC2 | 76 | IRS2 | 118 | GRHPR | 160 | CSRP2 |
| 35 | ALDOC | 77 | NDST2 | 119 | PAM | 161 | SDC4 |
| 36 | ADM | 78 | TNFAIP3 | 120 | WSB1 | 162 | CDKN1A |
| 37 | CDKN1B | 79 | MT1E | 121 | SCARB1 | 163 | NCAN |
| 38 | PGM1 | 80 | FOSL2 | 122 | FOS | 164 | ISG20 |
| 39 | SAP30 | 81 | GALK1 | 123 | STC1 | 165 | CAV1 |
| 40 | ENO2 | 82 | BCL2 | 124 | EFNA1 | 166 | GCNT2 |
| 41 | ANGPTL4 | 83 | TGM2 | 125 | SULT2B1 | 167 | GAPDHS |
| 42 | ZNF292 | 84 | TPI1 | 126 | ATP7A |
Acknowledgement
This work was supported in part by University Cancer Research Fund at the University of North Carolina at Chapel Hill, United States (G.D.); R01-CA193140-03 from National Cancer Institute, United States (G.D.); 1R37CA230786-01A1-01A1 from Nation Institute of Health (Y.P.G), W81XWH-19-1-0597 from Department of Defense (Y.P.G.) and W81XWH1810441 from Departtmen of Defense (H.D.). The UNC Small Animal Imaging Facility at the Biomedical Imaging Research Center, Microscopy Services Laboratory and Flow Cytometry Core Facilities are supported in part by an NCI Cancer Center Core Support Grant to the UNC Lineberger Comprehensive Center Center (P30-CA016086-40). The frozen tissues for RNA and protein extract were obtained from Tissue Procurement Facility at UNC-LCCC. We thank Charlene Santos and the Animal Studies Core Facility for providing mice and surgery service for the orthotopic pancreatic cancer mouse models.
Footnotes
Declaration of Interests
Drs Dotti and Savoldo have sponsor research agreements with Bluebird Bio, Cell Medica and Bellicum Pharmaceutical. Dr. Dotti serves in the scientific advisory board of MolMed S.p.A and Bellicum Pharmaceutical.
Reference
- 1.Garber K Driving T-cell immunotherapy to solid tumors. Nat Biotechnol 36, 215–219 (2018). [DOI] [PubMed] [Google Scholar]
- 2.D’Angelo SP, et al. Antitumor Activity Associated with Prolonged Persistence of Adoptively Transferred NY-ESO-1 (c259)T Cells in Synovial Sarcoma. Cancer Discov 8, 944–957 (2018). [DOI] [PMC free article] [PubMed] [Google Scholar]
- 3.Porter DL, Levine BL, Kalos M, Bagg A & June CH Chimeric antigen receptor-modified T cells in chronic lymphoid leukemia. N Engl J Med 365, 725–733 (2011). [DOI] [PMC free article] [PubMed] [Google Scholar]
- 4.Maude SL, Teachey DT, Porter DL & Grupp SA CD19-targeted chimeric antigen receptor T-cell therapy for acute lymphoblastic leukemia. Blood 125, 4017–4023 (2015). [DOI] [PMC free article] [PubMed] [Google Scholar]
- 5.Sanmamed MF & Chen L A Paradigm Shift in Cancer Immunotherapy: From Enhancement to Normalization. Cell 175, 313–326 (2018). [DOI] [PMC free article] [PubMed] [Google Scholar]
- 6.Anderson KG, Stromnes IM & Greenberg PD Obstacles Posed by the Tumor Microenvironment to T cell Activity: A Case for Synergistic Therapies. Cancer Cell 31, 311–325 (2017). [DOI] [PMC free article] [PubMed] [Google Scholar]
- 7.Kershaw MH, Westwood JA & Darcy PK Gene-engineered T cells for cancer therapy. Nat Rev Cancer 13, 525–541 (2013). [DOI] [PubMed] [Google Scholar]
- 8.Yao X, et al. Levels of peripheral CD4(+)FoxP3(+) regulatory T cells are negatively associated with clinical response to adoptive immunotherapy of human cancer. Blood 119, 5688–5696 (2012). [DOI] [PMC free article] [PubMed] [Google Scholar]
- 9.Hurton LV, et al. Tethered IL-15 augments antitumor activity and promotes a stem-cell memory subset in tumor-specific T cells. Proceedings of the National Academy of Sciences of the United States of America 113, E7788–E7797 (2016). [DOI] [PMC free article] [PubMed] [Google Scholar]
- 10.Hoyos V, et al. Engineering CD19-specific T lymphocytes with interleukin-15 and a suicide gene to enhance their anti-lymphoma/leukemia effects and safety. Leukemia 24, 1160–1170 (2010). [DOI] [PMC free article] [PubMed] [Google Scholar]
- 11.Waldmann TA, et al. Safety (toxicity), pharmacokinetics, immunogenicity, and impact on elements of the normal immune system of recombinant human IL-15 in rhesus macaques. Blood 117, 4787–4795 (2011). [DOI] [PMC free article] [PubMed] [Google Scholar]
- 12.Berger C, et al. Safety and immunologic effects of IL-15 administration in nonhuman primates. Blood 114, 2417–2426 (2009). [DOI] [PMC free article] [PubMed] [Google Scholar]
- 13.Di Stasi A, et al. Inducible apoptosis as a safety switch for adoptive cell therapy. N Engl J Med 365, 1673–1683 (2011). [DOI] [PMC free article] [PubMed] [Google Scholar]
- 14.Sockolosky JT, et al. Selective targeting of engineered T cells using orthogonal IL-2 cytokine-receptor complexes. Science 359, 1037–1042 (2018). [DOI] [PMC free article] [PubMed] [Google Scholar]
- 15.Andersen R, et al. Long-Lasting Complete Responses in Patients with Metastatic Melanoma after Adoptive Cell Therapy with Tumor-Infiltrating Lymphocytes and an Attenuated IL2 Regimen. Clinical cancer research : an official journal of the American Association for Cancer Research 22, 3734–3745 (2016). [DOI] [PubMed] [Google Scholar]
- 16.Kagoya Y, et al. A novel chimeric antigen receptor containing a JAK-STAT signaling domain mediates superior antitumor effects. Nat Med 24, 352–359 (2018). [DOI] [PMC free article] [PubMed] [Google Scholar]
- 17.Fraietta JA, et al. Determinants of response and resistance to CD19 chimeric antigen receptor (CAR) T cell therapy of chronic lymphocytic leukemia. Nat Med 24, 563–571 (2018). [DOI] [PMC free article] [PubMed] [Google Scholar]
- 18.Oppmann B, et al. Novel p19 protein engages IL-12p40 to form a cytokine, IL-23, with biological activities similar as well as distinct from IL-12. Immunity 13, 715–725 (2000). [DOI] [PubMed] [Google Scholar]
- 19.Duvallet E, Semerano L, Assier E, Falgarone G & Boissier MC Interleukin-23: a key cytokine in inflammatory diseases. Annals of medicine 43, 503–511 (2011). [DOI] [PubMed] [Google Scholar]
- 20.Ngiow SF, Teng MW & Smyth MJ A balance of interleukin-12 and −23 in cancer. Trends in immunology 34, 548–555 (2013). [DOI] [PubMed] [Google Scholar]
- 21.Iwakura Y & Ishigame H The IL-23/IL-17 axis in inflammation. The Journal of clinical investigation 116, 1218–1222 (2006). [DOI] [PMC free article] [PubMed] [Google Scholar]
- 22.Aggarwal S, Ghilardi N, Xie MH, de Sauvage FJ & Gurney AL Interleukin-23 promotes a distinct CD4 T cell activation state characterized by the production of interleukin-17. J Biol Chem 278, 1910–1914 (2003). [DOI] [PubMed] [Google Scholar]
- 23.Guedan S, et al. ICOS-based chimeric antigen receptors program bipolar TH17/TH1 cells. Blood 124, 1070–1080 (2014). [DOI] [PMC free article] [PubMed] [Google Scholar]
- 24.Xu Y, et al. Glycolysis determines dichotomous regulation of T cell subsets in hypoxia. The Journal of clinical investigation 126, 2678–2688 (2016). [DOI] [PMC free article] [PubMed] [Google Scholar]
- 25.Langrish CL, et al. IL-23 drives a pathogenic T cell population that induces autoimmune inflammation. J Exp Med 201, 233–240 (2005). [DOI] [PMC free article] [PubMed] [Google Scholar]
- 26.Zhu J, Yamane H & Paul WE Differentiation of effector CD4 T cell populations (*). Annu Rev Immunol 28, 445–489 (2010). [DOI] [PMC free article] [PubMed] [Google Scholar]
- 27.Muranski P & Restifo NP Essentials of Th17 cell commitment and plasticity. Blood 121, 2402–2414 (2013). [DOI] [PMC free article] [PubMed] [Google Scholar]
- 28.Frankel TL, et al. Both CD4 and CD8 T cells mediate equally effective in vivo tumor treatment when engineered with a highly avid TCR targeting tyrosinase. Journal of immunology 184, 5988–5998 (2010). [DOI] [PMC free article] [PubMed] [Google Scholar]
- 29.Langowski JL, et al. IL-23 promotes tumour incidence and growth. Nature 442, 461–465 (2006). [DOI] [PubMed] [Google Scholar]
- 30.Grivennikov SI, et al. Adenoma-linked barrier defects and microbial products drive IL-23/IL-17-mediated tumour growth. Nature 491, 254–258 (2012). [DOI] [PMC free article] [PubMed] [Google Scholar]
- 31.Subramanian A, et al. Gene set enrichment analysis: a knowledge-based approach for interpreting genome-wide expression profiles. Proceedings of the National Academy of Sciences of the United States of America 102, 15545–15550 (2005). [DOI] [PMC free article] [PubMed] [Google Scholar]
- 32.Gargett T, et al. GD2-specific CAR T Cells Undergo Potent Activation and Deletion Following Antigen Encounter but can be Protected From Activation-induced Cell Death by PD-1 Blockade. Mol Ther 24, 1135–1149 (2016). [DOI] [PMC free article] [PubMed] [Google Scholar]
- 33.Philip M, et al. Chromatin states define tumour-specific T cell dysfunction and reprogramming. Nature 545, 452–456 (2017). [DOI] [PMC free article] [PubMed] [Google Scholar]
- 34.Wherry EJ T cell exhaustion. Nat Immunol 12, 492–499 (2011). [DOI] [PubMed] [Google Scholar]
- 35.Du H, et al. Antitumor Responses in the Absence of Toxicity in Solid Tumors by Targeting B7-H3 via Chimeric Antigen Receptor T Cells. Cancer Cell 35, 221–237 e228 (2019). [DOI] [PMC free article] [PubMed] [Google Scholar]
- 36.Lee JW, Komar CA, Bengsch F, Graham K & Beatty GL Genetically Engineered Mouse Models of Pancreatic Cancer: The KPC Model (LSL-Kras(G12D/+) ;LSL-Trp53(R172H/+) ;Pdx-1-Cre), Its Variants, and Their Application in Immuno-oncology Drug Discovery. Curr Protoc Pharmacol 73, 14 39 11–14 39 20 (2016). [DOI] [PMC free article] [PubMed] [Google Scholar]
- 37.Mirlekar B, Michaud D, Searcy R, Greene K & Pylayeva-Gupta Y IL35 Hinders Endogenous Antitumor T-cell Immunity and Responsiveness to Immunotherapy in Pancreatic Cancer. Cancer immunology research 6, 1014–1024 (2018). [DOI] [PMC free article] [PubMed] [Google Scholar]
- 38.Zeitouni D, Pylayeva-Gupta Y, Der CJ & Bryant KL KRAS Mutant Pancreatic Cancer: No Lone Path to an Effective Treatment. Cancers (Basel) 8(2016). [DOI] [PMC free article] [PubMed] [Google Scholar]
- 39.Hu B, et al. Augmentation of Antitumor Immunity by Human and Mouse CAR T Cells Secreting IL-18. Cell Rep 20, 3025–3033 (2017). [DOI] [PMC free article] [PubMed] [Google Scholar]
- 40.Chmielewski M & Abken H CAR T Cells Releasing IL-18 Convert to T-Bet(high) FoxO1(low) Effectors that Exhibit Augmented Activity against Advanced Solid Tumors. Cell Rep 21, 3205–3219 (2017). [DOI] [PubMed] [Google Scholar]
- 41.Avanzi MP, et al. Engineered Tumor-Targeted T Cells Mediate Enhanced Anti-Tumor Efficacy Both Directly and through Activation of the Endogenous Immune System. Cell Rep 23, 2130–2141 (2018). [DOI] [PMC free article] [PubMed] [Google Scholar]
- 42.Chen Y, et al. Eradication of Neuroblastoma by T Cells Redirected with an Optimized GD2-Specific Chimeric Antigen Receptor and Interleukin-15. Clinical cancer research : an official journal of the American Association for Cancer Research 25, 2915–2924 (2019). [DOI] [PubMed] [Google Scholar]
- 43.Diaconu I, et al. Inducible Caspase-9 Selectively Modulates the Toxicities of CD19-Specific Chimeric Antigen Receptor-Modified T Cells. Mol Ther 25, 580–592 (2017). [DOI] [PMC free article] [PubMed] [Google Scholar]
- 44.Tey SK, Dotti G, Rooney CM, Heslop HE & Brenner MK Inducible caspase 9 suicide gene to improve the safety of allodepleted T cells after haploidentical stem cell transplantation. Biol Blood Marrow Transplant 13, 913–924 (2007). [DOI] [PMC free article] [PubMed] [Google Scholar]
- 45.Teng MW, et al. Opposing roles for IL-23 and IL-12 in maintaining occult cancer in an equilibrium state. Cancer Res 72, 3987–3996 (2012). [DOI] [PMC free article] [PubMed] [Google Scholar]
- 46.Zhang L, et al. IL-23 selectively promotes the metastasis of colorectal carcinoma cells with impaired Socs3 expression via the STAT5 pathway. Carcinogenesis 35, 1330–1340 (2014). [DOI] [PubMed] [Google Scholar]
- 47.Lo CH, et al. Antitumor and antimetastatic activity of IL-23. Journal of immunology 171, 600–607 (2003). [DOI] [PubMed] [Google Scholar]
- 48.Overwijk WW, et al. Immunological and antitumor effects of IL-23 as a cancer vaccine adjuvant. Journal of immunology 176, 5213–5222 (2006). [DOI] [PMC free article] [PubMed] [Google Scholar]
- 49.Floss DM, Schroder J, Franke M & Scheller J Insights into IL-23 biology: From structure to function. Cytokine Growth Factor Rev 26, 569–578 (2015). [DOI] [PubMed] [Google Scholar]
- 50.Hor YT, et al. A role for RUNX3 in inflammation-induced expression of IL23A in gastric epithelial cells. Cell Rep 8, 50–58 (2014). [DOI] [PMC free article] [PubMed] [Google Scholar]
- 51.Pulliam SR, Uzhachenko RV, Adunyah SE & Shanker A Common gamma chain cytokines in combinatorial immune strategies against cancer. Immunol Lett 169, 61–72 (2016). [DOI] [PMC free article] [PubMed] [Google Scholar]
- 52.Rochman Y, Spolski R & Leonard WJ New insights into the regulation of T cells by gamma(c) family cytokines. Nat Rev Immunol 9, 480–490 (2009). [DOI] [PMC free article] [PubMed] [Google Scholar]
- 53.Thurley K, Gerecht D, Friedmann E & Hofer T Three-Dimensional Gradients of Cytokine Signaling between T Cells. PLoS Comput Biol 11, e1004206 (2015). [DOI] [PMC free article] [PubMed] [Google Scholar]
- 54.Oyler-Yaniv A, et al. A Tunable Diffusion-Consumption Mechanism of Cytokine Propagation Enables Plasticity in Cell-to-Cell Communication in the Immune System. Immunity 46, 609–620 (2017). [DOI] [PMC free article] [PubMed] [Google Scholar]
- 55.Noman MZ, et al. The cooperative induction of hypoxia-inducible factor-1 alpha and STAT3 during hypoxia induced an impairment of tumor susceptibility to CTL-mediated cell lysis. Journal of immunology 182, 3510–3521 (2009). [DOI] [PubMed] [Google Scholar]
- 56.Pawlus MR, Wang L & Hu CJ STAT3 and HIF1alpha cooperatively activate HIF1 target genes in MDA-MB-231 and RCC4 cells. Oncogene 33, 1670–1679 (2014). [DOI] [PMC free article] [PubMed] [Google Scholar]
Method-Only References
- 57.Song L, et al. Oncogene MYCN regulates localization of NKT cells to the site of disease in neuroblastoma. The Journal of clinical investigation 117, 2702–2712 (2007). [DOI] [PMC free article] [PubMed] [Google Scholar]
- 58.Tarek N, et al. Unlicensed NK cells target neuroblastoma following anti-GD2 antibody treatment. The Journal of clinical investigation 122, 3260–3270 (2012). [DOI] [PMC free article] [PubMed] [Google Scholar]
- 59.Caruana I, et al. Heparanase promotes tumor infiltration and antitumor activity of CAR-redirected T lymphocytes. Nat Med 21, 524–529 (2015). [DOI] [PMC free article] [PubMed] [Google Scholar]
- 60.Louis CU, et al. Antitumor activity and long-term fate of chimeric antigen receptor-positive T cells in patients with neuroblastoma. Blood 118, 6050–6056 (2011). [DOI] [PMC free article] [PubMed] [Google Scholar]
- 61.Du HHK; Ahn S; Kren NP; Montgomery SA; Wang XH; Tiruthani K; Mirlekar R; Michaud D; Greene K; Herrera SG; Sun C; Chen YH; Xu Y; Ma XC; Ferrone CR; Pylayeva-Gupta Y; and Yeh JJ; Liu RH; Savoldo B; Ferrone S; Dotti G. Antitumor Responses in the Absence of Toxicity in Solid Tumors by Targeting B7-H3 Via Chimeric Antigen Receptor T Cells Cancer Cell (2018). [DOI] [PMC free article] [PubMed] [Google Scholar]
- 62.Vera J, et al. T lymphocytes redirected against the kappa light chain of human immunoglobulin efficiently kill mature B lymphocyte-derived malignant cells. Blood 108, 3890–3897 (2006). [DOI] [PMC free article] [PubMed] [Google Scholar]
- 63.Xu Y, et al. Closely related T-memory stem cells correlate with in vivo expansion of CAR.CD19-T cells and are preserved by IL-7 and IL-15. Blood 123, 3750–3759 (2014). [DOI] [PMC free article] [PubMed] [Google Scholar]
- 64.Dobin A, et al. STAR: ultrafast universal RNA-seq aligner. Bioinformatics 29, 15–21 (2013). [DOI] [PMC free article] [PubMed] [Google Scholar]
- 65.Patro R, Duggal G, Love MI, Irizarry RA & Kingsford C Salmon provides fast and bias-aware quantification of transcript expression. Nat Methods 14, 417–419 (2017). [DOI] [PMC free article] [PubMed] [Google Scholar]
- 66.Love MI, Huber W & Anders S Moderated estimation of fold change and dispersion for RNA-seq data with DESeq2. Genome Biol 15, 550 (2014). [DOI] [PMC free article] [PubMed] [Google Scholar]
- 67.Dauer DJ, et al. Stat3 regulates genes common to both wound healing and cancer. Oncogene 24, 3397–3408 (2005). [DOI] [PubMed] [Google Scholar]
Associated Data
This section collects any data citations, data availability statements, or supplementary materials included in this article.