

Abstract
Aim:
To identify placental DNA methylation changes that are associated with early pregnancy maternal dyslipidemia.
Materials & methods:
We analyzed placental genome-wide DNA methylation (n = 262). Genes annotating differentially methylated CpGs were evaluated for gene expression in placenta (n = 64).
Results:
We found 11 novel significant differentially methylated CpGs associated with high total cholesterol, low-density lipoprotein cholesterol and triglycerides, and low high-density lipoprotein cholesterol. High triglycerides were associated with decreased methylation of cg02785814 (ALX4) and decreased expression of ALX4 in placenta. Genes annotating the differentially methylated CpGs play key roles in lipid metabolism and were enriched in dyslipidemia pathways. Functional annotation found cis-methylation quantitative trait loci for genetic loci in ALX4 and EXT2.
Conclusion:
Our findings lend novel insights into potential placental epigenetic mechanisms linked with maternal dyslipidemia.
Trial Registration: ClinicalTrials.gov, NCT00912132.
Keywords: : cardiometabolic diseases, dyslipidemia, epigenome-wide association study, lipids, placental DNA methylation, placental gene expression
Dyslipidemia during pregnancy has been linked with increased risk of pregnancy loss, preeclampsia, gestational diabetes, preterm birth, large for gestational age fetuses and high birth weight babies [1–6]. Studies have shown that maternal dyslipidemia may program lipid metabolism in the offspring and contribute to the development of adult cardiometabolic diseases [7,8]. Offspring exposed to maternal dyslipidemia during fetal life may be at higher risk of cardiometabolic diseases in later life [9–12], such as dyslipidemia, atherosclerosis, hypertension, obesity and Type 2 diabetes. This concept of fetal programming of cardiometabolic diseases in later life is well documented [13], however the mechanisms are not clearly understood.
As a mediator of the maternal-fetal exchange, the placenta can play a role in the programming of health and disease in adulthood [14,15]. Maternal dyslipidemia may impact placental growth and function [16]. For instance, our group previously found that low maternal high-density lipoprotein cholesterol (HDLc) status was associated with accelerated epigenetic aging of the placenta [17], which demonstrate epigenetic modification in the placenta linked to maternal lipid levels. Recent studies have suggested that placental epigenetic alterations could be the mechanistic links between the intrauterine environment during fetal life and health outcome in later life [15,18,19]. Two candidate gene studies reported that lower first trimester maternal HDLc blood levels was associated with higher placental DNA methylation levels at the lipoprotein lipase (LPL) gene locus [20], and lower third trimester HDLc was associated with higher placental DNA methylation levels at the ABCA1 gene locus [21]. Higher placental DNA methylation at ABCA1 locus was associated with lower ABCA1 mRNA levels [21], suggesting that placental epigenetic alterations may contribute to regulation of cholesterol transfer from the mother to the fetus [22]. However, to our knowledge, there is no published epigenome-wide association study (EWAS) of maternal dyslipidemia in placenta.
In the present study, we performed an EWAS to identify placental DNA methylation of cytosine-(phosphate)-guanine (CpG) sites associated with maternal dyslipidemia status (i.e., high plasma total cholesterol, low high-density lipoprotein cholesterol [HDLc], high low-density lipoprotein cholesterol [LDLc] and high triglycerides) in early pregnancy. We also tested correlations between the DNA methylation levels of the top significant CpG sites and expression of the corresponding annotated genes in placenta. Finally, we evaluated whether CpG sites which were previously implicated in lipid traits in adult blood, were differentially methylated in placenta in relation to maternal dyslipidemia in our study.
Methods
Study population
The Eunice Kennedy Shriver National Institute of Child Health and Human Development (NICHD) Fetal Growth Studies – Singleton cohort included pregnant women aged 18 to 40 years old with viable singleton pregnancy, who planned to deliver at participating clinic sites. Specifically, the study included 2334 nonobese pregnant women (pre-pregnancy body mass index [BMI] between 19.0 to 29.9 kg/m2) and 468 obese pregnant women (pre-pregnancy BMI between 30.0 and 44.9 kg/m2) [23]. In both groups, pregnant women were excluded if they reported having major medical condition (such as cancer, autoimmune disease, diabetes, HIV or AIDS, chronic renal disease and psychiatric disorder). In addition, nonobese pregnant women were excluded if they reported chronic hypertension, past adverse pregnancy outcomes and self-reported behavioral risk factors such as use of cigarettes, illicit drugs or alcohol in the months prior to pregnancy. Women were enrolled between 8 weeks and 0 days (8w0d) and 13 weeks and 6 days (13w6d) between July 2009 and January 2013 from 12 clinic sites within the USA. The study was approved by institutional review boards at NICHD, each participating clinical sites and data coordinating centers. Placental samples were available from 312 women and the final analytical population was composed of 262 women who had plasma lipid levels at enrollment and placental DNA methylation data (see below for details). None of these women took lipids lowering medication.
Maternal blood lipid levels
Plasma lipids were measured using maternal nonfasting blood samples collected at enrollment (mean ± standard deviation [SD]: 12.7 ± 0.9 gestational weeks, Table 1). Total cholesterol, HDLc and triglyceride concentrations were directly measured from plasma stored in -80°C freezers [24], using the Roche COBAS 6000 chemistry analyzer (Roche Diagnostics, IN, USA). The inter-assay laboratory coefficients of variation were 2.2, 3.2 and 2.3% for total cholesterol, HDLc and triglycerides, respectively. LDLc was calculated using the Friedewald formula [25]. Lipid levels were dichotomized using the third report of the National Cholesterol Education Program (NCEP III) criteria from nonpregnant population, as there is no clear reference for lipid levels during pregnancy [26]. Total cholesterol as normal total cholesterol (<200 mg/dl) versus high total cholesterol (≥200 mg/dl), HDLc as normal HDLc (>50 mg/dl) versus low HDLc (≤50 mg/dl), LDLc as normal LDLc (<100 mg/dl) versus high LDLc (≥100 mg/dl) and triglycerides as normal triglycerides (<150 mg/dl) versus high triglycerides (≥150 mg/dl).
Table 1. . Characteristics of study final analytical population (n = 262).
| Characteristics | Mean ± SD or n | (%) |
|---|---|---|
| Maternal age, years | 27.5 ± 2.5 | |
| Gestational age at enrollment, weeks | 12.7 ± 0.9 | |
| Maternal prepregnancy BMI | ||
| – <25 kg/m2 | 183 | (69.8) |
| – ≥25 and <30 kg/m2 | 71 | (27.1) |
| – ≥30 kg/m2 (obese women) | 2 | (0.8) |
| – Missing | 6 | (0.4) |
| Maternal race/ethnicity | ||
| – Non-Hispanic White | 65 | (24.8) |
| – Non-Hispanic Black | 61 | (23.3) |
| – Hispanic | 88 | (33.6) |
| – Asian | 48 | (18.3) |
| Parity | ||
| – 0 | 127 | (48.5) |
| – 1 or more | 135 | (51.5) |
| Infant sex | ||
| – Male | 131 | (50) |
| – Female | 131 | (50) |
| Maternal dyslipidemia | ||
| – High total cholesterol (≥200 mg/dl) | 77 | (29.4) |
| – Low HDLc (≤50 mg/dl) | 44 | (16.8) |
| – High LDLc (≥100 mg/dl) | 122 | (46.6) |
| – High triglycerides (≥150 mg/dl) | 52 | (19.8) |
Lipid levels dichotomized using the third report of the National Cholesterol Education Program (NCEP III) criteria [26].
HDLc: High-density lipoprotein cholesterol; LDLc: Low-density lipoprotein cholesterol; SD: Standard deviation.
Placental DNA methylation measurement & quality control
Placental samples (n = 312) were obtained within one hour of delivery. Placental parenchymal biopsies measuring 0.5 cm × 0.5 cm × 0.5 cm were taken from the fetal side, collected directly below the fetal surface of the placenta. Samples were placed in RNALater and frozen for molecular analysis. Processing of the placental biopsies was performed at the Columbia University Irving Medical Center and details have been described previously [27]. DNA was extracted from the placental biopsies and was assayed using Illumina's Infinium Human Methylation450 Beadchip (Illumina Inc., CA, USA). Standard Illumina protocols were followed for background correction, normalization to internal control probes and quantile normalization. The resulting intensity files were processed with Illumina's GenomeStudio, which generated average β-scores (i.e., the fraction of methylated sites per sample by taking the ratio of methylated and unmethylated fluorescent signals at each queried CpG) and detection p-values (that characterize the chance that the target sequence signal was distinguishable from the negative controls). Stringent quality control procedures were followed as previously described [28]. A total of 301 placental samples and 409,101 CpGs that passed the quality control filters were included in the EWAS. Of the 301 pregnant women with placental DNA methylation data that passed quality filters, 262 women who had blood lipid levels at enrollment were included in these analyses. Raw DNA methylation β-values are prone to heteroscedasticity. For improved model fitting in our analyses, β-values were converted to M-value scale by using the formula: M-value = log2(β/[1-β]). All analyses were performed by fitting the methylation M-values as recommended [29]. Any resulting infinity or missing M-values (6.0%) were imputed by the k-nearest neighbors method, setting k = 10 [30].
Placenta RNA quantification for gene expression
RNA was available for 80 placentas (42 male and 38 female) and was extracted using TRIZOL reagent (Invitrogen, MA, USA) and sequenced using the Illumina HiSeq2000 system. The expression of the transcripts were quantified using Salmon [31], which accounts for experimental attributes and biases such as fragment GC-content bias that are commonly observed in RNA-seq data. Participants with RNA-seq, DNA methylation and blood lipids level at enrollment (n = 64) were used to test correlation between DNA methylation and mRNA gene expression levels.
Statistical analysis
Epigenome-wide analyses
EWAS's were performed for each dyslipidemia trait (high total cholesterol (≥200 mg/dl), low HDLc (≤50 mg/dl), high LDLc (≥100 mg/dl) and high triglycerides (≥150 mg/dl)) as a predictor and placenta DNA methylation at each CpG site as the response variable using the R/Bioconductor package limma [32]. Placental genome-wide SNP genotype data were used to estimate ten genotype-based principal components (PCs) representing population structure. The R package ‘prcomp’ was used to calculate PCs on the samples' percent methylation profiles [33]. EWAS analyses were implemented using adjusted robust linear regression models that use iterated re-weighted least squares [34]. EWAS were adjusted for self-reported maternal race/ethnicity, maternal age in years, offspring sex, methylation sample plate (n = 5), the first three methylation PCs and the first ten genotype PCs to account for population structure [35] and putative cell-mixture estimated using Surrogate Variable Analysis (SVA) components (n = 20) to account for latent source of noise such as batch effects and cell composition [36–38]. To account for the inflation of statistical test in EWAS, we implemented the Bayesian method to obtain BACON-corrected inflation estimates (Bλ) and BACON-corrected p-values using the R/Bioconductor package BACON [39]. Corrected p-values from BACON were then controlled for false discovery rate (FDR), giving BACON-corrected FDR p-values. Quantile-quantile plots of p-values and the corresponding inflation estimates before (λ) and after (Bλ) BACON-correction are reported in Supplementary Figure 1. The inflation statistic was close to one after BACON correction (Supplementary Figure 1). Genome-wide Manhattan plots were used to report results from EWAS (Figure 1).
Figure 1. . Manhattan plots of associations between maternal dyslipidemia and DNA methylation in placenta.
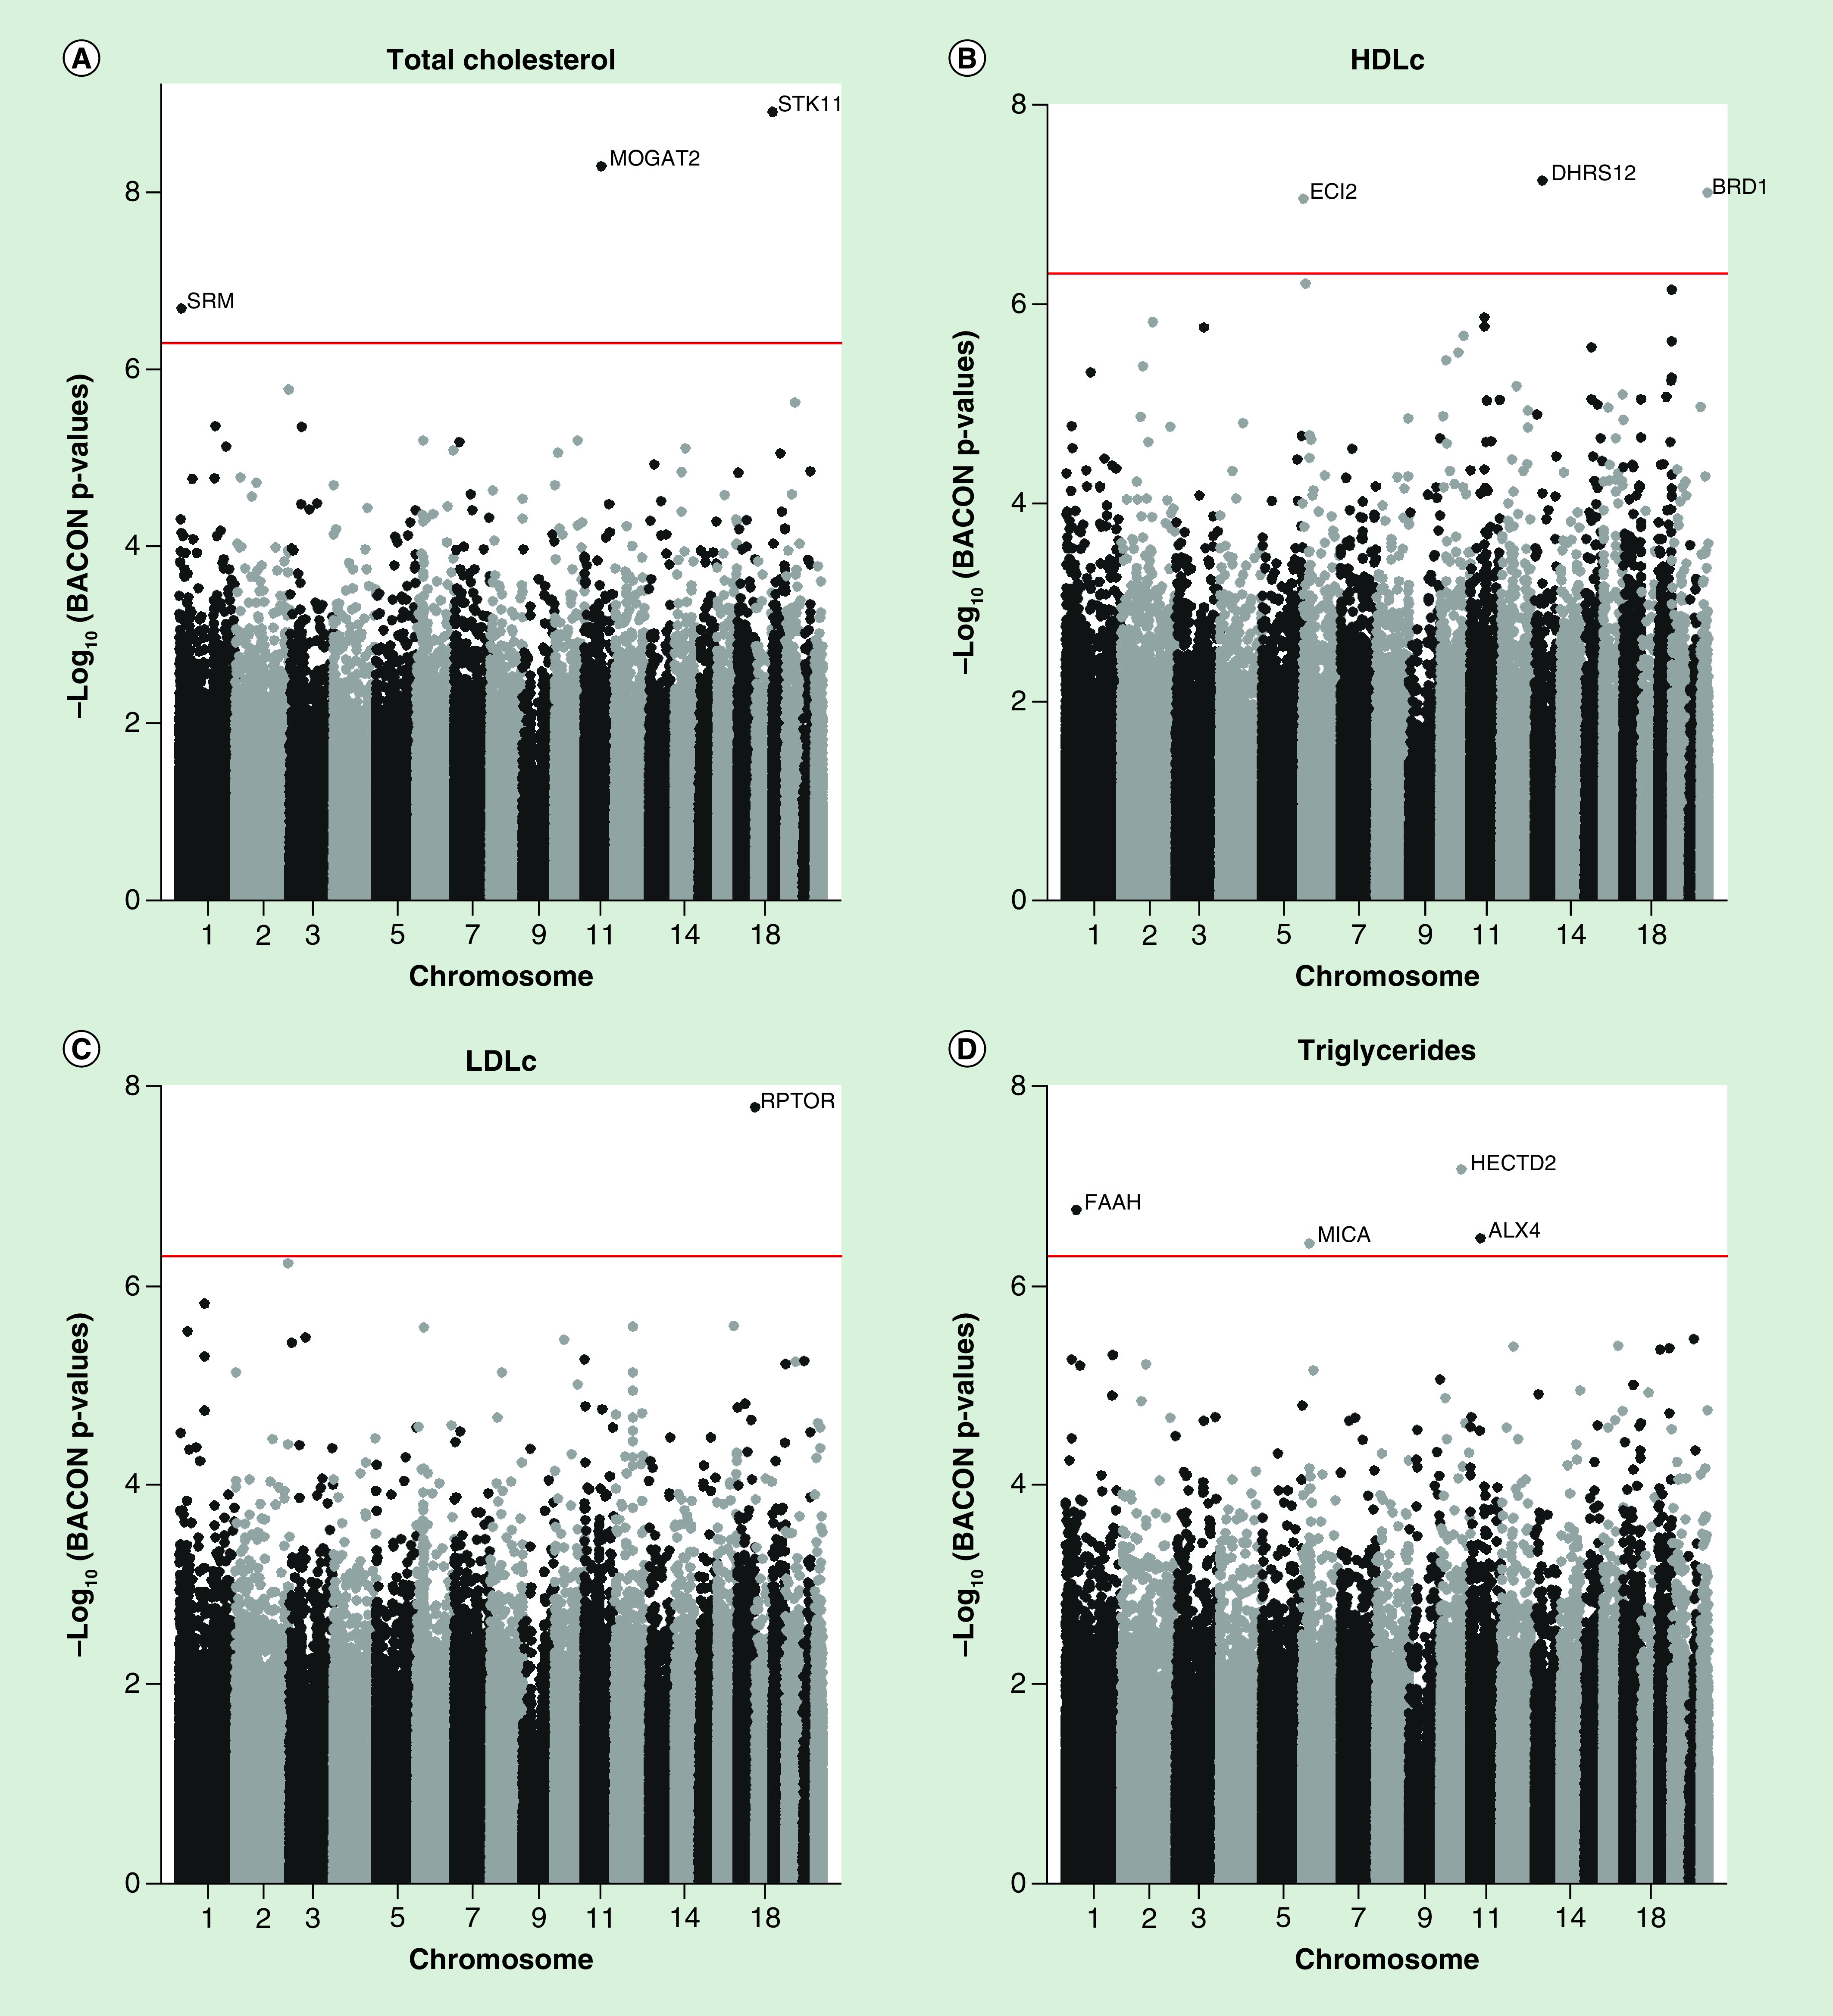
HDLc: High-density lipoprotein cholesterol; LDLc: Low-density lipoprotein cholesterol.
Gene expression analyses
We estimated the correlation between placenta DNA methylation and mRNA gene expression levels of the corresponding annotated genes. Significant statistical correlations were considered with FDR p-values < 0.05. Association between mRNA levels of the genes mapping to dyslipidemia-associated CpGs in our study (BACON-corrected FDR p-values < 0.05) and the corresponding dyslipidemia trait (high total cholesterol, low HDLc, high LDLc and high triglycerides) was tested using the R/Bioconductor package DESeq2 [40]. DESeq2 implemented negative binomial generalized linear models and estimated dispersion and logarithmic fold changes to quantify differential expression. Adjustment factors in the model included maternal race/ethnicity, maternal age in years, fetal sex and the first ten genotype PCs. The Benjamini–Hochberg adjusted p-value of the Wald test was used to correct for multiple testing.
Canonical pathway analysis
Genes annotating the top epigenome-wide significant CpGs (BACON-corrected FDR p-values < 0.05) were further explored. We identified canonical pathways, networks, and disease and biological functions involved using the ‘Core Analysis’ function in Ingenuity Pathway Analysis (IPA, Qiagen, CA, USA, www.qiagen.com/ingenuity). Statistically significant over-represented canonical pathways were determined by Fisher's exact test followed by adjustment for multiple testing using the Benjamini–Hochberg method.
Functional annotation & analysis
To identify SNPs that may influence DNA methylation at the CpG sites in cis (i.e, within 1 megabase on either side of a gene's transcript start site [TSS] [41]), the top significant CpG sites (BACON-corrected FDR p-values < 0.05) were queried in the mQTL database (www.mqtldb.org/) that documents methylation quantitative trait loci (meQTL) in human blood at serial time points across the life-course: at birth, childhood, adolescence, middle age and pregnancy [42]. Then, the cis-meQTL SNPs identified through the query were annotated using tools and databases including Functional Mapping and Annotation (FUMA) [43], HaploReg v4.1 [44] and Genotype-Tissue Expression (GTEx) [45].
To test whether the cis-meQTL SNPs modify the association between dyslipidemia and DNA methylation in placenta, we repeated the EWAS for the lipid trait as a predictor and placenta DNA methylation at each CpG site as the response variable that included an interaction term between the lipid level and the SNP genotypes in placenta as well as the covariates included in the primary analyses.
Evaluation of previously reported CpGs associated with lipid-related traits
A PubMed literature search was conducted to identify CpG sites previously associated with lipid traits by EWAS (Supplementary methods). Ten studies met search eligibility criteria and were confirmed independently by two co-authors. We identified 434 unique CpG sites associated with lipid traits in adult blood [46–53] or CD4+ T cells [54,55], out of them 112, 240, 56 and 74 CpGs were reported to be associated with total cholesterol, HDLc, LDLc and triglycerides, respectively. We examined whether the 434 CpGs were associated with the four dyslipidemia traits in placenta in our data. CpGs with nominal p-values < 0.05 were considered to be statistically significant associations providing evidence for overlap in our study.
Results
Among the 262 women included in the analysis, 29% had high total cholesterol, 17% had low HDLc, 47% had high LDLc and 20% had high triglycerides at enrollment (Table 1). See Supplementary Table 1 for description of the pregnancy outcomes.
Epigenome-wide analyses
In total, maternal dyslipidemia in early pregnancy was significantly associated with placental DNA methylation at 11 CpG sites (BACON-corrected FDR p-values < 0.05, nominal p-values ranging from 1.21 × 10⁻⁹ to 3.77 × 10⁻⁷, Table 2 & Figure 1). High total cholesterol was associated with increased methylation of cg20637199 (STK11) and cg10695180 (MOGAT2) and decreased methylation of cg10490147 (SRM). Low HDLc was associated with decreased methylation of cg26851608 (DHRS12), cg00156001 (BRD1) and cg17182202 (ECI2). High LDLc was associated with decreased methylation of cg02047211 (RPTOR). High triglycerides were associated with decreased methylation of cg07255925 (HECTD2), cg02785814 (ALX4) and cg04985482 (MICA) and increased methylation of cg09326404 (FAAH). The highest change in methylation was between high triglycerides and cg09326404 (FAAH) in which there was a 4.9% higher placental DNA methylation (95% CI: 2.9–6.9%) among women with high triglycerides compared with women with normal triglycerides.
Table 2. . Top-significant (BACON-corrected false discovery rate p-values < 0.05) placental DNA methylation loci associated with maternal dyslipidemia status (n = 262).
| Dyslipidemia trait | CpG | Chr | Position | Relation to Island | Gene | Gene Group | β | (95% CI) | BACON-corrected p-value | BACON-corrected FDR p-value |
|---|---|---|---|---|---|---|---|---|---|---|
| High vs normal total cholesterol | cg20637199 | 19 | 1226534 | Island | STK11 | Body | 0.004 | (0.002–0.005) | 1.21E-09 | 0.0005 |
| cg10695180 | 11 | 75427562 | OpenSea | MOGAT2 | TSS1500 | 0.013 | (0.008–0.019) | 4.97E-09 | 0.0010 | |
| cg10490147 | 1 | 11120546 | Island | SRM | TSS1500 | -0.004 | (−0.006– -0.002) | 2.00E-07 | 0.0273 | |
| Low vs normal HDLc | cg26851608 | 13 | 52378480 | Island | DHRS12 | TSS1500 TSS200 | -0.003 | (-0.005 – -0.002) | 5.89E-08 | 0.0124 |
| cg00156001 | 22 | 50195025 | N_Shore | BRD1 | Body | -0.014 | (-0.020 – -0.009) | 7.81E-08 | 0.0124 | |
| cg17182202 | 6 | 4153258 | OpenSea | ECI2 | -0.015 | (-0.019 – −0.010) | 9.09E-08 | 0.0124 | ||
| High vs normal LDLc | cg02047211 | 17 | 78932697 | N_Shelf | RPTOR | Body | -0.012 | (-0.015 – -0.008) | 1.61E-08 | 0.0066 |
| High vs normal triglycerides | cg07255925 | 10 | 93073139 | OpenSea | HECTD2 | Body | -0.011 | (-0.015 – -0.007) | 6.70E-08 | 0.0274 |
| cg09326404 | 1 | 46956839 | Island | FAAH | 0.049 | (0.029–0.069) | 1.71E-07 | 0.0350 | ||
| cg02785814 | 11 | 44338707 | Island | ALX4 | -0.019 | (-0.030 – -0.009) | 3.33E-07 | 0.0386 | ||
| cg04985482 | 6 | 31382065 | OpenSea | MICA | Body | -0.035 | (-0.049 – -0.020) | 3.77E-07 | 0.0386 |
Adjusted for maternal self-reported race/ethnicity, maternal age in years, fetal sex, methylation sample plate, first three methylation principal component, the first ten genotype principal components and Surrogate Variable Analysis.
Dyslipidemia trait: High total cholesterol ≥200 mg/dl, low HDLc ≤50 mg/dl, high LDLc ≥100 mg/dl and high triglycerides ≥150 mg/dl.
Position: Based on hg19 human reference genome.
Relation to island: Shore = 0–2 kb from island, Shelf = 2–4 kb from island, N = upstream (5′) of CpG island, S = downstream (3′) of CpG island.
Gene Group: TSS200 = 0–200 bases upstream of the TSS; TSS1500 = 200–1500 bases upstream of the TSS; Body = Between the ATG and stop codon; irrespective of the presence of introns, exons, TSS, or promoters; 5′UTR = Within the 5′ untranslated region, between the TSS and the ATG start site; 3′UTR = Between the stop codon and poly A signa.
ATG: Start codon coding for methionine; Chr: Chromosome; CpG: Cytosine-(phosphate)-guanine; FDR: False discovery rate; HDLc: High-density lipoprotein cholesterol; LDLc: Low-density lipoprotein cholesterol; TSS: transcriptional start site.
Gene expression analyses
DNA methylation at cg26851608 (which was found to be hypomethylated with low HDLc) was inversely correlated with the placental gene expression of DHRS12 (r = -0.25, p-value = 0.044, n = 64; Table 3). High triglycerides were significantly associated with decreased placental gene expression of ALX4 (FDR adjusted p-value = 1.93 × 10⁻², Table 4).
Table 3. . Correlations between DNA methylation at the top differentially methylated cytosine-(phosphate)-guanine sites and gene expression in placenta (n = 64).
| CpG site | Gene | Spearman correlation | p-Value |
|---|---|---|---|
| cg20637199 | STK11 | 0.223 | 0.077 |
| cg10695180 | MOGAT2 | 0.042 | 0.743 |
| cg10490147 | SRM | -0.112 | 0.379 |
| cg26851608 | DHRS12 | -0.253 | 0.044 |
| cg00156001 | BRD1 | -0.014 | 0.912 |
| cg17182202 | ECI2 | -0.112 | 0.377 |
| cg02047211 | RPTOR | -0.190 | 0.133 |
| cg07255925 | HECTD2 | -0.081 | 0.527 |
| cg09326404 | FAAH | 0.016 | 0.899 |
| cg02785814 | ALX4 | 0.093 | 0.464 |
| cg04985482 | MICA | 0.092 | 0.471 |
Note: Bold value denotes p-value <0.05.
CpG: Cytosine-(phosphate)-guanine.
Table 4. . Association between maternal dyslipidemia status and expression of genes near the top significant DNA methylation cytosine-(phosphate)-guanine sites (n = 64).
| Dyslipidemia trait | Gene | Log2FoldChange | SE | P-value | Adjusted p-value |
|---|---|---|---|---|---|
| High vs normal total cholesterol | STK11 | -0.021 | 0.107 | 0.846 | 0.99996 |
| MOGAT2 | -0.407 | 4.013 | 0.919 | 0.99996 | |
| SRM | -0.346 | 0.121 | 0.004 | 0.29049 | |
| Low vs normal HDLc | DHRS12 | -0.088 | 0.131 | 0.501 | 0.99996 |
| BRD1 | 0.121 | 0.114 | 0.288 | 0.99996 | |
| ECI2 | -0.294 | 0.134 | 0.029 | 0.77191 | |
| High vs normal LDLc | RPTOR | 0.094 | 0.114 | 0.410 | 0.99999 |
| High vs normal triglycerides | HECTD2 | 0.024 | 0.190 | 0.898 | 0.99998 |
| FAAH | -0.077 | 0.168 | 0.646 | 0.99998 | |
| ALX4 | -16.265 | 4.310 | 1.61E-04 | 1.93E-02 | |
| MICA | 0.062 | 0.962 | 0.948 | 0.99998 |
Note: Bold value denotes p-value <0.05.
Adjusted for maternal self-reported race/ethnicity, maternal age in years, fetal sex and the first ten genotype principal components.
Dyslipidemia trait: High total cholesterol ≥200 mg/dl, low HDLc ≤50 mg/dl, high LDLc ≥100 mg/dl and high triglycerides ≥150 mg/dl.
CpG: Cytosine-(phosphate)-guanine; FDR: False discovery rate; HDLc: High-density lipoprotein cholesterol; LDLc: Low-density lipoprotein cholesterol.
Canonical pathways
The genes mapping to the differentially methylated CpG sites were enriched in canonical IPA disease and function pathways including dyslipidemia (p-value = 1.37 × 10⁻⁴), energy homeostasis (p-value = 2.44 × 10⁻⁴) and abnormal morphology of embryonic tissue (p-value = 4.84 × 10⁻⁴) (Table 5). The top canonical IPA network was related to Cell Cycle, Endocrine System Development and Function and Carbohydrate Metabolism (Supplementary Figure 2; Supplementary Tables 2 & 3).
Table 5. . Top 10 pathways of diseases and biological function from Ingenuity Pathway Analysis.
| Categories | Functions | Diseases or functions annotation | p-Value | Molecules |
|---|---|---|---|---|
| Lipid Metabolism, Small Molecule Biochemistry | Catabolism | Catabolism of fatty acid | 7.30E-05 | ECI2, FAAH |
| Cell Death and Survival, Embryonic Development | Cell death | Cell death of mesenchymal cells | 8.50E-05 | STK11, ALX4 |
| Hematological Disease, Metabolic Disease | Dyslipidemia | Dyslipidemia | 1.37E-04 | MOGAT2, RPTOR, FAAH |
| Organismal Functions | Energy homeostasis | Energy homeostasis | 2.44E-04 | MOGAT2, STK11, FAAH |
| Cell Cycle | senescence | Senescence of connective tissue cells | 3.82E-04 | STK11, FAAH |
| Developmental Disorder, Embryonic Development, Organismal Development, Tissue Morphology | Abnormal morphology | Abnormal morphology of embryonic tissue | 4.84E-04 | RPTOR, STK11, BRD1, ALX4 |
| Developmental Disorder, Embryonic Development, Organismal Development, Tissue Morphology | Abnormal morphology | Abnormal morphology of zone of polarizing activity | 4.99E-04 | ALX4 |
| Lipid Metabolism, Small Molecule Biochemistry | Acylation | Acylation of 1-oleoylglycerol | 4.99E-04 | MOGAT2 |
| Lipid Metabolism, Small Molecule Biochemistry | Acylation | Acylation of 2-oleoylglycerol | 4.99E-04 | MOGAT2 |
| Cancer, Organismal Injury and Abnormalities, Reproductive System Disease | Adenoma malignum | Adenoma malignum | 4.99E-04 | STK11 |
Note: Bold text highlights lipid-related pathways.
Functional annotation analyses
In the mQTL database, 137 SNPs in EXT2 and ALX4 genes were cis-meQTL with cg02785814 (ALX4) across different stages of life (Supplementary Table 4). Visualization of cg02785814 is presented in Supplementary Figure 3. FUMA identified six lead SNPs (rs80053551, rs73541707, rs56338244, rs3845266, rs72892167, rs1349831) out of the 137 cis-meQTL SNPs. When we included the six lead SNPs in the EWAS, we found a significant interaction between rs73541707, rs56338244 and rs72892167 and maternal triglycerides status (Supplementary Table 5). According to the GTEx and HPA database, gene EXT2 displayed the highest expression in the placenta and ALX4 displayed the highest expression in breast and endometrium tissues (Supplementary Figure 5).
Evaluation of previously reported CpGs associated with dyslipidemia
Out of 434 unique CpG sites that have been previously reported to be associated with dyslipidemia, 130 CpGs (30%) were significantly associated with dyslipidemia in our data (raw p-values < 0.05, Supplementary Table 6). From the 434 CpG sites, 112, 240, 56 and 74 were reported to be associated with total cholesterol, HDLc, LDLc and triglycerides, respectively. Among the 112 CpGs previously related to total cholesterol, 59 (58%) showed directionally consistent associations with total cholesterol in our data (Supplementary Table 7). Similarly, 108 (46%) CpGs, 29 (56%) and 41 (58%) showed directionally consistent associations with HDLc, LDLc and triglycerides in our data, respectively (Supplementary Table 7). There were no published maternal lipid EWAS in placenta or cord blood.
Discussion
We conducted the first placental EWAS of early pregnancy maternal dyslipidemia and found 11 differentially methylated CpG sites. The top differentially methylated CpG sites map to genes enriched in pathways including dyslipidemia, energy homeostasis and morphology of embryonic tissue. We found corroborating evidence from DNA methylation, gene expression and meQTL analyses for the role of the ALX4 gene in dyslipidemia due to high triglycerides. Specifically, high maternal triglycerides were associated with both decreased methylation of cg02785814 annotated to the ALX4 gene and decreased expression of the same gene in placenta. Lastly, 130 out of 434 previously reported CpG sites in adults blood known to be associated with lipid traits, displayed significant differential methylation in placenta associated with maternal dyslipidemia in our study.
Our study identified differentially methylated CpG sites mapping to genes such as MOGAT2, ECI2, DHRS12, FAAH, SRM, BRD1, ALX4 and RPTOR, which have biological functions relevant for lipid metabolism or other metabolic traits. Specifically, MOGAT2 is a member of the acylglycerol o-acyltransferase family of genes and encodes a crucial protein in the absorption of dietary fat by the small intestine. It is highly expressed in human small intestine and white adipose tissue [56]. A study has found decreased expression of MOGAT2 after fish oil supplementation among dyslipidemic men [57], and the gene has been associated with HDLc in a meta-analysis of genome-wide association studies (GWASs) [58]. ECI2 encodes a key mitochondrial enzyme involved in β-oxidation of unsaturated fatty acids and its antisense gene AL136309.4 has been associated with blood metabolite levels [59]. Furthermore, mouse deficient in eci2 accumulate unsaturated fatty acyl groups in ester lipids and deposit large amounts of triglycerides in hepatocytes (steatosis) [60]. DHRS12 encodes a short-chain dehydrogenases/reductases family enzyme that metabolizes compounds including lipids and is highly expressed in fat [61]. FAAH encodes a protein responsible for the hydrolysis of several fatty acid amides [62]. Some of these loci have also been associated with cardiometabolic diseases by GWAS. For example, SRM has been associated with fat-free mass [63]; BRD1 and ALX4 have been associated with blood pressure [64,65]; and RPTOR has been associated with BMI [66–68], obesity [69] and hypertension [65,70]. Previous studies have reported higher risk of cardiometabolic disease among children of mothers with dyslipidemia during pregnancy [9–12], and suggested that the placental response to dyslipidemia may be a mediator. One study has reported that placental DNA methylation at ABCA1 locus was associated with maternal blood HDLc level and lower ABCA1 mRNA levels, suggesting that placental epigenetic changes may play a role in cholesterol transfer from the mother to the fetus [22], as epigenetic changes in blood cells have been linked to end-product feedback control of lipid metabolism [47]. In line with these previous studies, we reported epigenetic alterations linked with maternal dyslipidemia in genes known to be associated with cardiometabolic diseases. Together with these previous evidences, our findings suggest that placental epigenetic markers of maternal dyslipidemia may give insights into early mechanisms that underlie the etiology of cardiometabolic diseases in later life. The relationship between DNA methylation and dyslipidemia traits is complicated by DNA sequence variation, which may contribute to both traits [71]. We found that genetic variants near the EXT2 and ALX4 genes which are highly expressed in placenta and female reproductive tissues had regulatory effects on cg02785814. ALX4 encodes a paired-like homeodomain transcription factor expressed in the mesenchyme of developing bones, limbs, hair, teeth and mammary tissue. ALX4 is essential for embryonic morphogenesis [72]. EXT2 encodes one of two glycosyltransferases involved in the chain elongation step of heparan sulfate biosynthesis [73]. Several GWASs have reported ALX4 and/or EXT2 loci associated with gout disease [74], response to antidepressants [75], Type 2 diabetes [76], blood pressure [65] and LDLc blood levels [77]. These findings provide evidence that specific placental epigenetic modifications may result from complex interactions between the fetal genome and the intrauterine environmental exposure such as maternal dyslipidemia. Future multi-omic studies hold the potential to unravel the early life mechanisms in fetal development and disease risk in later life.
To our knowledge, there have been no prior placenta-specific EWAS of dyslipidemia-related traits. Houde et al. have investigated the association between DNA methylation at LPL and ABCA1 genes quantified by sodium bisulfite pyrosequencing in cord blood and placenta and dyslipidemia among Canadian women [20,21]. Placental DNA methylation at LPL-CpG3 was negatively associated with maternal third trimester HDLc blood level, and placental DNA methylation at LPL-CpG2 was negatively associated with cord blood HDLc levels. Placental DNA methylation levels at both CpG sites were negatively correlated with placental LPL gene expression [20]. Maternal first trimester HDLc blood level was negatively correlated with ABCA1 DNA methylation on the maternal side of the placenta but not on the fetal side, but no association was observed with cord blood HDLc level [21]. In our study, no CpG sites annotated to either LPL or ABCA1 exhibited significant differential DNA methylation associated with maternal dyslipidemia.
We found that several CpG sites in adult blood and CD4+ T cells reported to be associated with lipid levels in previous EWASs [46–55] exhibited significant differential DNA methylation in placenta associated with maternal dyslipidemia. Some of these CpGs map to genes implicated in lipid metabolism such as CPT1A, ABCG1, SREBF1 and APOB. For example, cg00574958, cg09737197 and cg17058475 (CPT1A) that have been negatively associated with triglycerides and total cholesterol in adults [46–51,54,55] showed significant differential methylation in placenta associated with HDLc and LDLc in our data; cg02370100 and cg07397296 (ABCG1) that have been positively associated with triglycerides levels in adults [48,50,78] were positively associated with higher total cholesterol and triglycerides and lower HDLc; cg08129017 and cg20544516 (both annotated to SREBF1) were positively associated with triglycerides levels in adults [48] and in our data; cg03350299 (APOB) was positively associated with LDLc levels in adults [48] and in our data. The CPT1A gene plays an important role in triglyceride metabolism [79]; ABCG1 is involved in the transport of cholesterol and phospholipids in macrophages [80]; SREBF1 encodes a transcription factor that binds to the sterol regulatory element-1, which is localized at the promoter of the LDL-receptor gene and other genes involved in sterol biosynthesis [81]; and APOB is involved in the production of LDLc [82].
We recognize that our study has potential limitations. We were not able to identify another independent cohort to replicate our findings, because similarly designed cohorts are not common. However, we compared our results with previous published EWASs. Maternal lipid levels, placental DNA methylation and gene expression profiles vary during pregnancy [83], and epigenome-wide analysis cannot conclude a causal effect because DNA methylation may be a cause or consequence of dyslipidemia, a recurrent challenge in epigenomic studies [84]. However, a Mendelian randomization study demonstrated that differential DNA methylation observed in adult blood is more likely to be a consequence but not a cause of variations in lipids levels [47]. No such studies have been done using placenta samples. In addition, our criteria for dyslipidemia are from a nonpregnant population while the lipid levels in our study were measured during early pregnancy (between 8w0d and 13w6d). Studies including data from a subcohort of our own NICHD Fetal Growth Studies have shown that pregnant women's blood lipid levels decrease during the first 6 weeks and then increase throughout pregnancy [6,24,85,86], and hence our measuring windows are likely to reflect women's pre-pregnancy dyslipidemia status. However, after the first trimester of pregnancy, maternal blood lipid levels can change dramatically [6]. Blood samples have been stored in -80°C freezers before analyses were done. Variability between fresh and frozen samples stored in -80°C is small, with metabolomic compounds having both stable levels and good concordance [87]. Future studies are needed to understand mechanisms other than gene expression such as regulation of splicing, gene activation and transcription factors that may mediate the associations between dyslipidemia and DNA methylation changes found in this study [88].
Several unique strengths of our study deserve mention. Our study involved diverse race/ethnic participants that provided placenta samples at delivery. We were able to adjust for genotype-based PCs in addition to methylation-based PCs (which are widely used in most EWASs, despite being a poor proxy for ancestry) [35], effectively minimizing spurious associations due to population stratification [89]. To date, there is no reference for cell type composition for placenta. Therefore, we implemented a validated reference-free adjustment for cell type proportion variation implemented in SVA [90]. Further correction for genomic inflation was performed using BACON, a method demonstrated to maximize study power while controlling for FDR [39].
Conclusion
In conclusion, this first EWAS revealed that maternal dyslipidemia in early pregnancy was associated with placental DNA methylation and gene expression. Notably, our study found corroborating evidence for associations of maternal high triglycerides with hypomethylation of a CpG site annotated to ALX4 and decreased placental expression of ALX4. Some of these loci including MOGAT2, ECI2, DHRS12, FAAH, SRM, BRD1, ALX4 and RPTOR are known for their relevance in vascular and structural development of the placenta. These data provide insights into the potential early mechanisms underlying the etiology of cardiometabolic diseases in later life.
Future perspective
Findings from the present study shed further light on the importance of optimizing women's cardiometabolic health in early pregnancy or even before pregnancy to improve maternal and child health. Future multi-omic studies will have the potential to unravel pathways that may link mechanisms during fetal development and disease risk in later life.
Summary points.
We conducted the first placental epigenome-wide association study of maternal dyslipidemia.
Maternal high total cholesterol (≥200 mg/dl) was associated with placental DNA methylation at three cytosine-(phosphate)-guanine (CpG) sites (STK11, MOGAT2 and SRM).
Maternal low high-density lipoprotein cholesterol (≤50 mg/dl) was associated with placental DNA methylation at three CpG sites (DHRS12, BRD1 and ECI2).
Maternal high low-density lipoprotein cholesterol (≥100 mg/dl) was associated with placental DNA methylation at a CpG site near RPTOR.
Maternal high triglycerides (≥150 mg/dl) were associated with placental DNA methylation in four CpG sites (HECTD2, FAAH, ALX4 and MICA) and decreased placental gene expression of ALX4.
Many genes found to be associated with dyslipidemia are known for their relevance in vascular and structural development of the placenta and cardiometabolic diseases, suggesting potential early mechanisms underlying the etiology of cardiometabolic diseases in later life.
Acknowledgements
The authors acknowledge the study participants of the NICHD Fetal Growth Studies. The authors thank research teams at all participating clinical centers (which include Christina Care Health Systems, Columbia University, Fountain Valley Hospital, California, Long Beach Memorial Medical Center, New York Hospital, Queens, Northwestern University, University of Alabama at Birmingham, University of California, Irvine, Medical University of South Carolina, Saint Peters University Hospital, Tufts University and Women and Infants Hospital of Rhode Island). The authors also acknowledge the Wadsworth Center, C-TASC and the EMMES Corporations in providing data and imaging support. This work utilized the computational resources of the NIH HPC Biowulf cluster (http://hpc.nih.gov).
Footnotes
Supplementary data
To view the supplementary data that accompany this article please visit the journal website at: www.futuremedicine.com/doi/suppl/10.2217/epi-2019-0293
Financial & competing interests disclosure
This research was supported by the Intramural Research Program of the Eunice Kennedy Shriver National Institute of Child Health and Human Development, National Institutes of Health including American Recovery and Reinvestment Act funding via contract numbers HHSN275200800013C; HHSN275200800002I; HHSN27500006; HHSN275200800003IC; HHSN275200800014C; HHSN275200800012C; HHSN275200800028C; HHSN275201000009C and HHSN27500008. Additional support was obtained from the NIH Office of the Director, the National Institute on Minority Health and Health Disparities and the National Institute of Diabetes and Digestive and Kidney Diseases. The authors have no other relevant affiliations or financial involvement with any organization or entity with a financial interest in or financial conflict with the subject matter or materials discussed in the manuscript apart from those disclosed.
No writing assistance was utilized in the production of this manuscript.
Ethical conduct of research
The authors state that they have obtained appropriate institutional review board approval or have followed the principles outlined in the Declaration of Helsinki for all human or animal experimental investigations. In addition, for investigations involving human subjects, informed consent has been obtained from the participants involved.
References
Papers of special note have been highlighted as: • of interest; •• of considerable interest
- 1.Kitajima M, Oka S, Yasuhi I, Fukuda M, Rii Y, Ishimaru T. Maternal serum triglyceride at 24–32 weeks' gestation and newborn weight in nondiabetic women with positive diabetic screens. Obstet. Gynecol. 97(5 Pt 1), 776–780 (2001). [DOI] [PubMed] [Google Scholar]
- 2.Vrijkotte TG, Algera SJ, Brouwer IA, Van Eijsden M, Twickler MB. Maternal triglyceride levels during early pregnancy are associated with birth weight and postnatal growth. J. Pediatr. 159(5), 736–742 e731 (2011). [DOI] [PubMed] [Google Scholar]; • Reports that babies born to mothers with the highest triglycerides level had higher birth weight, while babies born to mother with lowest triglycerides levels were smaller at birth but had accelerated postnatal growth.
- 3.Vrijkotte TG, Krukziener N, Hutten BA, Vollebregt KC, Van Eijsden M, Twickler MB. Maternal lipid profile during early pregnancy and pregnancy complications and outcomes: the ABCD study. J. Clin. Endocrinol. Metab. 97(11), 3917–3925 (2012). [DOI] [PubMed] [Google Scholar]
- 4.Clausen T, Burski TK, Oyen N, Godang K, Bollerslev J, Henriksen T. Maternal anthropometric and metabolic factors in the first half of pregnancy and risk of neonatal macrosomia in term pregnancies. a prospective study. Eur. J. Endocrinol. 153(6), 887–894 (2005). [DOI] [PubMed] [Google Scholar]
- 5.Nasioudis D, Doulaveris G, Kanninen TT. Dyslipidemia in pregnancy and maternal-fetal outcome. Minerva Ginecol. 71(2), 155–162 (2019). [DOI] [PubMed] [Google Scholar]
- 6.Grantz KL, Elmi A, Pugh SJ, Catov J, Sjaarda L, Albert PS. Maternal serum lipid trajectories and association with pregnancy loss and length of gestation. Am. J. Perinatol. (2019). [DOI] [PMC free article] [PubMed] [Google Scholar]; • This is the first study that examined maternal serum lipid trajectories during pregnancy
- 7.Van Der Graaf A, Vissers MN, Gaudet D. et al. Dyslipidemia of mothers with familial hypercholesterolemia deteriorates lipids in adult offspring. Arterioscler. Thromb. Vasc. Biol. 30(12), 2673–2677 (2010). [DOI] [PubMed] [Google Scholar]
- 8.Napoli C, Glass CK, Witztum JL, Deutsch R, D'armiento FP, Palinski W. Influence of maternal hypercholesterolaemia during pregnancy on progression of early atherosclerotic lesions in childhood: fate of Early Lesions in Children (FELIC) study. Lancet 354(9186), 1234–1241 (1999). [DOI] [PubMed] [Google Scholar]; •• Suggests that maternal hypercholesterolaemia during pregnancy may determine long-term susceptibility of children to develop atherosclerosis in later life.
- 9.Catalano PM. Obesity and pregnancy–the propagation of a viscous cycle? J. Clin. Endocrinol. Metab. 88(8), 3505–3506 (2003). [DOI] [PubMed] [Google Scholar]
- 10.Curhan GC, Chertow GM, Willett WC. et al. Birth weight and adult hypertension and obesity in women. Circulation 94(6), 1310–1315 (1996). [DOI] [PubMed] [Google Scholar]
- 11.Samaras TT, Elrick H, Storms LH. Birthweight, rapid growth, cancer, and longevity: a review. J. Natl Med. Assoc. 95(12), 1170–1183 (2003). [PMC free article] [PubMed] [Google Scholar]
- 12.Pettitt DJ, Jovanovic L. Birth weight as a predictor of type 2 diabetes mellitus: the U-shaped curve. Curr. Diab. Rep. 1(1), 78–81 (2001). [DOI] [PubMed] [Google Scholar]
- 13.Barker DJ. In utero programming of chronic disease. Clin. Sci. (London, England: 1979) 95, 115–128 (1998). [PubMed] [Google Scholar]
- 14.Jansson T, Powell TL. Role of the placenta in fetal programming: underlying mechanisms and potential interventional approaches. Clin. Sci. (Lond.) 113(1), 1–13 (2007). [DOI] [PubMed] [Google Scholar]
- 15.Myatt L. Placental adaptive responses and fetal programming. J. Physiol. 572(Pt 1), 25–30 (2006). [DOI] [PMC free article] [PubMed] [Google Scholar]
- 16.Zhang R, Dong S, Ma WW. et al. Modulation of cholesterol transport by maternal hypercholesterolemia in human full-term placenta. PLoS One 12(2), e0171934 (2017). [DOI] [PMC free article] [PubMed] [Google Scholar]
- 17.Shrestha D, Workalemahu T, Tekola-Ayele F. Maternal dyslipidemia during early pregnancy and epigenetic ageing of the placenta. Epigenetics (2019). [DOI] [PMC free article] [PubMed] [Google Scholar]
- 18.Dolinoy DC, Weidman JR, Jirtle RL. Epigenetic gene regulation: linking early developmental environment to adult disease. Reprod. Toxicol. 23(3), 297–307 (2007). [DOI] [PubMed] [Google Scholar]
- 19.Lesseur C, Chen J. Adverse maternal metabolic intrauterine environment and placental epigenetics: implications for fetal metabolic programming. Curr. Environ. Health Rep. 5(4), 531–543 (2018). [DOI] [PMC free article] [PubMed] [Google Scholar]; •• Highlights the importance of studying placental mechanisms involved in fetal metabolic development to discover placental biomarkers that could predict later-life metabolic risk.
- 20.Houde AA, St-Pierre J, Hivert MF. et al. Placental lipoprotein lipase DNA methylation levels are associated with gestational diabetes mellitus and maternal and cord blood lipid profiles. J. Dev. Orig. Health Dis. 5(2), 132–141 (2014). [DOI] [PubMed] [Google Scholar]
- 21.Houde AA, Guay SP, Desgagne V. et al. Adaptations of placental and cord blood ABCA1 DNA methylation profile to maternal metabolic status. Epigenetics 8(12), 1289–1302 (2013). [DOI] [PMC free article] [PubMed] [Google Scholar]; • Reports a feedback control from epigenetic changes in cord blood and placenta in response to maternal blood level of high-density lipoprotein cholesterol to regulate the maternal-fetal cholesterol transfer.
- 22.Stefulj J, Panzenboeck U, Becker T. et al. Human endothelial cells of the placental barrier efficiently deliver cholesterol to the fetal circulation via ABCA1 and ABCG1. Circ. Res. 104(5), 600–608 (2009). [DOI] [PubMed] [Google Scholar]
- 23.Grewal J, Grantz KL, Zhang C. et al. Cohort profile: NICHD fetal growth studies-singletons and twins. Int. J. Epidemiol. 47(1), 25–25l (2018). [DOI] [PMC free article] [PubMed] [Google Scholar]
- 24.Bao W, Dar S, Zhu Y. et al. Plasma concentrations of lipids during pregnancy and the risk of gestational diabetes mellitus: a longitudinal study. J. Diabetes 10(6), 487–495 (2018). [DOI] [PMC free article] [PubMed] [Google Scholar]
- 25.Friedewald WT, Levy RI, Fredrickson DS. Estimation of the concentration of low-density lipoprotein cholesterol in plasma, without use of the preparative ultracentrifuge. Clin. Chem. 18(6), 499–502 (1972). [PubMed] [Google Scholar]
- 26.Expert Panel on Detection E, Adults TOHBCI. Executive summary of the Third Report of the National Cholesterol Education Program (NCEP) expert panel on detection, evaluation, and treatment of high blood cholesterol in adults (Adult Treatment Panel III). JAMA 285(19), 2486–2497 (2001). [DOI] [PubMed] [Google Scholar]
- 27.Delahaye F, Do C, Kong Y. et al. Genetic variants influence on the placenta regulatory landscape. PLoS Genet. 14(11), e1007785 (2018). [DOI] [PMC free article] [PubMed] [Google Scholar]
- 28.Tekola-Ayele F, Workalemahu T, Gorfu G. et al. Sex differences in the associations of placental epigenetic aging with fetal growth. Aging (Albany NY) 11(15), 5412–5432 (2019). [DOI] [PMC free article] [PubMed] [Google Scholar]
- 29.Du P, Zhang X, Huang CC. et al. Comparison of beta-value and M-value methods for quantifying methylation levels by microarray analysis. BMC Bioinformatics 11, 587 (2010). [DOI] [PMC free article] [PubMed] [Google Scholar]
- 30.Horvath S. DNA methylation age of human tissues and cell types. Genome Biol. 14(10), 3156 (2013). [DOI] [PMC free article] [PubMed] [Google Scholar]
- 31.Patro R, Duggal G, Love MI, Irizarry RA, Kingsford C. Salmon provides fast and bias-aware quantification of transcript expression. Nat. Methods 14(4), 417 (2017). [DOI] [PMC free article] [PubMed] [Google Scholar]
- 32.Ritchie ME, Phipson B, Wu D. et al. limma powers differential expression analyses for RNA-sequencing and microarray studies. Nucleic Acids Res. 43(7), e47 (2015). [DOI] [PMC free article] [PubMed] [Google Scholar]
- 33.Akalin A, Kormaksson M, Li S. et al. methylKit: a comprehensive R package for the analysis of genome-wide DNA methylation profiles. Genome Biol. 13(10), R87 (2012). [DOI] [PMC free article] [PubMed] [Google Scholar]
- 34.Venables WN, Ripley BD. Modern Applied Statistics with S. ( Fourth Edition). Springer, NY, USA: (2002). [Google Scholar]
- 35.Barfield RT, Almli LM, Kilaru V. et al. Accounting for population stratification in DNA methylation studies. Genet. Epidemiol. 38(3), 231–241 (2014). [DOI] [PMC free article] [PubMed] [Google Scholar]
- 36.Leek JT, Storey JD. Capturing heterogeneity in gene expression studies by surrogate variable analysis. PLoS Genet. 3(9), e161 (2007). [DOI] [PMC free article] [PubMed] [Google Scholar]
- 37.Maksimovic J, Gagnon-Bartsch JA, Speed TP, Oshlack A. Removing unwanted variation in a differential methylation analysis of Illumina HumanMethylation450 array data. Nucleic Acids Res. 43(16), e106–e106 (2015). [DOI] [PMC free article] [PubMed] [Google Scholar]
- 38.Leek Jt JW, Parker HS, Fertig EJ, Jaffe AE, Storey JD, Zhang Y, Torres LC. sva: Surrogate Variable Analysis. R package version 3.30.1. (2019).
- 39.Van Iterson M, Van Zwet EW, Consortium B, Heijmans BT. Controlling bias and inflation in epigenome- and transcriptome-wide association studies using the empirical null distribution. Genome Biol. 18(1), 19 (2017). [DOI] [PMC free article] [PubMed] [Google Scholar]
- 40.Love MI, Huber W, Anders S. Moderated estimation of fold change and dispersion for RNA-seq data with DESeq2. Genome Biol. 15(12), 550 (2014). [DOI] [PMC free article] [PubMed] [Google Scholar]
- 41.Nica AC, Dermitzakis ET. Expression quantitative trait loci: present and future. Philos. Trans. R Soc. Lond. B Biol. Sci. 368(1620), 20120362 (2013). [DOI] [PMC free article] [PubMed] [Google Scholar]
- 42.Gaunt TR, Shihab HA, Hemani G. et al. Systematic identification of genetic influences on methylation across the human life course. Genome Biol. 17, 61 (2016). [DOI] [PMC free article] [PubMed] [Google Scholar]
- 43.Watanabe K, Taskesen E, Van Bochoven A, Posthuma D. Functional mapping and annotation of genetic associations with FUMA. Nat. Commun. 8(1), 1826 (2017). [DOI] [PMC free article] [PubMed] [Google Scholar]
- 44.Ward LD, Kellis M. HaploReg: a resource for exploring chromatin states, conservation, and regulatory motif alterations within sets of genetically linked variants. Nucleic Acids Res. 40(D1), D930–D934 (2011). [DOI] [PMC free article] [PubMed] [Google Scholar]
- 45.Consortium G. The genotype-tissue expression (GTEx) pilot analysis: multitissue gene regulation in humans. Science 348(6235), 648–660 (2015). [DOI] [PMC free article] [PubMed] [Google Scholar]
- 46.Braun KVE, Dhana K, De Vries PS. et al. Epigenome-wide association study (EWAS) on lipids: the Rotterdam Study. Clin. Epigenet 9, 15 (2017). [DOI] [PMC free article] [PubMed] [Google Scholar]
- 47.Dekkers KF, Van Iterson M, Slieker RC. et al. Blood lipids influence DNA methylation in circulating cells. Genome Biol. 17(1), 138 (2016). [DOI] [PMC free article] [PubMed] [Google Scholar]
- 48.Hedman AK, Mendelson MM, Marioni RE. et al. Epigenetic patterns in blood associated with lipid traits predict incident coronary heart disease events and are enriched for results from genome-wide association studies. Circ. Cardiovasc. Genet. 10(1), (2017). [DOI] [PMC free article] [PubMed] [Google Scholar]
- 49.Mamtani M, Kulkarni H, Dyer TD. et al. Genome- and epigenome-wide association study of hypertriglyceridemic waist in Mexican American families. Clin. Epigenetics 8, 6 (2016). [DOI] [PMC free article] [PubMed] [Google Scholar]
- 50.Pfeiffer L, Wahl S, Pilling LC. et al. DNA methylation of lipid-related genes affects blood lipid levels. Circ. Cardiovasc. Genet. 8(2), 334–342 (2015). [DOI] [PMC free article] [PubMed] [Google Scholar]
- 51.Sayols-Baixeras S, Subirana I, Lluis-Ganella C. et al. Identification and validation of seven new loci showing differential DNA methylation related to serum lipid profile: an epigenome-wide approach. The REGICOR study. Hum. Mol. Genet. 25(20), 4556–4565 (2016). [DOI] [PMC free article] [PubMed] [Google Scholar]
- 52.Truong V, Huang S, Dennis J. et al. Blood triglyceride levels are associated with DNA methylation at the serine metabolism gene PHGDH. Sci. Rep. 7(1), 11207 (2017). [DOI] [PMC free article] [PubMed] [Google Scholar]
- 53.Xie T, Gorenjak V, GS M. et al. Epigenome-wide association study (EWAS) of blood lipids in healthy population from STANISLAS Family Study (SFS). Int. J. Mol. Sci. 20(5), pii: E1014 (2019). [DOI] [PMC free article] [PubMed] [Google Scholar]
- 54.Irvin MR, Zhi D, Joehanes R. et al. Epigenome-wide association study of fasting blood lipids in the genetics of lipid-lowering drugs and diet network study. Circulation 130(7), 565–572 (2014). [DOI] [PMC free article] [PubMed] [Google Scholar]
- 55.Lai CQ, Wojczynski MK, Parnell LD. et al. Epigenome-wide association study of triglyceride postprandial responses to a high-fat dietary challenge. J. Lipid Res. 57(12), 2200–2207 (2016). [DOI] [PMC free article] [PubMed] [Google Scholar]
- 56.Yen CL, Farese RV., Jr MGAT2, a monoacylglycerol acyltransferase expressed in the small intestine. J. Biol. Chem. 278(20), 18532–18537 (2003). [DOI] [PubMed] [Google Scholar]
- 57.Schmidt S, Willers J, Stahl F. et al. Regulation of lipid metabolism-related gene expression in whole blood cells of normo- and dyslipidemic men after fish oil supplementation. Lipids Health Dis. 11, 172 (2012). [DOI] [PMC free article] [PubMed] [Google Scholar]
- 58.Willer CJ, Schmidt EM, Sengupta S. et al. Discovery and refinement of loci associated with lipid levels. Nat. Genet. 45(11), 1274–1283 (2013). [DOI] [PMC free article] [PubMed] [Google Scholar]
- 59.Shin SY, Fauman EB, Petersen AK. et al. An atlas of genetic influences on human blood metabolites. Nat. Genet. 46(6), 543–550 (2014). [DOI] [PMC free article] [PubMed] [Google Scholar]
- 60.Janssen U, Stoffel W. Disruption of mitochondrial beta -oxidation of unsaturated fatty acids in the 3,2-trans-enoyl-CoA isomerase-deficient mouse. J. Biol. Chem. 277(2), 19579–19584 (2002). [DOI] [PubMed] [Google Scholar]
- 61.Persson B, Kallberg Y, Bray JE. et al. The SDR (short-chain dehydrogenase/reductase and related enzymes) nomenclature initiative. Chem. Biol. Interact. 178(1–3), 94–98 (2009). [DOI] [PMC free article] [PubMed] [Google Scholar]
- 62.Cravatt BF, Demarest K, Patricelli MP. et al. Supersensitivity to anandamide and enhanced endogenous cannabinoid signaling in mice lacking fatty acid amide hydrolase. Proc. Natl Acad. Sci. USA. 98(16), 9371–9376 (2001). [DOI] [PMC free article] [PubMed] [Google Scholar]
- 63.Hubel C, Gaspar HA, Coleman JRI. et al. Genomics of body fat percentage may contribute to sex bias in anorexia nervosa. Am. J. Med. Genet. B Neuropsychiatr. Genet. 180(6), 428–438 (2019). [DOI] [PMC free article] [PubMed] [Google Scholar]
- 64.Kichaev G, Bhatia G, Loh PR. et al. Leveraging polygenic functional enrichment to improve GWAS power. Am. J. Hum. Genet. 104(1), 65–75 (2019). [DOI] [PMC free article] [PubMed] [Google Scholar]
- 65.He J, Kelly TN, Zhao Q. et al. Genome-wide association study identifies 8 novel loci associated with blood pressure responses to interventions in Han Chinese. Circ. Cardiovasc. Genet. 6(6), 598–607 (2013). [DOI] [PMC free article] [PubMed] [Google Scholar]
- 66.Hoffmann TJ, Choquet H, Yin J. et al. A large multiethnic genome-wide association study of adult body mass index identifies novel loci. Genetics 210(2), 499–515 (2018). [DOI] [PMC free article] [PubMed] [Google Scholar]
- 67.Justice AE, Winkler TW, Feitosa MF. et al. Genome-wide meta-analysis of 241,258 adults accounting for smoking behaviour identifies novel loci for obesity traits. Nat. Commun. 8, 14977 (2017). [DOI] [PMC free article] [PubMed] [Google Scholar]
- 68.Winkler TW, Justice AE, Graff M. et al. The influence of age and sex on genetic associations with adult body size and shape: a large-scale genome-wide interaction study. PLoS Genet. 11(10), e1005378 (2015). [DOI] [PMC free article] [PubMed] [Google Scholar]
- 69.Berndt SI, Gustafsson S, Magi R. et al. Genome-wide meta-analysis identifies 11 new loci for anthropometric traits and provides insights into genetic architecture. Nat. Genet. 45(5), 501–512 (2013). [DOI] [PMC free article] [PubMed] [Google Scholar]
- 70.Takeuchi F, Akiyama M, Matoba N. et al. Interethnic analyses of blood pressure loci in populations of East Asian and European descent. Nat. Commun. 9(1), 5052 (2018). [DOI] [PMC free article] [PubMed] [Google Scholar]
- 71.Hernandez DG, Singleton AB. Using DNA methylation to understand biological consequences of genetic variability. Neurodegener. Dis. 9(2), 53–59 (2012). [DOI] [PMC free article] [PubMed] [Google Scholar]
- 72.Bertola DR, Rodrigues MG, Quaio CR, Kim CA, Passos-Bueno MR. Vertical transmission of a frontonasal phenotype caused by a novel ALX4 mutation. Am. J. Med. Genet. A 161A(3), 600–604 (2013). [DOI] [PubMed] [Google Scholar]
- 73.Farhan SM, Wang J, Robinson JF. et al. Old gene, new phenotype: mutations in heparan sulfate synthesis enzyme, EXT2 leads to seizure and developmental disorder, no exostoses. J. Med. Genet. 52(10), 666–675 (2015). [DOI] [PubMed] [Google Scholar]
- 74.Lai HM, Chen CJ, Su BY. et al. Gout and type 2 diabetes have a mutual inter-dependent effect on genetic risk factors and higher incidences. Rheumatology (Oxford) 51(4), 715–720 (2012). [DOI] [PubMed] [Google Scholar]
- 75.Gadad BS, Raj P, Jha MK. et al. Association of novel ALX4 gene polymorphisms with antidepressant treatment response: findings from the CO-MED trial. Mol. Neuropsychiatry 4(1), 7–19 (2018). [DOI] [PMC free article] [PubMed] [Google Scholar]
- 76.Sladek R, Rocheleau G, Rung J. et al. A genome-wide association study identifies novel risk loci for type 2 diabetes. Nature 445(7130), 881–885 (2007). [DOI] [PubMed] [Google Scholar]
- 77.Drenos F, Talmud PJ, Casas JP. et al. Integrated associations of genotypes with multiple blood biomarkers linked to coronary heart disease risk. Hum. Mol. Genet. 18(12), 2305–2316 (2009). [DOI] [PMC free article] [PubMed] [Google Scholar]
- 78.Guay SP, Legare C, Houde AA, Mathieu P, Bosse Y, Bouchard L. Acetylsalicylic acid, aging and coronary artery disease are associated with ABCA1 DNA methylation in men. Clin. Epigenetics 6(1), 14 (2014). [DOI] [PMC free article] [PubMed] [Google Scholar]
- 79.Irvin MR, Aslibekyan S, Hidalgo B, Arnett D. CPT1A: the future of heart disease detection and personalized medicine? Clin. Lipidol. 9(1), 9–12 (2014). [DOI] [PMC free article] [PubMed] [Google Scholar]
- 80.Klucken J, Buchler C, Orso E. et al. ABCG1 (ABC8), the human homolog of the Drosophila white gene, is a regulator of macrophage cholesterol and phospholipid transport. Proc. Natl Acad. Sci. USA 97(2), 817–822 (2000). [DOI] [PMC free article] [PubMed] [Google Scholar]
- 81.Osborne TF. CREating a SCAP-less liver keeps SREBPs pinned in the ER membrane and prevents increased lipid synthesis in response to low cholesterol and high insulin. Genes Dev. 15(15), 1873–1878 (2001). [DOI] [PubMed] [Google Scholar]
- 82.Law SW, Lackner KJ, Hospattankar AV. et al. Human apolipoprotein B-100: cloning, analysis of liver mRNA, and assignment of the gene to chromosome 2. Proc. Natl Acad. Sci. USA 82(24), 8340–8344 (1985). [DOI] [PMC free article] [PubMed] [Google Scholar]
- 83.Tarrade A, Panchenko P, Junien C, Gabory A. Placental contribution to nutritional programming of health and diseases: epigenetics and sexual dimorphism. J. Exp. Biol. 218(1), 50–58 (2015). [DOI] [PubMed] [Google Scholar]
- 84.Julian CG, Pedersen BS, Salmon CS. et al. Unique DNA methylation patterns in offspring of hypertensive pregnancy. Clin. Transl. Sci. 8(6), 740–745 (2015). [DOI] [PMC free article] [PubMed] [Google Scholar]
- 85.Herrera E, Ortega-Senovilla H. Lipid metabolism during pregnancy and its implications for fetal growth. Curr. Pharm. Biotechnol. 15(1), 24–31 (2014). [DOI] [PubMed] [Google Scholar]
- 86.Grimes SB, Wild R. Effect of pregnancy on lipid metabolism and lipoprotein levels. : Endotext. Feingold KR, Anawalt B, Boyce Aet al.. et al. (). MD Text.com Inc, MA, USA: (2000). www.ncbi.nlm.nih.gov/books/NBK498654/ [Google Scholar]
- 87.La Frano MR, Carmichael SL, Ma C. et al. Impact of post-collection freezing delay on the reliability of serum metabolomics in samples reflecting the California mid-term pregnancy biobank. Metabolomics 14(11), 151 (2018). [DOI] [PubMed] [Google Scholar]
- 88.Tirado-Magallanes R, Rebbani K, Lim R, Pradhan S, Benoukraf T. Whole genome DNA methylation: beyond genes silencing. Oncotarget 8(3), 5629–5637 (2017). [DOI] [PMC free article] [PubMed] [Google Scholar]
- 89.Barfield RT, Almli LM, Kilaru V. et al. Accounting for population stratification in DNA methylation studies. Genet. Epidemiol. 38(3), 231–241 (2014). [DOI] [PMC free article] [PubMed] [Google Scholar]
- 90.Dhana K, Braun KVE, Nano J. et al. An epigenome-wide association study of obesity-related traits. Am. J. Epidemiol. 187(8), 1662–1669 (2018). [DOI] [PMC free article] [PubMed] [Google Scholar]