Abstract
Exposure to endocrine disrupting chemicals (EDCs) used in plastic manufacturing processes may be contributing to the current increase in metabolic disorders. Here, we determined that benzyl butyl phthalate (BBP), a common EDC and food packaging plasticizer, mixed into chow diet (CD) and high fat diets (HFD) at varying concentrations (4 μg/kg body weight (bw)/day, 169 μg/kg bw/day, 3 mg/kg bw/day, 50 mg/kg bw/day) produced a number of detrimental and sex-specific metabolic effects in C57BL/6 male and female mice after 16 weeks. Male mice exposed to moderate (3 mg/kg bw/day) concentrations of BBP in an HFD were especially affected, with significant increases in body weight due to significant increases in weight of liver and adipose tissue. Other doses did not show any significant changes when compared to only CD or HFD alone. HFD in the presence of 3 mg/kg bw/day BBP showed significant increases in fasting blood glucose, glucose intolerance, and insulin intolerance when compared to HFD alone. Furthermore, this group significantly alters transcriptional regulators involved in hepatic lipid synthesis and its downstream pathway. Interestingly, most of the BBP doses had no phenotypic effect when mixed with CD and compared to CD alone. The female mice did not show a similar response as the male population even though they consumed a similar amount of food. Overall, these data establish a dose which can be used for a BBP-induced metabolic research model and suggest that a moderate dosage level of EDC exposure can contribute to widely ranging metabolic effects.
Keywords: BBP, HFD, obesity, diabetes, hepatic lipid synthesis, SREBP1
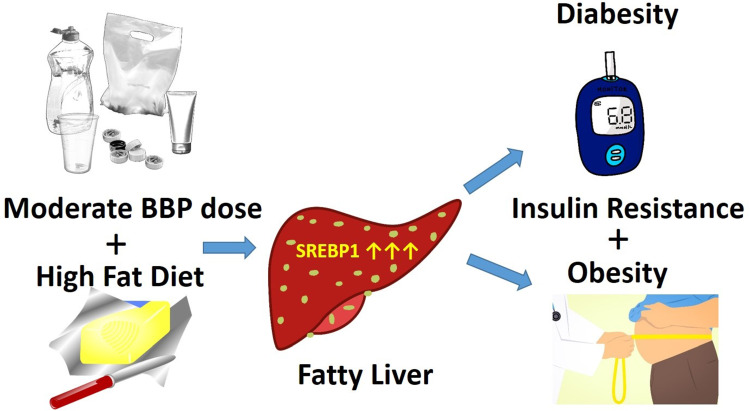
Graphical Abstract
Graphical Abstract.
Introduction
Over the past five decades, global rates for obesity, diabetes, and metabolic disease have exponentially increased [1, 2]. The International Diabetes Federation has estimated that around 415 million people had diabetes in 2015 [3], with the World Health Organization currently estimating that 650 million people are obese and over two billion people are overweight worldwide [4]. The upcoming epidemics’ effects on the world’s morbidity and mortality rates will produce enormous social and financial burdens for society [5–7]. While the medical community has recognized pathogenic criteria associated with metabolic disease, including genetic background, increased caloric intake, physical inactivity, sleep deficit, and aging [8], additional research has shown that these traditional risk factors cannot fully account for the rapid growth in diabetes’ rates [2]. Among various environmental factors involved in the development of metabolic disease, endocrine disrupting chemicals (EDCs) have been identified as potential instigators [9], with the current increases in obesity and metabolic disease rates correlating with increases in EDC generation and usage [10, 11]. While there is an awareness of the growing obesity epidemics and risk factors, the specific effects of EDCs, such as plasticizer phthalates, are still understudied compared to diet and lifestyle [12–15].
Plastics are an everyday component of modern life, with their unbound chemicals, including bisphenol A (BPA), styrene, and phthalates, constantly leaching into the surrounding environment [16]. Phthalates, in particular, are under increased scrutiny from the general public, regulatory agencies, and the scientific community due to their widespread use, increased production volume, and adverse health effects [17]. Phthalates include groupings of similar diesters of phthalic acid, which are generally used as plasticizers in softening flexible polyvinyl chloride plastics [16]. Widely used in packaging and food processing, food consumption of phthalates is the primary source of human exposure [18]. A common plasticizer example found in vinyl products, flooring, paints, adhesives, children’s toys, and food packaging is benzyl butyl phthalate (BBP), one of the most widely used phthalates [19]. With regular chronic exposure in the modern environment, BBP is a good candidate for study as an endocrine disruptor.
Most studies involving BBP have investigated the reproductive system with its effects on sex hormones [20, 21], including phenotypic alterations observed in male offspring rats exposed to BBP during the perinatal period displaying reproductive disorders, including cryptorchidism, hypospadias, and low sperm counts [22]. However, some of the more recent studies have been investigating the links between phthalate exposure and metabolic effects [23]. Recently, the “obesogen” hypothesis has been proposed around various endocrine disruptors, which interfere with the action of hormones and promote weight gain [13, 24]. A study by Schmitt et al. [20] demonstrated that disruption to levels of testosterone and 17-β estradiol via BBP decreased the wheel running in mice, with a significant increase in fat mass of BBP-treated males at 20 weeks. However, there have been no in vivo studies specifically looking at the obesogenic effects of BBP and its link to diabetes.
To better investigate these EDC effects, the dose is another important factor that must be considered during experimental design using animal models. The dose is an important, and often debated, issue in toxicological and other studies of chemical effects, and recently, the linear relationship between dose concentration and response has been questioned [25, 26]. For instance, Schmitt et al. [20] exposed maternal mice and their offspring to a very high dose of BBP (500 mg/kg/day) to study perinatal effects, which altered hormone response but not body composition. Yet surprisingly low doses of endocrine disruptors have been shown to produce demonstrable effects. An early example of a low-dose effect was the prostate enlargement in mice following a low dose of diethylstilbestrol (DES) (0.02 μg/kg/day) delivered to their mothers [27]. Therefore, to determine if BBP shows a linear or nonmonotonic dose response, it is necessary to test a range of BBP doses.
EDCs have also been known to provoke synergistic effects with multiple stressors present. The anti-androgenic activities of phthalate mixtures have been shown to display combinatorial interactions, with a tendency to synergize at high concentrations and antagonize at low concentrations [28]. Epidemiological evidence has shown associations between EDC exposure and metabolic disorders [29, 30]. Subpopulations that have the highest rates of obesity or diabetes are also those that have greater physiological exposure to EDCs, including polychlorinated biphenyls, BPA, or dioxins [31–33]. Our and other previous studies have shown that BBP induces epigenetic stress to promote adipogenesis in C3H10T1/2 stem cells and 3T3-L1 preadipocytes [34–36]. In addition, underlying regulatory mechanisms, where the chemical environment contributes to metabolic dysregulation, remain understudied [19, 37, 38]. As such, lower concentrations of phthalate exposure should still be of concern when observing environmental effects on human or animal populations.
Despite recent associations between endocrine disruptors and obesity, little is known about the specific dose effects of EDCs involved with a high fat diet (HFD) in a sex-specific manner. This study investigated the synergistic effects of BBP at variable concentrations on both male and female mice exposed to HFD. This study shows that research on EDCs, especially those investigating obesity and diabetes, should test multiple dosages to detect for nonmonotonic responses in a sex-specific manner, especially when testing with multiple stressor variables, including diet.
Materials and Methods
Mice
C57BL/6 J male and female mice were housed in ventilated cages in a 12:12 h light/dark cycle with access to water and chow diet (CD) ad libitum. Mice were produced from an in-house colony (parental mice were purchased from Jackson Laboratories). All procedures were performed in strict accordance and approval from the Institutional Animal Care and Use Committee (IACUC) of the Institute of Biosciences & Technology at Texas A&M Health Science Center.
Eight week-old mice were randomized into 10 groups with 4–6 mice per group, and fed CD (4.5% fat) or a high-fat diet (HFD, 60% fat) (Research Diet D12492), with or without variable dose levels of BBP for 16 weeks. BBP was mixed in with CD and HFD at varying concentrations (BBP1 (low: 4 μg/kg/day), BBP2 (intermediate: 169 μg/kg/day), BBP3 (moderate: 3 mg/kg/day), and BBP4 (high: 50 mg/kg/day)). After 16 weeks of diet exposure, mice were euthanized, and tissues were collected for further analysis. Various tissues including heart, lung, liver, white adipose, brown adipose, subcutaneous adipose, kidney, ovaries or testes, brain, and skeletal muscle were excised, weighed, and flash frozen in liquid nitrogen for long-term storage.
Food consumption
Food consumption was calculated by measuring food consumed over a 3-day period (e.g. 4 pm on Friday evening, ending at 4 pm on Monday evening) at the indicated time points. The weight of diet and feed rack were measured at 0 h and after 72 h. The calculation was performed as follows: (Beginning weight (g)-Ending weight (g)/# mice in the cage)/3 days of food consumption = average food consumption in grams per mouse per day.
Body Weight and Fasting Blood Glucose
Nonfasted mice were weighed biweekly (same day of the week and time, e.g. ~ 9:00 a.m.). Mice were fasted overnight and fasting blood glucose was measured within 14–16 h of fasting using a glucometer (McKesson, TX, USA). A blood sample was drawn from the tail and applied to the glucose test strip. The first blood sample (drop) was discarded and measurements were performed on the second blood sample.
Glucose and insulin tolerance tests
Animals were fasted overnight and a glucose tolerance test (GTT) was performed using 2 g of glucose (Sigma, CA, USA) per kilogram body weight, administered by intraperitoneal injection. Glucose readings were taken at baseline (time = 0 min) and at 15, 30, 60, and 120 min at tail vein after injection.
An insulin tolerance test (ITT) was conducted using insulin (Sigma) at 0.75 Units/kg body weight (male) and 0.6 Units/kg body weight (female) administered by intraperitoneal injection. Animals were fasted (5 h), and blood glucose was tested by tail vein at baseline (time = 0 min) and at 15, 30, 60, and 120 min after injection.
mRNA isolation and quantitative real-time PCR
Total RNA was extracted from the liver using miRNeasy kit (Qiagen, Hilden, Germany) according to the manufacturer’s instructions, and quantitative real-time PCR (qPCR) was performed as described previously [39]. RNA samples were reverse-transcribed for cDNA synthesis, and qPCR was performed using SYBR Green PCR Master Mix (Life Technologies, CA, USA), using gene specific primer sequences provided in Supplemental Table 1. All reactions were carried out at 95°C for 10 min, followed by 40 cycles of 95°C for 15 s and 60°C for 1 min. PCR reactions of each sample were conducted in duplicate. All samples were normalized to 18S for mRNA. The 2−ΔΔCt method was used for quantification analysis and represented as fold change.
Western blot analysis
Liver nuclear fractions were isolated in Nuclear Extraction kit containing protease inhibitor cocktail (Epigentek, NY, USA). An equal amount of total protein (30 μg) was loaded onto SDS-PAGE, with western blot analysis performed as described previously [38]. Briefly, the protein was separated by electrophoresis and then transferred to polyvinylidene difluoride membranes (PVDF). After blocking with Odyssey Blocking Buffer (LI-COR Biosciences, NE, USA), then incubated with primary antibodies (Supplementary Table 2) including PPARγ, SREBP1, SREBP2, and lamin B1 overnight, membranes were followed by LiCorIRDye® secondary antibodies (LI-COR Biosciences, 1:10 000) for 1 h. Membranes were washed three times with TBST and detected using a LiCor Odyssey scanner (LI-COR Biosciences). Quantification of proteins was calculated using Image Studio software (LI-COR Biosciences).
Statistics
All results were expressed as mean ± SEMs. The one-way, and/or two-way ANOVA with appropriate post tests were performed as appropriate across all data sets. Additionally, t-tests were also performed as needed across specific data sets. Statistical significance began with P values < 0.05. *indicates one-way ANOVA, and listed number indicates t-test. Statistical analysis was performed using Prism 6.0.
RESULTS
Moderate BBP dose in the presence of HFD alters body weight and phenotype without altering food consumption
To determine the effects of varying concentrations of BBP in combination with HFD on obesity and diabetes phenotype in mice, body weight was measured. Body weight of all groups on diet were shown to have increased trajectory as weeks progressed (Fig. 1A, B, D, and E). Body weight of end time point is shown in Fig. 1C for female and F for male. There was no change in female mouse body weight in CD or HFD in combination with any dose of BBP at 16 weeks (Figs 1C and 2). The body weight of female mice in HFD was significantly heavier than that in CD (P = 0.0312, t-test, Fig. 1C). Similarly, the body weight of male mice in HFD was significantly heavier than that in CD (P = 0.0131, t-test, Fig. 1F). However, in male mice, HFD + BBP3 showed a significantly heavier body weight than HFD (P = 0.0207, t-test, Fig. 1F). For CD diet, no significant difference was found between CD and CD + BBP by one-way ANOVA (Fig. 1F). Images of mice were taken at week 16 on diet, with the HFD + BBP3 male group showing the most visible physical changes toward obesity (Fig. 2, highlighted). Although there were changes in body weight in male mice fed HFD + BBP3, there were no significant changes in food consumption based on sex or diet group by two-way ANOVA (Fig. 3).
Figure 1.
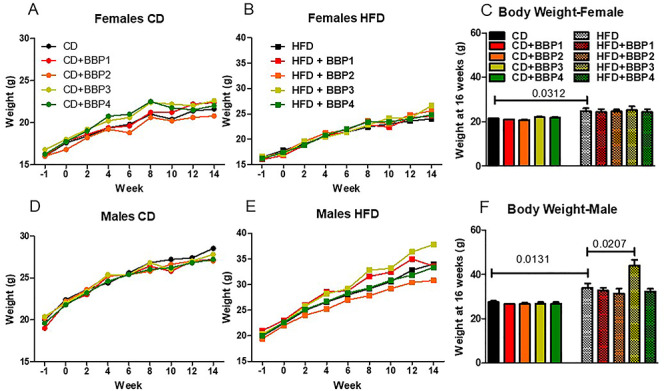
The effects of BBP on body weight in HFD-fed male mice. The body weight of mice exposed to CD or HFD alone or in combination with BBP1, BBP2, BBP3, or BBP4 was measured. (A) Body weight of female mice fed CD groups 1 week prior to the diet exposure through 14 weeks of diet exposure. The start of the study and diet exposure is represented by 0 on the x-axis. (B) Body weight of female mice fed HFD groups for 14 weeks of diet exposure. (C) Endpoint body weight at 16 weeks of female mice in CD and HFD groups. (D) Body weight of male mice fed CD groups 1 week prior to the diet exposure through 14 weeks of diet exposure. (E) Body weight of male mice fed HFD groups for 14 weeks of diet exposure. (F) Endpoint body weight at 16 weeks of male mice in CD and HFD groups. N = 4–6 mice/group, one-way ANOVA with Tukey’s post hoc test or t-test analysis was performed; number indicates t-test.
Figure 2.
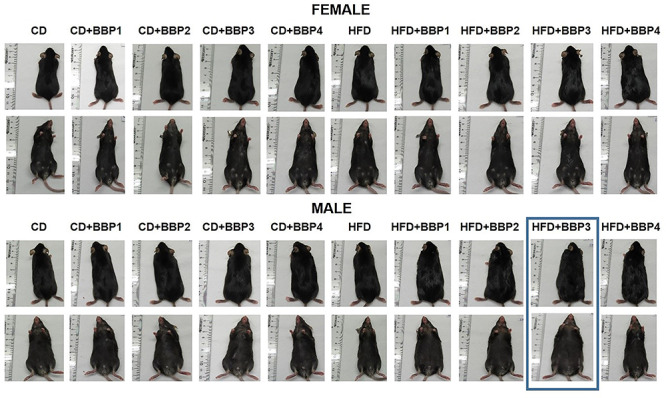
The effects of BBP exacerbate male weight gain from HFD. Representative images of gross mouse phenotype of female and male mice fed CD+/-BBP concentrations (left panels) through HFD+/-BBP concentrations (right panels) at 16 weeks of diet and BBP exposure.
Figure 3.
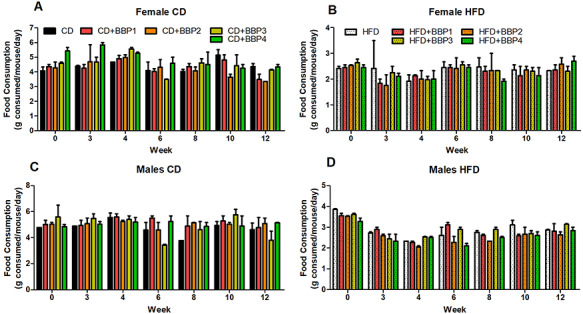
The effects of BBP on food consumption. Food consumption was measured bi-weekly for 12 weeks in CD or HFD alone (black/white) or in combination with BBP1, BBP2, BBP3, or BBP4. Food consumption for 12 weeks in female mice in the (A) CD groups and (B) HFD groups. Food consumption for 12 weeks in male mice in the (C) CD groups and (D) HFD groups. N = 2 cages/group, two-way ANOVA analysis was performed.
Moderate BBP dose in the presence of HFD alters liver and subcutaneous adipose tissue weight
In order to investigate the effect of BBP on tissue or organs of mice, tissue and organ weight were measured. As a vital metabolic organ, BBP diet exposure effects on liver weight were analyzed. Liver weight was increased significantly in male mice fed HFD + BBP3 compared to male HFD controls (P < 0.05, one-way ANOVA, Fig. 4B). Liver appearance was altered by the HFD + BBP3 exposure compared to the HFD (Fig. 4C). No difference in liver weights were found in male mice fed on CD and CD + BBP diet or CD and HFD. In contrast, in female mice, CD + BBP1 and CD + BBP2 significantly decreased the liver weight compared to CD (P < 0.01 and P < 0.001, respectively, one-way ANOVA, Fig. 4A). Interestingly, CD showed a heavier liver weight than HFD (P = 0.0143, t-test, Fig. 4A) in female mice.
Figure 4.
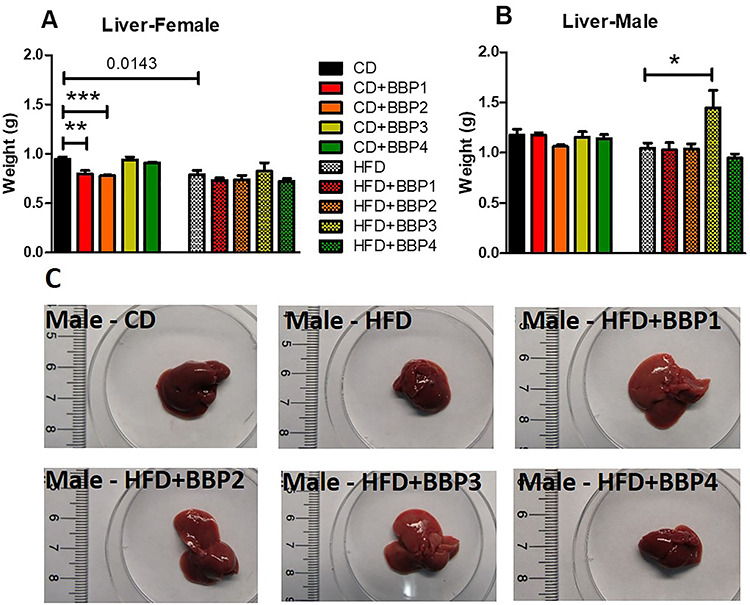
The effects of BBP with HFD, which alters the male liver phenotype. (A and B) Final 16 week liver weights of female and male mice fed CD, CD + BBP1, CD + BBP2, CD + BBP3, CD + BBP4 or HFD, HFD + BBP1, HFD + BBP2, HFD + BBP3, and HFD + BBP4 diets. N = 4–6 mice/group, one-way ANOVA with Tukey’s post hoc test analysis or t-test was performed. (*P < 0.05, **P < 0.01, and ***P < 0.01, one-way ANOVA). (C) Representative images of livers ex vivo from male mice fed CD and HFD+/-BBP for 16 weeks.
Analysis was performed on the weight of the inner body adipose tissue due to effects of the BBP-inclusive diet. White adipose tissue (WAT) weight was increased significantly in both HFD female mice groups compared to CD female mice (P = 0.0082, t-test, Fig. 5A) and HFD male compared to CD male (P = 0.0159, t-test, Fig. 5B). No change was found between HFD + BBP3 and HFD in WAT weight of both female and male mice, though there was an increasing trend for male HFD + BBP3 (Fig. 5C).
Figure 5.
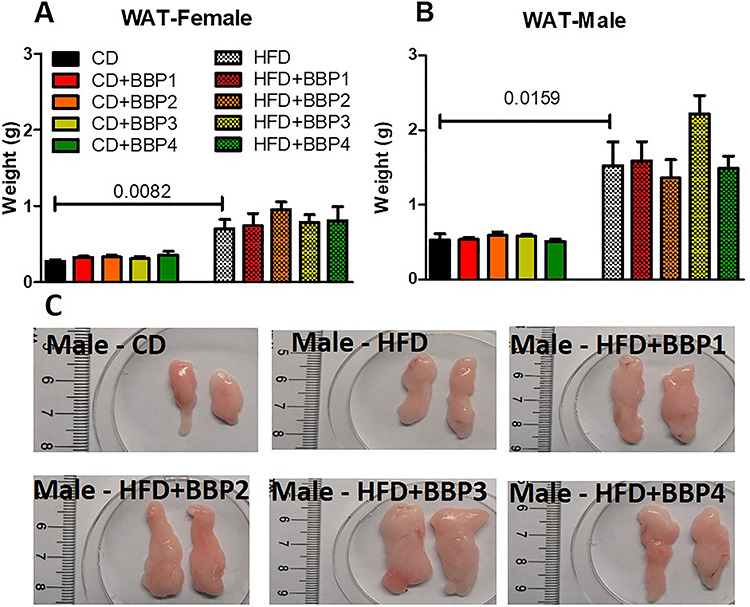
The effects of BBP plus HFD on white adipose tissue weight. (A) and (B) Final 16 week WAT weights of female and male mice fed CD, CD + BBP1, CD + BBP2, CD + BBP3, CD + BBP4 or HFD, HFD + BBP1, HFD + BBP2, HFD + BBP3, and HFD + BBP4 diets. N = 4–6 mice/group, one-way ANOVA with Tukey’s post hoc test analysis or t-test was performed. (C) Representative images of WAT ex vivo from male mice fed CD and HFD+/-BBP for 16 weeks.
Effects of the BBP-permeated diet on subcutaneous adipose tissue (SubQ WAT) weight were analyzed. SubQ WAT was increased significantly in HFD female mice groups compared to their respective CD female mice control (P = 0.0058, t-test, Fig. 6A). SubQ WAT in HFD male mice were significantly increased over CD male control (P = 0.0285, t-test, Fig. 6B). In HFD, the most significant difference was that of HFD + BBP3 male mice increased SubQ WAT compared to HFD male mice (P < 0.01, one-way ANOVA, Fig. 6B and C).
Figure 6.
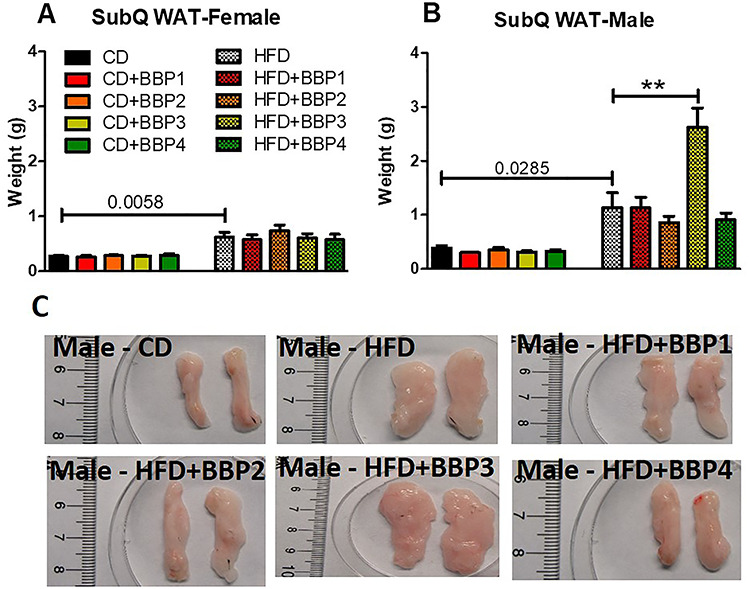
The effects of BBP plus HFD specifically increase male subcutaneous adipose tissue weight. (A) and (B) Final 16 week SubQ WAT weights of female and male mice fed CD, CD + BBP1, CD + BBP2, CD + BBP3, CD + BBP4 or HFD, HFD + BBP1, HFD + BBP2, HFD + BBP3, and HFD + BBP4 diets. N = 4–6 mice/group, one-way ANOVA with Tukey’s post hoc test analysis or t-test was performed. (**P < 0.01, one-way ANOVA). (C) Representative images of SubQ WAT ex vivo from male mice fed CD and HFD+/-BBP for 16 weeks.
Analysis was done on brown adipose tissue (BAT) weight due to the effects of various BBP-containing diets. BAT weight was increased significantly in both HFD female mice groups compared to their respective CD female mice control (P = 0.0594, t-test, Fig. 7A) and HFD male mice compared to CD male mice (P = 0.0257, t-test, Fig. 7B). No change was found between HFD + BBP3 and HFD in BAT weight of both female and male mice, though there was an increasing trend for male HFD + BBP3 (Fig. 7C).
Figure 7.
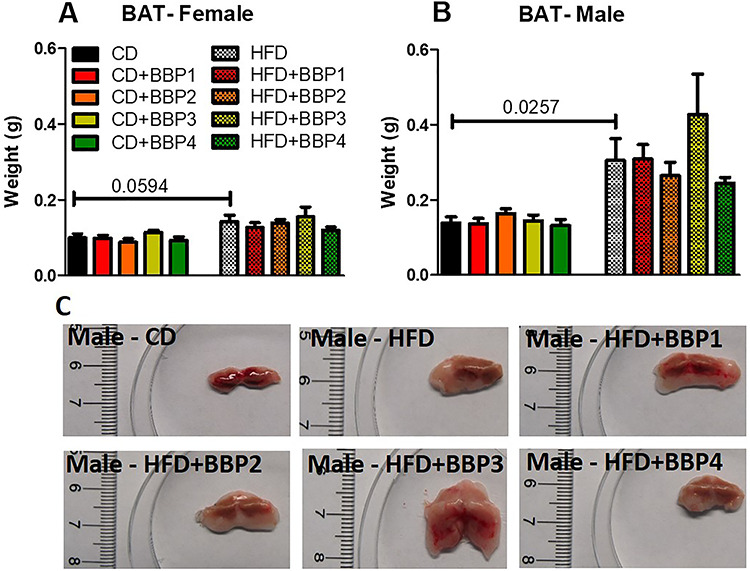
The effects of BBP plus HFD increase male brown adipose tissue weight. (A and B) Final 16 week BAT weights of female and male mice fed CD, CD + BBP1, CD + BBP2, CD + BBP3, CD + BBP4 or HFD, HFD + BBP1, HFD + BBP2, HFD + BBP3, and HFD + BBP4 diets. N = 4–6 mice/group, one-way ANOVA with Tukey’s post hoc test analysis or t-test was performed. (C) Representative images of BAT ex vivo from male mice fed CD and HFD+/-BBP for 16 weeks.
The effects of BBP-incorporated diets on the skeletal muscle weight were analyzed. Skeletal muscle weight was significantly increased in female HFD + BBP1 and HFD + BBP2 groups compared to HFD (P < 0.001 and P < 0.01, respectively, one-way ANOVA) but decreased in female CD + BBP3 and CD + BBP4 compare to CD controls (P < 0.01, one-way ANOVA, Fig. 8A). In male, CD + BBP2 significantly decreased the skeletal muscle weight compared to CD males (P < 0.05, one-way ANOVA, Fig 8B).
Figure 8.
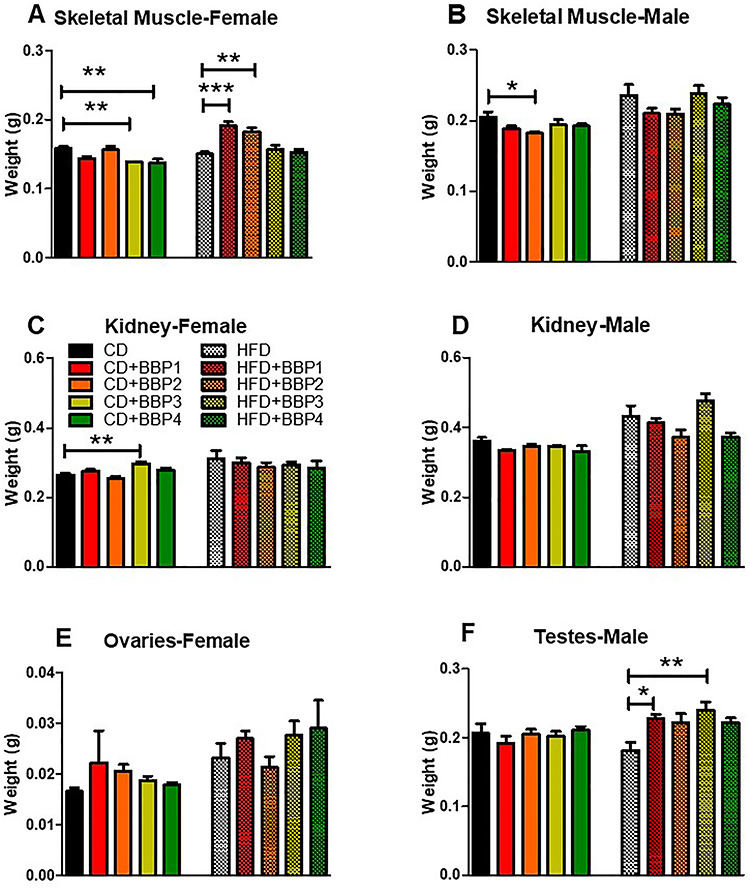
The effects of BBP on other tissue and organs. At 16 weeks, (A and B) weight of skeletal muscle, (C and D) kidney, (E) ovary, and (F) testes in female or male mice fed CD, CD + BBP1, CD + BBP2, CD + BBP3, CD + BBP4 or HFD, HFD + BBP1, HFD + BBP2, HFD + BBP3, and HFD + BBP4 diets. N = 4–6 mice/group, one-way ANOVA with Tukey’s post hoc test analysis or t-test was performed. (***P < 0.001, **P < 0.01 and *P < 0.05, one-way ANOVA, respectively).
The kidney is another vital organ that can be affected by changes in diet and BBP. Kidney weight was significantly increased in the CD + BBP3 female mice group compared to the CD female control (P < 0.01, one-way ANOVA, Fig. 8C). However, no changes were found in male groups (Fig. 8D).
Long-term EDC exposure effects on the testes and ovaries are known in the literature [22]. In our study, ovary weight was not changed by BBP (Fig. 8E). In contrast, testes’ weight was increased in the HFD + BBP1 and HFD + BBP3 groups compared to the HFD control (P < 0.05 and P < 0.01, respectively, one-way ANOVA, Fig. 8F). No change was found between HFD + BBP3 and HFD in weight of male muscle and kidney.
No significant differences in heart, lung, and brain weight were observed (Supplementary Fig. 1).
Altered fasting blood glucose under BBP exposure
Fasting blood glucose was measured at the experiment endpoint to determine if diabetic onset had occurred. CD + BBP3 female mice exhibited significantly increased fasting blood glucose levels compared to its CD controls (P < 0.01, one-way ANOVA, Fig. 9A). Fasting blood glucose levels were also higher in HFD than in CD, both in female and male groups (P = 0.0190 and P = 0.0252, respectively, t-test, Fig. 9A and B). Furthermore, in males, HFD + BBP3 significantly increased fasting blood glucose levels compared to HFD (P < 0.05, one-way ANOVA, Fig. 9B).
Figure 9.

The effects of BBP on fasting blood glucose in HFD fed mice. (A) and (B) Fasting blood glucose was assessed in female and male mice placed on CD, CD + BBP1, CD + BBP2, CD + BBP3, CD + BBP4 or HFD, HFD + BBP1, HFD + BBP2, HFD + BBP3, and HFD + BBP4 at 16 weeks. N = 4–6 mice/group, one-way ANOVA with Tukey’s post hoc test analysis or t-test was performed. *P < 0.05 in female CD + BBP3 compared to CD and in male HFD + BBP3 compared to HFD (one-way ANOVA). HFD increased fasting blood glucose compared to CD in both female and male (P = 0.0190 and P = 0.0252, t-test, respectively).
Altered glucose tolerance and insulin sensitivity under BBP exposure in the presence of HFD
Diabetic phenotype was analyzed by assessing a GTT over the course of 16 weeks on diet. At 6 weeks, CD + BBP2 female mice had a significantly elevated glucose intolerance compared to CD female control (P < 0.01, one-way ANOVA, Fig. 10iA and B). At 16 weeks, the CD + BBP3 female glucose intolerance was significantly increased compared to the CD female group (P = 0.0249 Fig. 10iI and J). No changes were found in female HFD groups and female 10-week CD group (Fig. 10iC–H, K and L). For males, CD + BBP3 increased the glucose intolerance compared to CD at 6 weeks (P = 0.0224, t-test, Fig. 10iiA and B) and HFD + BBP3 impaired the glucose clearance compared to HFD at 16 weeks (P = 0.0415, t-test, Fig. 10iiK and L) respectively. No changes were found in males for other time points between BBP3 and its control (Fig. 10iiC–J).
Figure 10.
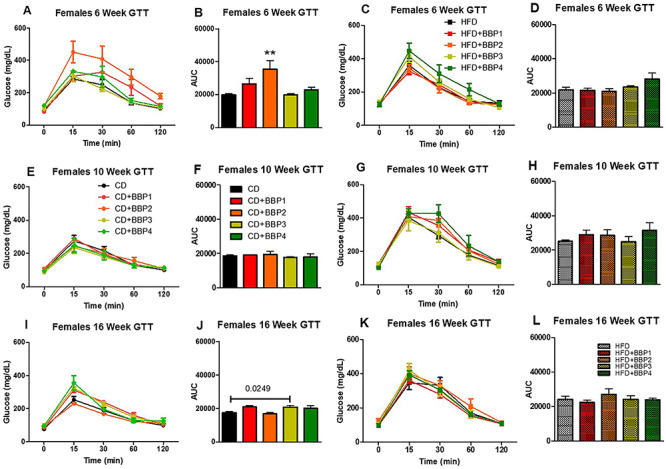
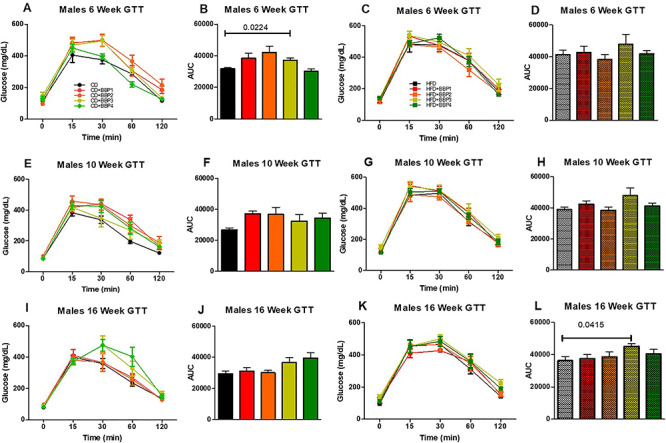
The effects of BBP on glucose intolerance in HFD fed mice. IP GTTs were performed at (A and C) 6 weeks, (E and G) 10 weeks, and (I and K) 16 weeks on CD, CD + BBP1, CD + BBP2, CD + BBP3, CD + BBP4 or HFD, HFD + BBP1, HFD + BBP2, HFD + BBP3, and HFD + BBP4 fed female (10i) and male (10ii) mice. Area under the curve (AUC) analysis of corresponding panels at (B and D) 6 weeks, (F and H) 10 weeks, and (J and L) 16 weeks on CD, CD + BBP1, CD + BBP2, CD + BBP3, CD + BBP4 or HFD, HFD + BBP1, HFD + BBP2, HFD + BBP3, and HFD + BBP4 female (10i) and male (10ii) mice. N = 4–6 mice/group, one-way ANOVA with Tukey’s post hoc test analysis or t-test was performed. For female, at 6 weeks, **P < 0.01, one-way ANOVA, CD + BBP2 female mice compared to CD female control. At 16 weeks, P = 0.0249, t-test, in CD + BBP3 female mice compared to CD female control. For male, at 6 weeks, P = 0.0224, t-test, CD + BBP3 male mice compared to CD male control. At 16 weeks, P = 0.0415, t-test, in HFD + BBP3 male mice compared to HFD male control.
Changes toward diabetic phenotype were also observed by analyzing insulin tolerance (ITT) over the course of 16 weeks. In females, insulin tolerance significantly changed in 15 weeks between CD + BBP3 and CD (P < 0.01, one-way ANOVA, Fig. 11iI and J). Female groups were unchanged for other CD and HFD combinations (Fig. 11iA–H, K and L). For males, a significant change in insulin tolerance was also found in 15 weeks but between HFD + BBP3 and HFD (P < 0.01, one-way ANOVA, Fig. 11iiK and L). No change was found in males for other comparisons between BBP3 and CD or HFD control (Fig. 11iiA–J).
Figure 11.
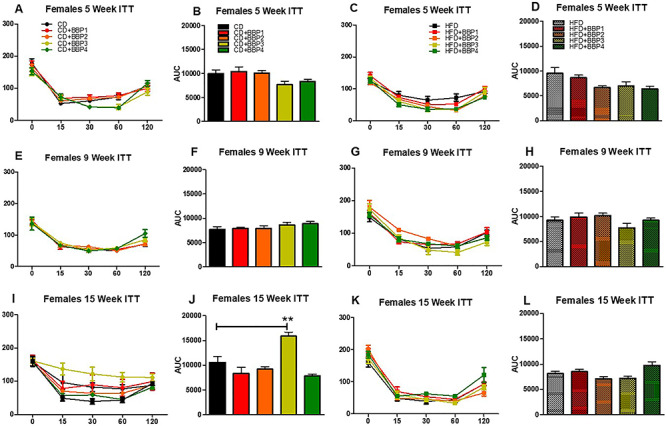
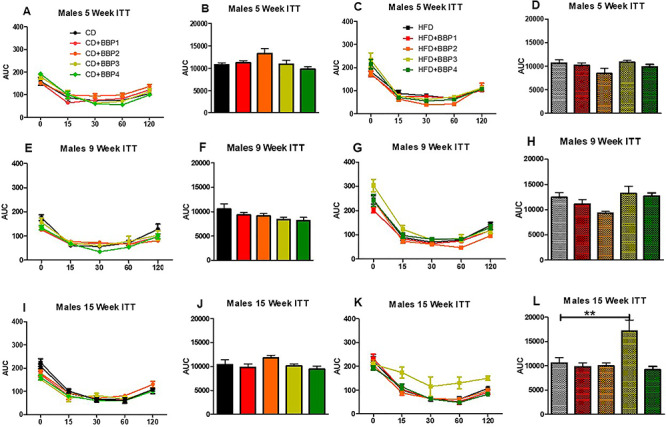
The effects of BBP on insulin sensitivity in HFD fed mice. IP ITTs were performed at (A and C) 5 weeks, (E and G) 9 weeks, and (I and K) 15 weeks on CD, CD + BBP1, CD + BBP2, CD + BBP3, CD + BBP4 or HFD, HFD + BBP1, HFD + BBP2, HFD + BBP3, and HFD + BBP4 fed female (11i) and male (11ii) mice. AUC analysis of corresponding panels at (B and D) 5 weeks, (F and H) 9 weeks, and (J and L) 15 weeks on CD, CD + BBP1, CD + BBP2, CD + BBP3, CD + BBP4 or HFD, HFD + BBP1, HFD + BBP2, HFD + BBP3, and HFD + BBP4 female (11i) and male (11ii) mice. N = 4–6 mice/group, one-way ANOVA with Tukey’s post hoc test analysis or t-test was performed. For female, at 15 weeks, **P < 0.01, one-way ANOVA, CD + BBP3 female mice compared to CD female control. For male, at 15 weeks, **P < 0.01, one-way ANOVA, HFD + BBP3 male mice compared to HFD male control.
Altered lipid metabolism biomarkers under BBP exposure in the presence of HFD in liver of male mice
A derangement of lipid metabolism is an early event contributing to the development of hyperinsulinemia and insulin resistance, as these are prominent characteristics of diabetes and obesity. Therefore, we investigated the effect of a moderate dose BBP3 on lipid metabolism-related biomarkers in the liver of male mice of two groups (HFD with or without BBP3), for these two groups showed significant differences for most of the phenotypes. We demonstrated that the moderate dose BBP3 plus HFD had a significant activation of transcription factor, sterol regulatory element-binding protein 1 (SREBP1) in nuclear fraction, when compared to HFD mice (P < 0.05) (Fig. 12A). On the other hand, no changes were seen in SREBP2, which stimulates cholesterol synthesis and peroxisome proliferator-activated receptor gamma (PPARγ), known as an adipogenesis related-transcription factor and modulates lipid synthesis genes (Fig. 12A). As expected, downstream regulatory genes of SREBP1, such as fatty acid synthase (FAS), acetyl-CoA carboxylase (ACC), and HMG-CoA reductase (HMGCR), show enhanced gene expression level via BBP3 addition in HFD (P < 0.05, Fig. 12B). The pattern of hepatic gluconeogenesis enzymes such as PEPCK, G6Pase, and SREBP1c showed an increased trend (Fig. 12B).
Figure 12.
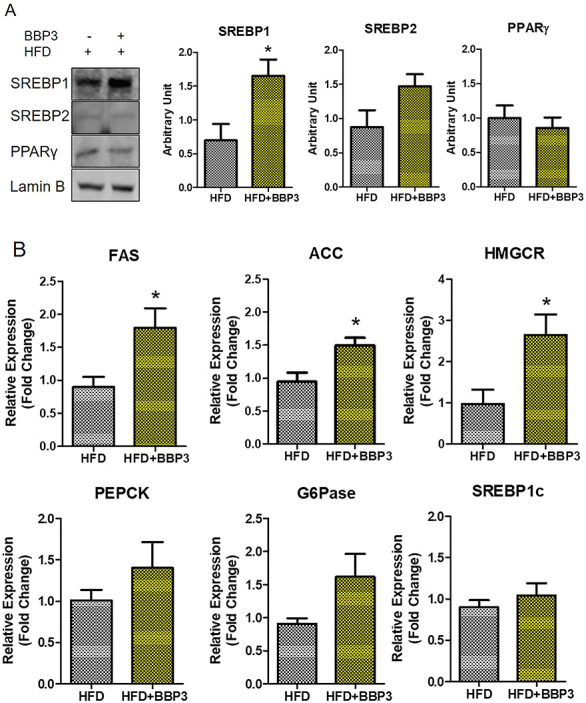
BBP3 promotes SREBP1 activation and its downstream target genes in liver of male HFD mice. (A) The translocation levels of lipid metabolism related transcription factors in the liver. One representative blot of four different experiments is shown. Protein expression was normalized to lamin B. (B) The expression level of lipid metabolism-related genes. Data were normalized against 18S (N = 3–4). The data are shown as the mean ± SEM. *P < 0.05 HFD + BBP3 versus the HFD control, t-test.
DISCUSSION
The recent epidemics of metabolic diseases, obesity, liver lipid disorders and metabolic syndrome have generally been assigned to one’s genetic background amid changes in diet, exercise, and aging [40]. However, there is now evidence that other environmental factors may contribute to this rapid increase in the occurrence of metabolic diseases [41]. Chronic exposure to environmental chemicals has known adverse effects on human health and survival [42]. It has now been suspected that these environmental factors, including EDCs, can cause dysregulation in metabolically active tissues that result in increased susceptibility to type 2 diabetes (T2D) and obesity [43]. These implicated EDCs include common plasticizers such as phthalates, which are constantly leached into the environment from varied sources and are produced in ever greater volumes for industrial use [16].
Diet has long been presumed to be the main source of human exposure to phthalates, since these chemicals are used during food production and in packaging [44]. Fatty foods such as oils, dairy, meat, and fish contain the highest level of phthalates, which is concerning as they are the most calorically dense high-fat foods available in the developed world [45]. Leung et al. has shown that maternal rat exposure to BPA combined with high-fat intake during pregnancy increases the risk for breast cancer in the immediate offspring [46]. Many of these types of studies investigating EDC effects combined with a HFD are focused on the reproductive field, not obesity or diabetes. The combined effects of phthalates and other EDCs with high-fat diets are beginning to be investigated by researchers in various fields including animal behavior, cancer, and obesity. However, much of this EDC research is also performed at higher doses on animals, at concentrations which are not physiologically relevant to levels of human exposure. For instance, human adult exposure to BBP is estimated at 2 μg/kg/day from foods, whereas rat concentrations for BBP’s developmental toxicity lowest observable adverse effect level (LOAEL) is 185 mg/kg/day and reproductive LOAEL is higher than 500 mg/kg/day [47]. Furthermore, lower doses of EDCs often are capable of inducing nonmonotonic dose responses (i.e. with nonlinear dose-response relationships), especially with added stressors (such as a high-fat diet) to evoke a two-hit combined effect [25, 26]. Additionally, these studies are traditionally performed on male animal models but ignore the females’ confounding hormonal effects [48, 49]. While BBP is a known powerful EDC, with variable effects at both low [50, 51] and high doses [20, 52], it is currently unknown how its nonmonotonic dose response alone or with another stressor contributes to the obesity and T2D epidemic.
In our current study, we have investigated a range of physiological doses of BBP in CD or HFD in both sexes. Observing the body weight of both sexes, males gained significantly more weight than females with their respective diets (Fig. 1A–F), with a significant outlier for the HFD plus moderate BBP3 concentration (3 mg/kg body weight/day) (Fig. 1F). Therefore, the corresponding lack of BBP effects in the CD responses supports a two-hit concept, as well as a nonmonotonic BBP response as the HFD with BBP3 effect only happened with one moderate dose in the medium range. A study by Kougias et al. showed that male rat pups with perinatal exposure to a HFD with a mixture of phthalates (200 and 1000 μg/kg/day) had higher postnatal body weights into adulthood [52]. However, the concentration of BBP in the phthalate mixture was only 5%, the prepubertal male rats had lower body weights across phthalate doses, and female rats showed similar body weight effects compared to males [52]. Our current study’s male mice showed evident physical body size changes from weight gain, whereas females were less affected (Fig. 2). These results are interesting, as both sexes consumed similar amounts of diets each day regardless of the diet composition (Fig. 3). These different female responses to the HFD challenges may be due to alternative hormonal responses compared to the male groups. In a study by Chukijrungroat et al., female Sprague-Dawley rats displayed lower levels of hormone Fibroblast Growth Factor 21 (FGF21) on high-fat high-fructose diets compared to the males’ responses, with a subsequent reduction in HFD-HF effects [53]. Associated maternal factors could also include the anti-obese effects of estrogen in females [48], through estrogen receptor α [49]. These factors bear merit for future investigations. Another argument can be made that the female C57BL/6 J mouse model may respond poorly to the obesogenic diet or demonstrate unexplained changes and may not be an appropriate comparison model for male C57BL/6 J mice, which is known to be a well-studied obesogenic model.
Unlike the female mice, male mice livers on a HFD in the presence of BBP displayed evidence of fatty liver, with enlargement and discoloration in the HFD with BBP3 group, while the liver appearance was unchanged for the high dosage of BBP4 combined with HFD group (Fig. 4B and C). Male mice WAT also showed a similar trend, with increased size of adipose tissue recovered for HFD with BBP3 and a lack of effects on the HFD plus BBP4 high dosage exposure (Fig. 5B and C). Male SubQWAT significantly repeated this pattern for the HFD plus BBP3 and HFD with BBP4 concentrations (Fig. 6B and C), as well as similar results for BAT (Fig. 7B and C). The BAT HFD in the presence of BBP3 concentration sample had the greatest visual phenotypic effect with extreme amounts of whitened fat surrounding the enlarged brown adipose tissue (Fig. 7C), with no significant alteration in high BBP4 dose compared to moderate BBP3, or other doses with HFD or only HFD. The whitening of BAT has been reported in several diet induced obese/diabetic animals and humans [54, 55]. Even though we should expect the BAT weight to decrease with stressors such as HFD and BBP, we observed an increased weight in BAT in those situations; however, we need to emphasize that this weight gain is due to more white fat cells around the brown fat (whitening). Yang et al. showed that the higher dosage levels (up to 5 mg/kg body weight/day) of BPA exposure to C57BL/6 J mice in the mid- to postadolescent period had a more pronounced effect on adiposity and body weight that is not detected in male mice exposed perinatally [56]. Associated results by these reports proposed a male-specific nonmonotonic dose response by BPA depending on the exposure window, where low doses were more effective in editing metabolic homeostasis during perinatal exposure [57], as opposed to higher doses leading to metabolic disorder for peripubertal exposure [56]. Our results correlate with the Yang et al. group’s male peripubertal BPA dosage response [56], as such we can state our nonmonotonic BBP response has similar obesogenic effects with 8 week old mice (Figs. 1–5). Our results also show a drop off in adiposity at the extreme 50 mg/kg body weight/day BBP exposure range in male mice, as further evidence of a specific dose response. A study by Zhang-Hong Ke et al. showed an obesogenic effect in 10 month-long BPA-exposed male mice, as opposed to only 8 week-long exposure, with significantly increased body weight, liver weight, and WAT weight in the long-term group [58]. Interestingly, even though female mice showed expected significant changes in all fat tissues when compared to chow and HFD (Figs. 5A, 6A, and 7A), BBP exposure did not affect the adipose tissue as with the male sex. The wide discrepancy between female and male effects, especially at the moderate BBP exposure, assumes that additional factors may be at work, such as the way estrogen-like chemicals such as BBP may be processed in females [59]. BBP does bind to the estrogen receptor of rats [60], with in vitro experiments showing BBP with a weak potential for estrogen-mediated gene expression, due to estrogen mimicry [61]. A mini review by Lui et al. discussed how male offspring tend to be more sensitive than females to BPA exposure, which may be partly due to the protective anti-diabetic effects of estrogens present in females [62]. Interestingly, the male BBP concentration effects are not linear, with many of the diabesity effects unchanged at the highest BBP4 50 mg/kg body weight/day concentration. These nonmonotonic results may be affiliated with the binding kinetics of BBP estrogen mimics to their receptors, where for endogenous hormones, there is generally a nonlinear relationship between the number of bound receptors and the strongest observable biological effect [26, 63]. Therefore, moderate changes in the low dose range can induce larger changes in receptor occupancy with greater biological effects, likewise, near-maximum biological responses can be observed without high rates of receptor occupancy (earlier termed the “spare receptor hypothesis”), as in the response mechanism saturates before the majority of receptors are bound [63–65]. The increased body weight effects from the BBP plus HFD study seem to be due to these responses, with the estrogen receptor sites in males only producing effects at a moderate dosage yet triggering no changes at the highest concentration.
Female mice exposed to lower doses did exhibit significant differences in skeletal muscle size compared to other female HFD groups or CD (Fig. 8A), without a commensurate response in male mice groups (Fig. 8B). It is possible that female juvenile hyperactivity may have been induced with chronic low BBP exposure, leading to altered skeletal muscle weight over time. However, it is difficult to draw any confirmatory conclusion when we have to be cautious about the EDC mice model suitability. Several studies show repetitive flipping, constant running behavior, severely hyperactive natures, horizontal and vertical activity, and altered patterns in social play in females when exposed to phthalate exposure, which also confounded the body weight [52, 66–68]. It is possible that the same effects were present in our BBP study, though these behavioral changes were not specifically looked for and none were reported for the duration of the experiment. Interestingly, the renal organ seems to have no effect either in male or female groups except that BBP3 did show significantly increased weight in the presence of a CD (Fig. 8C). Another observation in our study supports long lasting evidence of phthalates inducing adverse effects on reproductive organs, i.e. male mice showed a nonlinear BBP dose effect in the presence of HFD. Two doses, the lowest and moderate exposure had significantly larger testes size (Fig. 8F), possibly indicative of reproductive disorders induced by the BBP exposure [22].
Fasting blood glucose has routinely been used as a marker in the development of diabetes and for evaluation of glycemic control [69, 70]. Overnight fasting has also been utilized for blood glucose measurements in mice [71]. Female mice in the CD plus BBP3 group and male mice in the HFD with the BBP3 group showed significantly increased fasting blood glucose readings (Fig. 9A and B). However, the male HFD plus BBP3 results were over a 150 mg/dl glucose level, which are consistent with similar diagnoses/symptoms of initial diabesity, metabolic syndrome, and type 2 diabetes (>125 mg/dl or >7 mM during fasting) [69, 71]. A recent report indicated that the antifungal tolylfluanid in combination with a high-fat or high-fat high-sucrose diet has been implicated in increased adipocyte counts and higher blood glucose AUCs, features associated with obesity and diabetes [72]. On the other hand, female GTT revealed a bell-shaped curve with a significance at a lower BBP2 dose in the presence of a CD at an earlier stage (Fig. 10iA and B). It then lost its significance in the middle (Fig. 10iE and F) but had a significant increase with BBP3 at a later time point (Fig. 10iI and J) but no changes with HFD. Interestingly, for males, the GTT responses show an initial response for multiple BBP plus CD groups (Fig. 10iiA and B) but eventually show a leveling out by week 10 with an increasing trend for the higher BBP concentrations by week 16 (Fig. 10iiA, B, E, F, I and J). However, BBP3 did show a significant increase as expected, as the moderate dose of BBP3 plus HFD definitely shows an increasing trend through weeks 6 and 10, leading up to its significance at week 16 (Fig. 10iiC, D, G, H, K and L). This reconfirms our hypothesis. Likewise, this moderate dose-induced ITT showed significance for the female mice CD group at 15 weeks (Fig. 11iI and J) and as expected the male HFD group at 15 weeks (Fig. 11iiK and L). This ITT metabolic dysregulation would make sense given the gross obesity changes in the BBP3 plus HFD male mouse group. Even though the female mice show some alteration in fasting glucose, GTT, and ITT mostly with BBP2/3 doses in CD but not with another stressor HFD, the pattern does not show any specific significance alteration. A previous study with DEHP and DBP shows no changes in GTT and ITT for females but does display a similar bell-shaped curve at one time point for male rats [73]. Therefore, we could conclude that the female C57BL6 model may not be a good responsive model for EDC and diabetes-obesity research whereas male mice are.
The current rise in the prevalence of type 2 diabetes and metabolic syndrome is believed to be a result of disordered lipid metabolism in the liver [74]. Indeed, hepatic lipid content is one of the strongest predictors of insulin resistance [75]. At the molecular level, increased lipid accumulation observed in the insulin resistance state is due to dysregulation of the transcription factor of lipogenesis, SREBP1 [76, 77]. Therefore, increased SREBP1 in the liver does show a strong relationship with BBP induced accumulation of lipids and results in insulin resistance. SREBP1 is relatively selective in activating genes involved in the fatty acid synthesis, while SREBP2 preferentially activates genes involved in cholesterol biosynthesis [78–81]. Mice that overexpressed SREBP1c had an increased rate of fatty acid synthesis and increased mRNA levels for the lipogenic genes ATP citrate lyase, ACC, FAS, and HMGCR [82]. In the current study, moderate dose of BBP exposure lead to hepatic upregulation of nuclear SREBP1 protein level as well as gene expression of lipogenic enzymes, such as ACC, FAS, and HMGCR (Fig. 12). Studies with DEHP exposure have been shown to enhance similar lipid metabolism gene expression [83, 84]. Interestingly, BBP exposure caused only an accumulation of nuclear SREBP1 proteins but showed no effect on SREBP1c transcriptional level (Fig. 12), suggesting that moderate dose of BBP could act as a SREBP1 activator. Therefore, it is likely that BBP exerts a lipid accumulation effect through the activation of SREBP1 that may lead to metabolic complications. Indeed, as a transcription factor of lipogenesis, SREBP1 could especially act as a marker of EDC induced dysregulation.
These scenarios are similar to others in related obesity studies, as previous EDC research has been performed with related plasticizers, such as chronic BPA exposure, showing increased risk factors of metabolic abnormalities in epidemiological and animal studies [31, 85, 86]. Wei et al. [57] reported perinatal BPA exposure at 50 μg/kg body weight/day resulted in reduced glucose tolerance and insulin sensitivity in adult rat offspring, with male rats progressing to insulin resistance as adults. Three maternal doses of BPA were used for Wei et al’s study; however, only the 50 μg/kg body weight/day dose (lowest dose given) had metabolic reprogramming effects occur. Another report by Somm et al. involving perinatal exposure to approximately 70 μg/kg body weight/day BPA dosage showed changes in early adipogenesis in rat offspring with elevated body weight but did not impair glucose tolerance [87]. It seems that the timing and length of BBP exposure also play a critical role in determining the overall diabesity effects on males.
In conclusion, chronic exposure to moderate levels of plasticizers can be a contributor to the worldwide epidemic of diabetes and metabolic disorders. EDCs, including BBP, induce nonmonotonic metabolic responses which are obesity-causing, especially in the presence of a western diet. Degraded/damaged plastics are a general environmental source of leached estrogen-like chemicals with estrogenic activity (EA), the most common form of endocrine disruptor activity [59]. Alternative phthalates have been proposed to replace many common plasticizers, including BBP, due to child product bans on these products in the US and European Union [88, 89]. Several other plasticizers, such as bis(2-ethylhexyl) terephthalate (DEHTP) and bis(2-ethylhexyl) adipate (DEHA), have been developed as replacements, and are expected to be ubiquitously detected in their environment much like their predecessors [90]. A study by Yang et al. [59] showed that most plastic products tested released chemicals having EA, especially if stressed; many compounds marketed as BPA-free still released moieties that caused EA; and many plasticizer additives showed EA activity as well. However, with industry switching to other forms of plasticizers, such as bisphenol S or bisphenol F, to comply with new BPA-free guidelines, researchers are still finding similar EA effects with plasticizer chemicals promoted to replace BPA [91]. It is not a stretch of the imagination to see multiple types of EDCs leached from multiple plasticizer sources having cumulative nonmonotonic effects on current human health. As phthalate esters are ubiquitous industrial chemicals posing a significant environmental burden [92], their concentrations in humans need to be evaluated. Adult exposure to BBP is estimated at 2 μg/kg/day from foods (the major source) and up to three-fold higher exposures for infants and children [47]. BBP exposure in industrial workers has been estimated at 143 and 286 μg/kg body weight per day. As it is definitely a possibility that ineffective, higher EDC doses of LOAELs are tested on animal models for levels of “human safety”, lower concentrations of active, nonmonotonic responses from these EDCs are being missed. More EDC testing needs to be performed at lower, human-labile concentrations to test for downstream effects, especially in the context of two-hit stressors, such as an obesogenic western diet. In summary, our results show the divergent effects of chronic BBP exposure within a HFD environment, with critical obesity-related physical changes present in males exposed to moderate BBP levels, compared to more modest physical changes in females exposed to lower BBP levels. Future work will include investigation of epigenetic regulation and early noninvasive biomarkers in this scenario. In the future, the rate of environmental BBP (and other EDC) exposure, coupled with a reduction of fat present in the diet, should be a consideration for reducing future diabesity-related outcomes in young at-risk juveniles to adults.
Supplementary Material
Disclosure: the authors have nothing to disclose.
Acknowledgments
We acknowledge Ms. Ana Karen Gutiérrez García, Komal Bhakta, Chunyan Li, Purvi Panchal, and Dr. Tulasigeri Totiger for their efforts with animal maintenance during the mouse study.
Funding
The work was supported by faculty development funding from Texas A&M Health Science Center School of Pharmacy.
Conflict of interest
The author declared no conflict of interest.
References
- 1. Ogden CL, Carroll MD, Kit BK et al. Prevalence of childhood and adult obesity in the United States, 2011-2012. JAMA 2014;311:806–14. [DOI] [PMC free article] [PubMed] [Google Scholar]
- 2. Papalou O, Kandaraki EA, Papadakis G et al. Endocrine disrupting chemicals: an occult mediator of metabolic disease. Front Endocrinol (Lausanne) 2019;10:112. [DOI] [PMC free article] [PubMed] [Google Scholar]
- 3. Cho NH, Shaw JE, Karuranga S et al. IDF diabetes atlas: global estimates of diabetes prevalence for 2017 and projections for 2045. Diabetes Res Clin Pract 2018;138:271–81. [DOI] [PubMed] [Google Scholar]
- 4. WHO (2016) WHO Global Status Report on Noncommunicable Diseases (2016). Available online at: http://apps.who.int/iris/bitstream/handle/10665/148114/9789241564854_eng.pdf;jsessionid=3E13236F60C0D3C3275B85E0E927F96B?sequence=1.
- 5. ADA Economic costs of diabetes in the U.S. in 2017. Diabetes Care 2018;41:917–28. [DOI] [PMC free article] [PubMed] [Google Scholar]
- 6. Lehnert T, Sonntag D, Konnopka A et al. Economic costs of overweight and obesity. Best Pract Res Clin Endocrinol Metab 2013;27:105–15. [DOI] [PubMed] [Google Scholar]
- 7. Huang ES, Laiteerapong N, Liu JY et al. Rates of complications and mortality in older patients with diabetes mellitus: the diabetes and aging study. JAMA Intern Med 2014;174:251–8. [DOI] [PMC free article] [PubMed] [Google Scholar]
- 8. Schwartz MW, Seeley RJ, Zeltser LM et al. Obesity pathogenesis: an Endocrine Society scientific statement. Endocr Rev 2017;38:267–96. [DOI] [PMC free article] [PubMed] [Google Scholar]
- 9. Gore AC, Chappell VA, Fenton SE et al. EDC-2: the Endocrine Society's second scientific statement on endocrine-disrupting chemicals. Endocr Rev 2015;36:E1–E150. [DOI] [PMC free article] [PubMed] [Google Scholar]
- 10. Neel BA, Sargis RM. The paradox of progress: environmental disruption of metabolism and the diabetes epidemic. Diabetes 2011;60:1838–48. [DOI] [PMC free article] [PubMed] [Google Scholar]
- 11. Baillie-Hamilton PF. Chemical toxins: a hypothesis to explain the global obesity epidemic. J Altern Complement Med 2002;8:185–92. [DOI] [PubMed] [Google Scholar]
- 12. Fleisch AF, Wright RO, Baccarelli AA. Environmental epigenetics: a role in endocrine disease? J Mol Endocrinol 2012;49:R61–7. [DOI] [PMC free article] [PubMed] [Google Scholar]
- 13. Goodman M, Lakind JS, Mattison DR. Do phthalates act as obesogens in humans? A systematic review of the epidemiological literature. Crit Rev Toxicol 2014;44:151–75. [DOI] [PubMed] [Google Scholar]
- 14. Kuo CC, Moon K, Thayer KA et al. Environmental chemicals and type 2 diabetes: an updated systematic review of the epidemiologic evidence. Curr Diab Rep 2013;13:831–49. [DOI] [PMC free article] [PubMed] [Google Scholar]
- 15. Martinelli MI, Mocchiutti NO, Bernal CA. Dietary di(2-ethylhexyl)phthalate-impaired glucose metabolism in experimental animals. Hum Exp Toxicol 2006;25:531–8. [DOI] [PubMed] [Google Scholar]
- 16. Heudorf U, Mersch-Sundermann V, Angerer J. Phthalates: toxicology and exposure. Int J Hyg Environ Health 2007;210:623–34. [DOI] [PubMed] [Google Scholar]
- 17. Halden RU. Plastics and health risks. Annu Rev Public Health 2010;31:179–94. [DOI] [PubMed] [Google Scholar]
- 18. Wormuth M, Scheringer M, Vollenweider M et al. What are the sources of exposure to eight frequently used phthalic acid esters in Europeans? Risk Anal 2006;26:803–24. [DOI] [PubMed] [Google Scholar]
- 19. Zhang J, Ali HI, Bedi YS et al. The plasticizer BBP selectively inhibits epigenetic regulator sirtuins. Toxicology 2015;338:130–41. [DOI] [PubMed] [Google Scholar]
- 20. Schmitt EE, Vellers HL, Porter WW et al. Environmental endocrine disruptor affects voluntary physical activity in mice. Med Sci Sports Exerc 2016;48:1251–8. [DOI] [PMC free article] [PubMed] [Google Scholar]
- 21. Vellers HL, Letsinger AC, Walker NR et al. High fat high sugar diet reduces voluntary wheel running in mice independent of sex hormone involvement. Front Physiol 2017;8:628. [DOI] [PMC free article] [PubMed] [Google Scholar]
- 22. Martino-Andrade AJ, Chahoud I. Reproductive toxicity of phthalate esters. Mol Nutr Food Res 2010;54:148–57. [DOI] [PubMed] [Google Scholar]
- 23. Radke EG, Galizia A, Thayer KA et al. Phthalate exposure and metabolic effects: a systematic review of the human epidemiological evidence. Environ Int 2019;132:104768. [DOI] [PMC free article] [PubMed] [Google Scholar]
- 24. Heindel JJ. History of the Obesogen field: looking back to look forward. Front Endocrinol (Lausanne) 2019;10:14. [DOI] [PMC free article] [PubMed] [Google Scholar]
- 25. Sheehan DM, vom Saal FS. Lose dose effects of hormones: a challenge for risk assessment. Risk Policy Rep 1997;4:31–9. [Google Scholar]
- 26. Welshons WV, Thayer KA, Judy BM et al. Large effects from small exposures. I. Mechanisms for endocrine-disrupting chemicals with estrogenic activity. Environ Health Perspect 2003;111:994–1006. [DOI] [PMC free article] [PubMed] [Google Scholar]
- 27. vom Saal FS, Timms BG, Montano MM et al. Prostate enlargement in mice due to fetal exposure to low doses of estradiol or diethylstilbestrol and opposite effects at high doses. Proc Natl Acad Sci U S A 1997;94:2056–61. [DOI] [PMC free article] [PubMed] [Google Scholar]
- 28. Christen V, Crettaz P, Oberli-Schrammli A et al. Antiandrogenic activity of phthalate mixtures: validity of concentration addition. Toxicol Appl Pharmacol 2012;259:169–76. [DOI] [PubMed] [Google Scholar]
- 29. Ukropec J, Radikova Z, Huckova M et al. High prevalence of prediabetes and diabetes in a population exposed to high levels of an organochlorine cocktail. Diabetologia 2010;53:899–906. [DOI] [PubMed] [Google Scholar]
- 30. Wang SL, Tsai PC, Yang CY et al. Increased risk of diabetes and polychlorinated biphenyls and dioxins: a 24-year follow-up study of the Yucheng cohort. Diabetes Care 2008;31:1574–9. [DOI] [PMC free article] [PubMed] [Google Scholar]
- 31. Lang IA, Galloway TS, Scarlett A et al. Association of urinary bisphenol a concentration with medical disorders and laboratory abnormalities in adults. JAMA 2008;300:1303–10. [DOI] [PubMed] [Google Scholar]
- 32. Codru N, Schymura MJ, Negoita S et al. Diabetes in relation to serum levels of polychlorinated biphenyls and chlorinated pesticides in adult native Americans. Environ Health Perspect 2007;115:1442–7. [DOI] [PMC free article] [PubMed] [Google Scholar]
- 33. Uemura H, Arisawa K, Hiyoshi M et al. Associations of environmental exposure to dioxins with prevalent diabetes among general inhabitants in Japan. Environ Res 2008;108:63–8. [DOI] [PubMed] [Google Scholar]
- 34. Zhang J, Choudhury M. The plasticizer BBP selectively inhibits epigenetic regulator sirtuin during differentiation of C3H10T1/2 stem cell line. Toxicol In Vitro 2017;39:75–83. [DOI] [PubMed] [Google Scholar]
- 35. Sonkar R, Powell CA, Choudhury M. Benzyl butyl phthalate induces epigenetic stress to enhance adipogenesis in mesenchymal stem cells. Mol Cell Endocrinol 2016;431:109–22. [DOI] [PubMed] [Google Scholar]
- 36. Yin L, Yu KS, Lu K et al. Benzyl butyl phthalate promotes adipogenesis in 3T3-L1 preadipocytes: a high content Cellomics and metabolomic analysis. Toxicol In Vitro 2016;32:297–309. [DOI] [PubMed] [Google Scholar]
- 37. Meruvu S, Zhang J, Bedi YS et al. Mono-(2-ethylhexyl) phthalate induces apoptosis through miR-16 in human first trimester placental cell line HTR-8/SVneo. Toxicol In Vitro 2016;31:35–42. [DOI] [PubMed] [Google Scholar]
- 38. Meruvu S, Zhang J, Choudhury M. Mono-(2-ethylhexyl) phthalate increases oxidative stress responsive miRNAs in first trimester placental cell line HTR8/SVneo. Chem Res Toxicol 2016;29:430–5. [DOI] [PubMed] [Google Scholar]
- 39. Park MH, Gutierrez-Garcia AK, Choudhury M. Mono-(2-ethylhexyl) phthalate aggravates inflammatory response via Sirtuin regulation and Inflammasome activation in RAW 264.7 cells. Chem Res Toxicol 2019;32:935–42. [DOI] [PubMed] [Google Scholar]
- 40. Heindel JJ, Blumberg B, Cave M et al. Metabolism disrupting chemicals and metabolic disorders. Reprod Toxicol 2017;68:3–33. [DOI] [PMC free article] [PubMed] [Google Scholar]
- 41. Heindel JJ, Balbus J, Birnbaum L et al. Developmental origins of health and disease: integrating environmental influences. Endocrinology 2015;156:3416–21. [DOI] [PMC free article] [PubMed] [Google Scholar]
- 42. Bodin J, Stene LC, Nygaard UC. Can exposure to environmental chemicals increase the risk of diabetes type 1 development? Biomed Res Int 2015;2015:208947. [DOI] [PMC free article] [PubMed] [Google Scholar]
- 43. Godfrey KM, Costello PM, Lillycrop KA. The developmental environment, epigenetic biomarkers and long-term health. J Dev Orig Health Dis 2015;6:399–406. [DOI] [PMC free article] [PubMed] [Google Scholar]
- 44. Lyche JL, Gutleb AC, Bergman A et al. Reproductive and developmental toxicity of phthalates. J Toxicol Environ Health B Crit Rev 2009;12:225–49. [DOI] [PubMed] [Google Scholar]
- 45. Andersen RE. The spread of the childhood obesity epidemic. CMAJ 2000;163:1461–2. [PMC free article] [PubMed] [Google Scholar]
- 46. Leung YK, Govindarajah V, Cheong A et al. Gestational high-fat diet and bisphenol a exposure heightens mammary cancer risk. Endocr Relat Cancer 2017;24:365–78. [DOI] [PMC free article] [PubMed] [Google Scholar]
- 47. Kavlock R, Boekelheide K, Chapin R et al. NTP Center for the Evaluation of risks to human reproduction: phthalates expert panel report on the reproductive and developmental toxicity of butyl benzyl phthalate. Reprod Toxicol 2002;16:453–87. [DOI] [PubMed] [Google Scholar]
- 48. Heine PA, Taylor JA, Iwamoto GA et al. Increased adipose tissue in male and female estrogen receptor-alpha knockout mice. Proc Natl Acad Sci U S A 2000;97:12729–34. [DOI] [PMC free article] [PubMed] [Google Scholar]
- 49. Gao Q, Mezei G, Nie Y et al. Anorectic estrogen mimics leptin's effect on the rewiring of melanocortin cells and Stat3 signaling in obese animals. Nat Med 2007;13:89–94. [DOI] [PubMed] [Google Scholar]
- 50. Tsai CF, Hsieh TH, Lee JN et al. Benzyl butyl phthalate induces migration, invasion, and angiogenesis of Huh7 hepatocellular carcinoma cells through nongenomic AhR/G-protein signaling. BMC Cancer 2014;14:556. [DOI] [PMC free article] [PubMed] [Google Scholar]
- 51. Chen HS, Hsu CY, Chang YC et al. Benzyl butyl phthalate decreases myogenic differentiation of endometrial mesenchymal stem/stromal cells through miR-137-mediated regulation of PITX2. Sci Rep 2017;7:186. [DOI] [PMC free article] [PubMed] [Google Scholar]
- 52. Kougias DG, Cortes LR, Moody L et al. Effects of perinatal exposure to phthalates and a high-fat diet on maternal behavior and pup development and social play. Endocrinology 2018;159:1088–105. [DOI] [PMC free article] [PubMed] [Google Scholar]
- 53. Chukijrungroat N, Khamphaya T, Weerachayaphorn J et al. Hepatic FGF21 mediates sex differences in high-fat high-fructose diet-induced fatty liver. Am J Physiol Endocrinol Metab 2017;313:E203–12. [DOI] [PubMed] [Google Scholar]
- 54. Kotzbeck P, Giordano A, Mondini E et al. Brown adipose tissue whitening leads to brown adipocyte death and adipose tissue inflammation. J Lipid Res 2018;59:784–94. [DOI] [PMC free article] [PubMed] [Google Scholar]
- 55. Shimizu I, Aprahamian T, Kikuchi R et al. Vascular rarefaction mediates whitening of brown fat in obesity. J Clin Invest 2014;124:2099–112. [DOI] [PMC free article] [PubMed] [Google Scholar]
- 56. Yang M, Chen M, Wang J et al. Bisphenol a promotes adiposity and inflammation in a nonmonotonic dose-response way in 5-week-old male and female C57BL/6J mice fed a low-calorie diet. Endocrinology 2016;157:2333–45. [DOI] [PubMed] [Google Scholar]
- 57. Wei J, Lin Y, Li Y et al. Perinatal exposure to bisphenol a at reference dose predisposes offspring to metabolic syndrome in adult rats on a high-fat diet. Endocrinology 2011;152:3049–61. [DOI] [PubMed] [Google Scholar]
- 58. Ke ZH, Pan JX, Jin LY et al. Bisphenol a exposure May induce hepatic lipid accumulation via reprogramming the DNA methylation patterns of genes involved in lipid metabolism. Sci Rep 2016;6:31331. [DOI] [PMC free article] [PubMed] [Google Scholar]
- 59. Yang CZ, Yaniger SI, Jordan VC et al. Most plastic products release estrogenic chemicals: a potential health problem that can be solved. Environ Health Perspect 2011;119:989–96. [DOI] [PMC free article] [PubMed] [Google Scholar]
- 60. Zacharewski TR, Meek MD, Clemons JH et al. Examination of the in vitro and in vivo estrogenic activities of eight commercial phthalate esters. Toxicol Sci 1998;46:282–93. [DOI] [PubMed] [Google Scholar]
- 61. Picard K, Lhuguenot JC, Lavier-Canivenc MC et al. Estrogenic activity and metabolism of n-butyl benzyl phthalate in vitro: identification of the active molecule(s). Toxicol Appl Pharmacol 2001;172:108–18. [DOI] [PubMed] [Google Scholar]
- 62. Liu S, Mauvais-Jarvis F. Minireview: estrogenic protection of beta-cell failure in metabolic diseases. Endocrinology 2010;151:859–64. [DOI] [PMC free article] [PubMed] [Google Scholar]
- 63. Vandenberg LN, Colborn T, Hayes TB et al. Hormones and endocrine-disrupting chemicals: low-dose effects and nonmonotonic dose responses. Endocr Rev 2012;33:378–455. [DOI] [PMC free article] [PubMed] [Google Scholar]
- 64. May M, Moran JF, Kimelberg H et al. Studies on the noradrenaline alpha-receptor. II. Analysis of the "spare-receptor" hypothesis and estimation of the concentration of alpha-receptors in rabbit aorta. Mol Pharmacol 1967;3:28–36. [PubMed] [Google Scholar]
- 65. Zhu BT. Rational design of receptor partial agonists and possible mechanisms of receptor partial activation: a theory. J Theor Biol 1996;181:273–91. [DOI] [PubMed] [Google Scholar]
- 66. Rubin BS, Paranjpe M, DaFonte T et al. Perinatal BPA exposure alters body weight and composition in a dose specific and sex specific manner: the addition of peripubertal exposure exacerbates adverse effects in female mice. Reprod Toxicol 2017;68:130–44. [DOI] [PMC free article] [PubMed] [Google Scholar]
- 67. Anderson OS, Peterson KE, Sanchez BN et al. Perinatal bisphenol a exposure promotes hyperactivity, lean body composition, and hormonal responses across the murine life course. FASEB J 2013;27:1784–92. [DOI] [PMC free article] [PubMed] [Google Scholar]
- 68. van Esterik JC, Dolle ME, Lamoree MH et al. Programming of metabolic effects in C57BL/6JxFVB mice by exposure to bisphenol a during gestation and lactation. Toxicology 2014;321:40–52. [DOI] [PubMed] [Google Scholar]
- 69. ADA Diagnosis and classification of diabetes mellitus. Diabetes Care 2005;28:S37–42. [DOI] [PubMed] [Google Scholar]
- 70. Holman RR, Turner RC. The basal plasma glucose: a simple relevant index of maturity-onset diabetes. Clin Endocrinol (Oxf) 1981;14:279–86. [DOI] [PubMed] [Google Scholar]
- 71. Wang Z, Moro E, Kovacs K et al. Pituitary tumor transforming gene-null male mice exhibit impaired pancreatic beta cell proliferation and diabetes. Proc Natl Acad Sci U S A 2003;100:3428–32. [DOI] [PMC free article] [PubMed] [Google Scholar]
- 72. Regnier SM, Kirkley AG, Ruiz D et al. Diet-dependence of metabolic perturbations mediated by the endocrine disruptor tolylfluanid. Endocr Connect 2018;7:159–68. [DOI] [PMC free article] [PubMed] [Google Scholar]
- 73. Venturelli AC, Meyer KB, Fischer SV et al. Effects of in utero and lactational exposure to phthalates on reproductive development and glycemic homeostasis in rats. Toxicology 2019;421:30–40. [DOI] [PubMed] [Google Scholar]
- 74. Savage DB, Petersen KF, Shulman GI. Disordered lipid metabolism and the pathogenesis of insulin resistance. Physiol Rev 2007;87:507–20. [DOI] [PMC free article] [PubMed] [Google Scholar]
- 75. Kumashiro N, Erion DM, Zhang D et al. Cellular mechanism of insulin resistance in nonalcoholic fatty liver disease. Proc Natl Acad Sci U S A 2011;108:16381–5. [DOI] [PMC free article] [PubMed] [Google Scholar]
- 76. Jideonwo V, Hou Y, Ahn M et al. Impact of silencing hepatic SREBP-1 on insulin signaling. PLoS One 2018;13:e0196704. [DOI] [PMC free article] [PubMed] [Google Scholar]
- 77. Park MH, Kim DH, Lee EK et al. Age-related inflammation and insulin resistance: a review of their intricate interdependency. Arch Pharm Res 2014;37:1507–14. [DOI] [PMC free article] [PubMed] [Google Scholar]
- 78. Shimomura I, Bashmakov Y, Shimano H et al. Cholesterol feeding reduces nuclear forms of sterol regulatory element binding proteins in hamster liver. Proc Natl Acad Sci U S A 1997;94:12354–9. [DOI] [PMC free article] [PubMed] [Google Scholar]
- 79. Shimomura I, Shimano H, Horton JD et al. Differential expression of exons 1a and 1c in mRNAs for sterol regulatory element binding protein-1 in human and mouse organs and cultured cells. J Clin Invest 1997;99:838–45. [DOI] [PMC free article] [PubMed] [Google Scholar]
- 80. Shimano H, Shimomura I, Hammer RE et al. Elevated levels of SREBP-2 and cholesterol synthesis in livers of mice homozygous for a targeted disruption of the SREBP-1 gene. J Clin Invest 1997;100:2115–24. [DOI] [PMC free article] [PubMed] [Google Scholar]
- 81. Shimano H, Horton JD, Shimomura I et al. Isoform 1c of sterol regulatory element binding protein is less active than isoform 1a in livers of transgenic mice and in cultured cells. J Clin Invest 1997;99:846–54. [DOI] [PMC free article] [PubMed] [Google Scholar]
- 82. Madison BB. Srebp2: a master regulator of sterol and fatty acid synthesis. J Lipid Res 2016;57:333–5. [DOI] [PMC free article] [PubMed] [Google Scholar]
- 83. Bastos Sales L, van Esterik JCJ, Hodemaekers HM et al. Analysis of lipid metabolism, immune function, and Neurobehavior in adult C57BL/6JxFVB mice after developmental exposure to di (2-ethylhexyl) phthalate. Front Endocrinol (Lausanne) 2018;9:684. [DOI] [PMC free article] [PubMed] [Google Scholar]
- 84. Zhang YZ, Zhang ZM, Zhou LT et al. Di (2-ethylhexyl) phthalate disorders lipid metabolism via TYK2/STAT1 and autophagy in rats. Biomed Environ Sci 2019;32:406–18. [DOI] [PubMed] [Google Scholar]
- 85. Alonso-Magdalena P, Morimoto S, Ripoll C et al. The estrogenic effect of bisphenol a disrupts pancreatic beta-cell function in vivo and induces insulin resistance. Environ Health Perspect 2006;114:106–12. [DOI] [PMC free article] [PubMed] [Google Scholar]
- 86. Alonso-Magdalena P, Vieira E, Soriano S et al. Bisphenol A exposure during pregnancy disrupts glucose homeostasis in mothers and adult male offspring. Environ Health Perspect 2010;118:1243–50. [DOI] [PMC free article] [PubMed] [Google Scholar]
- 87. Somm E, Schwitzgebel VM, Toulotte A et al. Perinatal exposure to bisphenol a alters early adipogenesis in the rat. Environ Health Perspect 2009;117:1549–55. [DOI] [PMC free article] [PubMed] [Google Scholar]
- 88. Commission, U. S. C. P. S CPSC prohibits certain phthalates in children's toys and child care products. 2017, WWW Document.
- 89. European Chemicals Agency. Restriction proposal on four phthalates and several authorisation applications agreed by RAC and SEAC.. 2017. https://echa.europa.eu/-/restriction-proposal-on-four-phthalates-and-several-authorisation-applications-agreed-by-rac-and-seac.
- 90. Hammel SC, Levasseur JL, Hoffman K et al. Children's exposure to phthalates and non-phthalate plasticizers in the home: the TESIE study. Environ Int 2019;132:105061. [DOI] [PMC free article] [PubMed] [Google Scholar]
- 91. Eladak S, Grisin T, Moison D et al. A new chapter in the bisphenol a story: bisphenol S and bisphenol F are not safe alternatives to this compound. Fertil Steril 2015;103:11–21. [DOI] [PubMed] [Google Scholar]
- 92. Blount BC, Silva MJ, Caudill SP et al. Levels of seven urinary phthalate metabolites in a human reference population. Environ Health Perspect 2000;108:979–82. [DOI] [PMC free article] [PubMed] [Google Scholar]
Associated Data
This section collects any data citations, data availability statements, or supplementary materials included in this article.


