

Maleimide liposomes capable of GSH depletion acted as the adjuvant for augmenting the photothermal immunotherapy of breast cancer.
Abstract
The high redox level of tumor microenvironment inhibits the oxidation treatment and the immune response. Here, we innovatively develop maleimide liposome (ML) adjuvants to promote immunogenic cell death (ICD) induction and dendritic cells (DCs) maturation by glutathione (GSH) depletion for augmenting the photothermal immunotherapy of breast cancer. The ML effectively depletes the intracellular GSH and up-regulates reactive oxygen species (ROS) in both tumor cells and DCs. In tumor cells, the ROS boosted the ABTS·+ production to activate photothermal-induced ICD. In DCs, it relieved the immunosuppression, promoting DC maturation (57%) and antigen presenting. As a result of the ML assistant, the therapeutic systems improved the infiltration of CD8+ T cells to 53% in tumor tissues, eliciting strong abscopal effect and antimetastasis effect. The MLs were believed to be a superior candidate of adjuvants for enhancing immune response and cancer therapeutic efficacy.
INTRODUCTION
Tumor microenvironment (TME), as the “soil” of tumor cells, contains a variety of components, including transformed cells, blood vessels, fibroblasts, and immune cells (1, 2). The immunosuppressive TME promotes cancer cell growth and forms a heavy barrier to hinder cancer diagnosis and therapy (3), including inhibiting immunogenic cell death (ICD) induction of tumor cells, inhibiting dendritic cells (DCs) maturation, and cytotoxic T cell response (4). Fortunately, with decades of efforts on exploration of the TME, some distinctive hallmarks are gradually clear to the researches, bringing opportunities to remodel the TME by up-regulating the benefit part and down-regulating the unprofitable factors to amplify cancer theranostic efficacy (5–7).
Reactive oxygen species (ROS), as oxidants, play important roles in cancer treatment by directly inducing cell apoptosis or acting as the substrates to many catalysis reactions (8–10). Besides, there are also a lot of studies that revealed that ROS within a proper concentration range serve as an essential messenger to facilitate immune responses (11, 12). Specifically, ROS can act as a “danger signal” to elicit the activation of DCs by up-regulating the costimulatory molecules, such as CD80 and CD86 for facilitating antigen presentation (8, 13). However, there also exist strong antioxidant systems in the intracellular environment, mainly composed of glutathione (GSH), that down-regulate the ROS level (14–16). It results in immunosuppression and attenuation of antitumor efficacy. Therefore, it is urgent to develop an effective GSH depletion agent to act as the adjuvant to improve the immune response.
As we know, thiols are the key active sites of GSH to act as antioxidant, and the blockage of the thiols would invalidate its’ antioxidation effect (17). Notably, we found that maleimide (MA) group contained chemicals that could irreversibly react with thiols by Michael addition in a mild environment, enabling it be a candidate of the GSH blockers (18). The depletion of GSH by adjuvant could not only directly enhance the immune response by promoting DC maturation but also benefit for oxidation therapy, such as ABTS&HRP system [2,2′-azino-bis (3-ethylbenzothiazoline-6-sulfonic acid) and horseradish peroxidase]. This system was traditionally applied as the indicator of hydrogen peroxide (H2O2), evaluated by the conversion of ABTS to ABTS·+ to generate a strong near-infrared (NIR) absorbance of 500 to 1000 nm (19, 20). In our knowledge, materials with NIR absorbance tended to induce the photoacoustic (PA) signal and photothermal effect after laser irradiation. It inspired us to develop the ABTS&HRP system for H2O2-dependent PA imaging–guided tumor photothermal therapy (PTT) and ICD-mediated immunotherapy, which was designed to be enhanced by GSH depletion.
In this work, we constructed two liposomal delivery systems for the in vivo application of MA and ABTS&HRP. MA and ABTS&HRP were separately loaded in the hydrophilic cavities of liposomes, defined as maleimide liposome (ML) and ABTS&HRP liposome (AHL) (Fig. 1A). The ML, as the GSH depletion adjuvant, plays two roles here to augment the theranostic efficacy (Fig. 1B): (i) It could consume the intracellular GSH of tumor cells to promote the generation of H2O2 for ABTS activation under HRP catalysis. Subsequently, the activated ABTS·+ would generate strong PA signal, guiding the PTT after laser irradiation and ICD-based immunotherapy. (ii) It could also induce ROS generation in DCs to promote DC maturation and antigen presenting by up-regulating major histocompatibility complex class I (MHCI) and CD80/86. Together, the therapeutic systems could boost the activation and infiltration of CD8+ T cells in tumor tissues, augmenting the abscopal effect on the inhibition of distant tumor and the antimetastasis effect of breast cancer. ML was believed to be superior adjuvants for augmenting the immune response and cancer therapeutic efficacy by remodeling the TME.
Fig. 1. Scheme illustration of GSH depletion adjuvant for augmenting the PA imaging–guided photothermal immunotherapy of breast cancer.
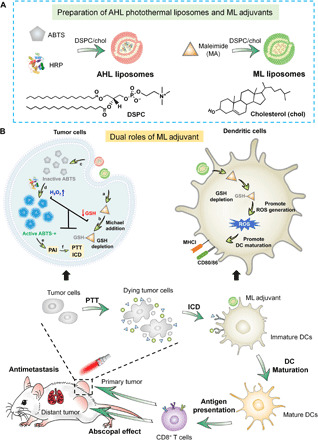
(A) Preparation of the AHL photothermal liposomes and ML adjuvant. (B) Tumor PTT-induced ICD to stimulate DC maturation and further promote the CD8+ T cell infiltration in tumor, inducing abscopal effect and antimetastasis effect of breast cancer. In tumor cells, ML promotes ROS generation and ABTS activation, thus augmenting the PA imaging (PAI)–guided PTT and ICD-mediated immunotherapy. In DCs, ML relieves the immunosuppression by inducing the ROS generation to promote DC maturation and antigen presentation.
RESULTS
Preparation and characterization of AHL and ML
ABTS and HRP were coloaded into liposomes to form catalysis systems (AHL). Besides, MA was loaded into liposomes (ML) to act as the GSH depletion adjuvant (Fig. 2A). The dynamic light scattering (DLS) particle sizes of AHL and ML were detected to be 103.6 and 115 nm, respectively (Fig. 2, B and C), which were in accordance with the transmission electron microscope (TEM) observation images, as inserted in the DLS data. Besides, the zeta potential of AHL and ML was detected to be −6.3 and − 4.6 mV, respectively.
Fig. 2. Physicochemical characterization of AHL and ML.
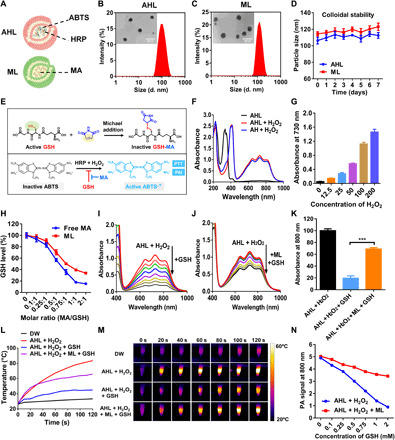
(A) Scheme of the component in AHL and ML. (B) Particle size of AHL determined by DLS. Inset: TEM images of AHL. Scale bar, 200 nm. (C) Particle size of ML determined by DLS. Inset: TEM images of ML. Scale bar, 200 nm. (D) Colloidal stability of AHL and ML within 7 days by monitoring the DLS particle size (n = 3). (E) Scheme illustration of MA-mediated GSH depletion and its role on enhancing the ABTS activation. (F) Ultraviolet-visible (UV-Vis) spectrum of AHL, AHL + H2O2, and AH + H2O2. (G) Absorbance of AHL at 730 nm in the presence of different concentrations of H2O2 (0 to 200 μM; n = 3). (H) The relative GSH level after treatment with increasing molar ratios of free MA/GSH or ML/GSH (n = 3). (I) Absorbance changing of AHL + H2O2 in the presence of increasing GSH. (J) Absorbance changing of AHL + H2O2 + ML in the presence of increasing GSH. (K) Statistics of the absorbance at 800 nm of AHL + H2O2, AHL + H2O2 + GSH, and AHL + H2O2 + ML + GSH (n = 3). ***P < 0.001. (L) Temperature-changing curve and (M) IR images of DW, AHL + H2O2, AHL + H2O2 + GSH, and AHL + H2O2 + ML + GSH after 808-nm laser irradiation for 120 s. (N) PA signal of AHL + H2O2 or AHL + H2O2 + ML in the presence of different concentrations of GSH (n = 3). d, diameter.
Colloidal stability of AHL and ML
We next investigated the colloidal stability of the liposomes during storage. As depicted in Fig. 2D, the particle size of both AHL and ML could maintain being stable during storage within 7 days, reflecting the excellent stability of the prepared liposomes.
H2O2-dependent catalysis of HRP and activation of ABTS
HRP could catalyze the oxidation of ABTS to ABTS·+ in the presence of H2O2, which held the potential to be developed for PA imaging and PTT of tumor (21). Unfortunately, the intracellular high level of GSH in tumor tissues would hurdle the activation process, leading to ineffective ABTS·+ generation. Therefore, GSH depletion was believed to be a convincing strategy to accelerate the generation of ABTS·+ and, hence, augmented the theranostic effects (Fig. 2E).
Here, to evaluate whether the encapsulation by liposomes affected the catalysis ability, ultraviolet-visible (UV-Vis) spectrum of free ABTS&HRP (+100 μM H2O2) and AHL (+100 μM H2O2) were compared among 500 to 1000 nm. As depicted in Fig. 2F, the intensity of the maximum absorbance at 730 nm between the free and liposome group was similar, indicating the retaining of the HRP catalysis ability of AHL. In addition, the absorbance of AHL without H2O2 was also measured, which was pretty weak compared with the AHL + H2O2 group. It demonstrated that the generation of absorbance among 500 to 1000 nm relied on H2O2. Therefore, we further investigated the absorbance intensity changing in the presence of different concentrations of H2O2. As expected, absorbance intensity was enhanced with the increasing H2O2 from 0 to 200 μM (Fig. 2G), validating the H2O2-dependent ABTS activation and absorbance enhancement.
MA-mediated GSH depletion
MA could specifically react with thiols by Michael addition at a mild environment, including the physiological environment of the body (18, 22, 23). The reaction between MA and GSH would deplete the functional thiols of GSH and result in the invalidation of GSH. Here, we first investigated the chemical reactions between MA and GSH by 1H nuclear magnetic resonance. As shown in fig. S1, MA exhibited a strong signal at 6.8 parts per million (ppm), which was attributed to the unsaturated bond of MA. However, with the GSH added, the peak at 6.8 ppm notably weakened, reflecting the successful reaction between MA and GSH. Moreover, the GSH depletion ability of MA was also confirmed by Ellman’s assay. As shown in Fig. 2H, with the increasing molar ratio of MA/GSH, the GSH level decreased in both MA and ML treatment group. Notably, the formation of liposomes exhibited negligible influence on the GSH depletion ability of MA.
The ABTS·+ reduction by GSH and ABTS·+ protection by GSH depletion
The above data in Fig. 2F has demonstrated that HRP could effectively catalyze the generation of ABTS·+ in the presence of H2O2. Here, we further evaluated the influence of GSH on ABTS·+ generation. As depicted in Fig. 2I, with the increasing amount of GSH added, the absorbance of ABTS·+ (730 nm) weakened sharply, reflecting the ABTS·+ scavenging effect by GSH. Next, to study the role of GSH depletion on ABTS·+ protection, GSH was pretreated with ML for 30 min and then incubated with the AHL + H2O2 system again. Expectantly, with the ML protection, the absorbance among 400 to 1000 nm decreased much more smoothly (Fig. 2J). The statistical analysis was shown in Fig. 2K, which evidently validated the ABTS·+ scavenging effect by GSH and ABTS·+ protection ability of ML by GSH depletion. Moreover, the similar protection effect by N-ethylmaleimide (NEM; positive control capable of GSH depletion) was observed (fig. S2A), further confirming this conclusion.
Photothermal effect of ABTS·+
The enhancement of absorbance at 800 nm after ABTS·+ generation inspired us to study its photothermal conversion effect. As shown in Fig. 2L, the temperature of AHL + H2O2 rise sharply with the laser irradiation from 0 to 120 s and could reach as high as 80°C, reflecting the superior photothermal conversion ability of ABTS·+. However, when GSH was involved in the system, the temperature was limited to 40°C even when the laser irradiation lasted for 120 s. The weakened photothermal effect could be ascribed to the reduced absorbance at 800 nm after GSH adding. ML was desired to improve the GSH tolerance of AHL + H2O2, showing as higher temperature after laser irradiation (60°C) compared with the AHL + H2O2 + GSH group (40°C). In addition, the ABTS·+-based photothermal effect was also confirmed using an IR camera, as shown in Fig. 2M. It reflected the important role of ML adjuvant on enhancing the photothermal effect of AHL + H2O2 in the presence of GSH.
PA signal of ABTS·+
The strong NIR absorbance of ABTS·+ also endowed it with PA imaging property (24). Similarly, the PA signal of AHL + H2O2 was also weakened with the increasing GSH added, reflecting the negative influence of GSH on PA imaging by AHL + H2O2 system. The PA signal decreased from five to one when the GSH was as high as 2 mM (Fig. 2N). Correspondingly, the protection effect of ML adjuvant on PA imaging was also demonstrated here where the PA signal recovered to 3.5, much stronger than the ML-absent solution. The above result validated the protecting effect of ML on PA imaging in the presence of GSH.
Cell uptake of HRP–fluorescein isothiocyanate–loaded AHL and rhodamine B–loaded ML
HRP was labeled with fluorescein isothiocyanate (FITC) and then encapsulated in AHL to track the liposomes. Besides, rhodamine B (RhB) was directly loaded in ML to track it in the cells. As shown in Fig. 3A, the strong fluorescence signal of FITC and RhB was observed in the cytosol, indicating the successful uptake of both AHL and ML by 4T1 cells.
Fig. 3. Cellular study of AHL and ML.

(A) Cell uptake of ABTS&HRP-FITC liposomes and MA&RhB liposomes by 4T1 cells. Scale bars, 10 μm. (B) GSH and ROS levels in 4T1 cells after treatment with phosphate-buffered saline (PBS) or ML. Scale bars, 50 μm. (C) Representative cell viability of 4T1 cells after treatment with AHL + H2O2, AHL + H2O2 + L, AHL + ML + H2O2, and AHL + ML + H2O2 + L (n = 3). ***P < 0.001. (D) Cell apoptosis of 4T1 cells after different treatments determined by flow cytometry (FCM). (E) Statistical analysis of (D). (F) Calreticulin (CRT)–positive cell analysis by FCM (n = 3). ***P < 0.001. (G) High-mobility group protein B1 (HMGB1) secreted from 4T1 cells and detected by an enzyme-linked immunosorbent assay (ELISA) kit (n = 3). **P < 0.01. (H) Adenosine triphosphate (ATP) secretion detection by the Enhanced ATP Assay Kit (n = 3). ***P < 0.001. (I) ROS level in DC2.4 cells after treatment with PBS or ML. Scale bars, 200 μm. (J) DC maturation after incubation with 4T1 cells with different treatments (gated on CD11c+ cells). (K) Statistical analysis of (J) (n = 3). **P < 0.01.
Intracellular ROS and GSH detection
As proved in the solution sample, MA could effectively react with thiols on GSH and lead to GSH consumption. Here, we wanted to further evaluate whether the MLs was able to down-regulate the intracellular GSH level. The fluorescence thiol probe was used to indicate the intracellular GSH level with or without ML treatment (25). As shown in Fig. 3B, without ML treatment, strong fluorescence was observed after GSH staining, demonstrating the high GSH level in tumor cells. Notably, the fluorescence turned dim after ML treatment, which indicated the successful down-regulation of intracellular GSH level. The GSH depletion by ML was also confirmed by quantitative analysis of the cell lysate via Ellman’s assay. The intracellular GSH level was only 22.3% versus control after treated with ML (fig. S2B).
The intracellular redox and oxidation level is well balanced in the cells. The down-regulation of the redox level would break this balance and held the potential to up-regulate the oxidation level (26). Here, we used DCFH-DA (dichlorodihydrofluorescein diacetate) to indicate the intracellular ROS level (27). The intracellular ROS could catalyze nonfluorescent DCFH to fluorescent 2,7-dichlorofluoroscein diacetate (DCF), enabling it be applied as a ROS probe. As depicted in Fig. 3B, after ML adjuvant treatment, the ROS level significantly up-regulated, showing as strong green fluorescence in the images taken by fluorescence microscopy. Besides, the mean fluorescence intensity (MFI) was also analyzed by flow cytometry (FCM) (fig. S2C). The MFI of ML-treated cells was around 398, about eightfold higher than control. It demonstrated the ROS up-regulation after antioxidant GSH depletion. Notably, the ROS level gradually increased from 0 to 12 hours and could still maintain a high level at 24 hours (fig. S2D), which provided sufficient time for intracellular catalysis of AHL.
Tumor cell growth inhibition and cell apoptosis
The cytotoxicity of AHL and ML was first evaluated on 4T1 cells. As depicted in fig. S3A, AHL did not inhibit the cell growth even when the ABTS concentration reached 50 μg/ml, indicating the good biocompatibility of AHL. The MLs exhibited dose-dependent tumor cell inhibition, median inhibitory concentration (IC50) of which was around 0.5 μg/ml on 4T1 cells (fig. S3B). The strong cytotoxicity of ML on 4T1 cells could be ascribed to GSH depletion and ROS elevation.
The generation of ABTS·+ in the presence of H2O2 has been proved to cause photothermal effect under laser irradiation, holding the potential to be applied for tumor PTT. Therefore, the tumor cell killing effect of AHL + H2O2 in the absence or presence of laser was studied on 4T1 cells. As shown in fig. S3C, the involvement of 100 μM H2O2 in the AHL system did not generate significant toxicity, where the cell viability was more than 95% compared with untreated cells. However, after laser irradiation, AHL + H2O2 could effectively kill the tumor cells when the ABTS concentrations were higher than 10 μg/ml. Furthermore, with the ML adjuvant pretreatment, tumor cell killing efficacy was markedly enhanced, the IC50 of which was as low as 2.5 μg/ml (fig. S3D), much lower than the ML untreated groups of around 50 μg/ml. The result demonstrated the strong synergistic effect between ML and AHL, as shown in Fig. 3C (ABTS, 20 μg/ml; MA, 0.25 μg/ml). In addition, to confirm the synergistic effect between GSH depletion agents and AHL, the NEM capable of GSH depletion was set as the positive control. As shown in fig. S3E, when coincubated with NEM (0.15 μg/ml), the IC50 of AHL decreased markedly to around 4 μg/ml, exhibiting similar effect as ML. It further demonstrated that the cell killing enhancing effect of ML on AHL + L (laser) was ascribed to the GSH depletion.
We next performed the cell apoptosis study of AHL + H2O2 and AHL + ML + H2O2 with or without laser irradiation by annexin V–FITC/propidium iodide (PI) double staining (28). The result showed that only the laser or AHL + H2O2 treatment could not induce cell apoptosis (Fig. 3D). In accordance with the MTT (methylthiazolyldiphenyl-tetrazolium bromide) data, the AHL + H2O2 + L (Laser) treatment could induce moderate cell apoptosis (32.5% apoptosis cells versus control) owing to the photothermal effect of ABTS·+. Meanwhile, without laser treatment, AHL + ML + H2O2 caused 39.6% cell apoptosis. AHL + ML + H2O2 + L treatment caused the largest apoptosis ratio of about 75.3%, confirming the synergistic killing effect between ML and AHL (Fig. 3E).
ICD induced by PTT in vitro
As reported, the cancer treatments such as PTT, PDT (photodynamic therapy), or chemotherapy often induced ICD by causing the dying cells to release damage-associated molecular patterns (DAMPs) immunogenic signals, followed by triggering the maturation of DCs and engulfment of dying tumor cells. The crucial DAMPs include CRT (calreticulin) exposure, HMGB1 (high-mobility group protein B1), and ATP (adenosine triphosphate) release (29, 30), which were analyzed here to investigate the generation of ICD by PTT.
The 4T1 cells were separately treated with AHL + H2O2 and AHL + ML + H2O2 with or without laser. After treatment, the cells were stained with CRT-FITC antibody and 4′,6-diamidino-2-phenylindole (DAPI). CRT expression was then observed by confocal laser scanning microscopy (CLSM). As shown in the result (fig. S4A), the cells treated with AHL + H2O2 nearly have no CRT exposure, while obvious green fluorescence was observed after laser irradiation, indicating the PTT on CRT exposure induction. In addition, the AHL + H2O2 + ML treatment could also stimulate the CRT exposure, which could be owing to the GSH depletion and ROS up-regulation on tumor cell killing. Notably, the green fluorescence was pretty bright after treated with AHL + ML + H2O2 + L, much stronger than the ML (−) group, reflecting the synergistic effect of ML on tumor cell killing and ICD induction. The CRT+ cells after treated with different inducers were also analyzed by FCM. AHL + ML + H2O2 + L treatment could generate 80% CRT-positive cells, while the positive cells induced by AHL + H2O2 + L and AHL + ML + H2O2 were 35 and 23%, respectively (Fig. 3F).
HMGB1 secretion was detected by an enzyme-linked immunosorbent assay (ELISA) kit of the cell medium after treatment, and ATP secretion was measured by bioluminescence-based ATP assay kit (31). As shown in Fig. 3 (G and H), AHL + ML + H2O2 + L treatment was able to significantly promote the secretion of HMGB1 and ATP from the dying cells. Furthermore, the HMGB1 level and ATP level were much higher than the AHL + H2O2 + L group, indicating the superiority of MA involvement on enhancing the ICD induction.
The above data had validated the ROS up-regulation after GSH depletion by ML in 4T1 cells. Next, the intracellular ROS level in DCs was also determined after incubation with ML. As shown in Fig. 3I, the green fluorescence of DCF was significantly enhanced after incubation with ML. It indicated that the ML treatment could significant up-regulate the intracellular ROS level. The generation of ROS in DCs may hold the risk to generate toxicity to it, which was studied by MTT assay. As shown in fig. S4B, the ML did not generate toxicity to DCs until the concentrations of MA were higher than 2 μg/ml. Therefore, the applied concentration of 0.25 μg/ml was safe for DCs. The generation of ROS by ML could directly promote the maturation of DCs to about 36.6 versus 17.7% of control (fig. S4C). Moreover, we were desired to further evaluate whether the DC maturation promotion strategy was generally applicable for other chemicals capable of GSH depletion. Here, cinnamaldehyde and NEM, as other GSH depletion reagents, could also directly promote DC maturation to 33.4 and 70.5%, respectively, versus 12.2% of phosphate-buffered saline (PBS) treatment group (fig. S4D). It reflected that DC maturation induced by GSH depletion strategy was not limited to MA, which was also applicable for other chemicals capable of GSH depletion.
For ICD-induced DC maturation study, after different treatments, the 4T1 cells were incubated with immature DC2.4 cells. CD80–PE (phycoerythrin) and CD86–APC (allophycocyanin) antibodies were chosen as the biomarkers to evaluate the mature of DCs (32). As shown in Fig. 3 (J and K), AHL + ML + H2O2 could effectively induce the maturation of DCs (CD80+ and CD86+) to about 37.5%, probably ascribed to the ICD induction ability of ML and ROS up-regulation in DCs by GSH depletion. Moreover, after laser irradiation, the matured ratio was further increased to as high as 80.9%, owing to the enhanced ICD induction after laser irradiation. Besides, in correspondence with the CRT, HMGB1, and ATP level, the matured DC ratio of the AHL + H2O2 + L group (46.2%) was much lower than the AHL + ML + H2O2 + L group, further validating that the ML was a superior adjuvant to promote DC maturation. Therefore, to conclude, ML adjuvant was demonstrated to significantly enhance the induction of ICD by AHL + H2O2 + L and the maturation of DCs.
In vivo GSH depletion and PA imaging
The GSH depletion performance of ML adjuvant in vivo was investigated on 4T1 tumor model. As shown in Fig. 4A, AHL could not down-regulate the GSH level, while AHL + ML significantly depleted the tumoral GSH (43% versus saline group). It validated that the ML was applicable for tumoral GSH depletion. Subsequently, the influence of GSH depletion on PA imaging was further evaluated. As supposed, PA signal at tumor site was pretty weak with single AHL treatment (Fig. 4B). However, when the mice were coadministrated with ML, the PA signal markedly enhanced to about four times than the single AHL group (fig. S5). It reflected that the ML treatment provided a preferable environment to enhance the conversion ratio of ABTS to ABTS·+ and, thus, amplify the PA signal at tumor site.
Fig. 4. In vivo PA imaging and antitumor study of AHL and ML.
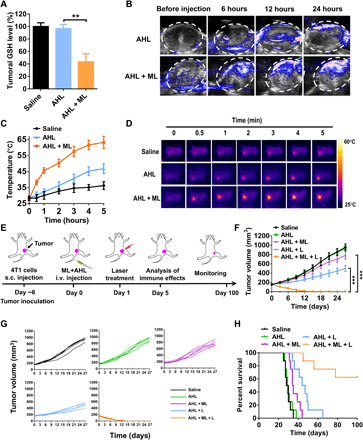
(A) Tumoral GSH detection after treatment with saline, AHL, or AHL + ML (n = 3). **P < 0.01. (B) PA images of 4T1 tumor after intravenous (i.v.) injection of AHL or AHL + ML. (C) Tumor temperature changing after treatment with saline, AHL, or AHL + ML and laser irradiation (n = 3). (D) Photothermal imaging and tumoral temperature analysis of the mice using an IR camera after treatment with saline, AHL, or AHL + ML. (E) Schematic illustration of the animal experimental design. (F) Primary tumor growth curves with the mean tumor volumes of 4T1 tumor–bearing BALB/c mice model (n = 5). ***P < 0.001. s.c., subcutaneous. (G) Primary tumor growth curves of individual mouse in different groups of 4T1 tumor–bearing BALB/c mice model. (H) The survival percentages of the tumor-bearing BALB/c mice (n = 8).
In vivo photothermal effect
As demonstrated above, the PA imaging exhibited that the generation of active ABTS·+ reached the maximum level at 24 hours. Therefore, the laser treatment and photothermal study were performed at 24 hours after injection. In accordance with the PA signal intensity, the AHL treatment could only generated weak photothermal effect where the tumor temperature was limited to 45°C after laser irradiation for 5 min (Fig. 4, C and D). On the contrary, after GSH depletion, the ML + AHL group exhibited strong photothermal effect. The tumor temperature could reach 45°C within 1 min after laser irradiation and could maintain 55°C for 2 min. It is reflecting the benefit of GSH depletion on enhancing the photothermal effect of AHL in vivo.
In vivo antitumor efficacy and immune activation
The in vivo antitumor efficacy was next evaluated on 4T1 tumor model. As schemed in Fig. 4E, the AHL or ML + AHL was administrated on day 0 by intravenous injection, followed by laser treatment for 5 min at 24 hours after each injection. The immune effects were analyzed on day 5 by taking part of the mice. Then, the remaining mice were monitored until day 100. Tumor growth curve of each mouse was monitored. As shown in Fig. 4 (F and G), the AHL treatment had no tumor inhibition effect versus the saline group. Meanwhile, it only generated moderate tumor inhibition after laser irradiation, shown as poor PTT efficacy. The weak therapeutic effect of AHL + L could be owing to the inefficient activation of ABTS and weak photothermal effect, as demonstrated above (Fig. 4D). Notably, with the assistant of ML to deplete tumoral GSH, the AHL + ML + L combination treatment markedly inhibited the tumor growth and even led to the tumor ablation with only two treatments, indicating the superior synergistic effect of AHL + L and ML. Body weight of the mice was also monitored until day 27. As shown in fig. S6, no weight loss was found for each group, reflecting the good biocompatibility of the therapeutic treatment. The synergistic treatment with ML + AHL + L significantly extended the long-term survival rate to 62.5% after monitoring for 100 days (Fig. 4H). All of the mice were dead within 70 days by the treatment with AHL + L, further confirming the superiority of the combination therapy.
The PTT-induced tumor cell apoptosis and necrosis were evaluated by hematoxylin and eosin (H&E) staining and immunofluorescence staining of cleaved caspase 3 expression. As shown in fig. S7, the AHL + ML + L treatment could significantly induce the cell apoptosis and necrosis of tumor cells by H&E staining, much more serious than the AHL + L or AHL + ML treatment group. Besides, the cleaved caspase 3 level was analyzed by immunofluorescence staining, whose up-regulation was commonly applied to indicate the cell apoptosis. In accordance with the H&E result, the cleaved caspase 3 was significantly up-regulated after AHL + ML + L treatment, reflecting the activation of cell apoptosis.
As proved in the cell level, the ABTS·+-based PTT could induce the ICD of tumor cells and, therefore, promote DC maturation. The matured DCs would further activate the immune system to kill the cancer cells. Here, DCs, as important APCs, played a pivotal role in the adaptive immune response by effective antigen presentation and T cell activation (33, 34). Therefore, we first evaluated whether the treatment could promote DC maturation in the lymph nodes. The matured DCs were analyzed by counting the CD80+ CD86+ cell ratios (gated on CD11c+ cells). As shown in Fig. 5 (A and B), the matured DCs significantly increased to about 57% versus the saline group (22%). However, the AHL + L treatment only induced 35% DC maturation. Notably, the AHL + ML treatment was also able to induce DC maturation to about 32%, validating that the ML could act as an adjuvant to promote DC maturation.
Fig. 5. In vivo immune activation by AHL and ML.
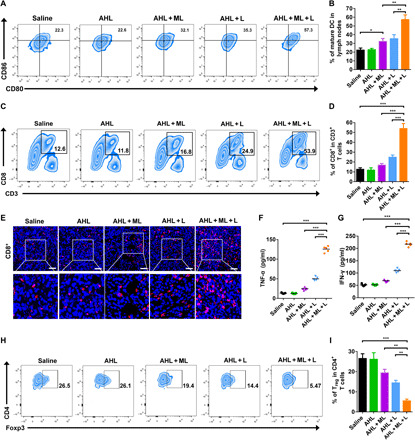
(A and B) DC maturation on 4T1 tumor–bearing mice (gated on CD11+ DC cells). Cells in lymph nodes were collected on day 5 after various treatments for assessment by FCM after staining with CD11c+, CD80, and CD86. *P < 0.05 and **P < 0.01. (C and D) FCM examination of the intratumor infiltration of CD8+ T cells (gated on CD3+ T cells). ***P < 0.001. (E) Immunofluorescence images of CD8+ T cells. Scale bars, 100 μm. (F and G) Contents of tumor necrosis factor–α (TNF-α) and interferon-γ (IFN-γ) in plasma on day 5 after treatment. ***P < 0.001. (H and I) The regulatory T cell (Treg) frequencies in tumors after different treatments examined on day 5 after treatment. Data represent means ± SD (n = 5). **P < 0.01 and ***P < 0.001.
After successful antigen presentation, the combination treatment–induced activation and expansion of the naïve CD8+ were determined. As determined by FCM in Fig. 5 (C and D), after the AHL + ML + L treatment, the ratio of CD8+ T cells increased to 53%, much higher than the AHL + L–treated mice of 24% and the saline group of 12%. It demonstrated that the ML adjuvant could effectively promote the CD8+ T cell activation and infiltration in tumor. The enhanced infiltration and activation of CD8+ in tumor tissues after AHL + ML + L treatment were also confirmed by immunofluorescence staining of the tumor sections (Fig. 5E). In addition, the combination treatment significantly up-regulated the level of tumor necrosis factor–α (TNF-α), interferon-γ (IFN-γ), and interleukin-12 (IL-12) in the plasma (Fig. 5, F and G, and fig. S8), which are the key biomarkers released by immune cells of the TME for altering T cell responses (35, 36). As we know, the effective immune response could also be negatively regulated by Tregs (tumor regulatory T cells). Thus, the ratio of CD4+, CD25+, Foxp3+ in Treg was also determined by FCM. As shown in Fig. 5 (H and I), after ML + AHL + L treatment, the Foxp3+ cell ratio obviously decreased to 5% versus the saline group of 26%. In summary, the adjuvant ML was proved to not only remodel the TME by GSH depletion and ROS elevation but also enhance the immune response via promoting DC maturation, CD8+ activation, and infiltration and reducing the Treg ratio in tumor.
Biosafety study
To evaluate the biocompatibility of AHL and ML, the main organs (heart, liver, spleen, lung, and kidney) were harvested on day 5 after treatment and analyzed by H&E staining. As shown in fig. S9, no pathological change was found after treatment with AHL + L or AHL + ML + L compared with the saline group, indicating the good biocompatibility of ML and AHL to the main organs.
Abscopal effect and antimetastasis effect
We also desired to evaluate whether the activation of immune response would have antitumor effect on the untreated distant tumor. The therapeutic schedule was shown in Fig. 6A. As shown in Fig. 6B, the distant tumors of saline, AHL, and the AHL + ML group were growing rapidly. AHL + L treatment on primary tumor had weak influence on the distant tumor owing to the relatively poor immune response. On the contrary, with the strong immune response induction, AHL + ML + L treatment on primary tumor exhibited notable abscopal effect on the inhibition of distant tumor growth where the tumor volume was only 28% versus the saline group on day 27. Accordingly, the augmented CD8+ infiltration and reduced Treg in distant tumor were determined by FCM as shown in Fig. 6 (C and D).
Fig. 6. Abscopal effect and antimetastasis effect of AHL and ML.
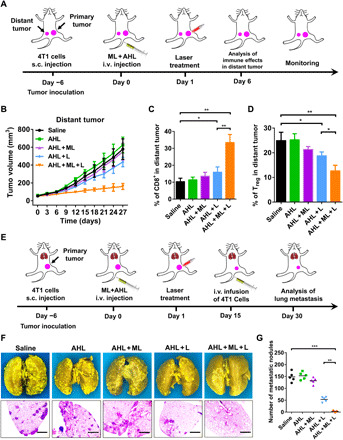
(A) Schematic illustration of the animal experimental design for distant tumor. (B) Distant tumor growth curves with the mean tumor volumes of 4T1 tumor–bearing BALB/c mice model. Data represent means ± SD (n = 5). (C) Percentage of CD8+ T cells in the distant tumors. Data represent means ± SD (n = 5). *P < 0.05 and **P < 0.01. (D) Percentage of Tregs in the distant tumors. Data represent means ± SD (n = 5). *P < 0.05 and **P < 0.01. (E) Schematic illustration of the animal experimental design for antimetastatic study. (F) Representative photographs and H&E staining of lung tissues with tumor metastasis collected on day 30. Scale bars, 200 μm. (G) Quantification of pulmonary metastasis nodules in different groups of 4T1 tumor–bearing BALB/c mice. Data represent means ± SD (n = 5). **P < 0.01 and ***P < 0.001.
Next, the immune response–mediated antimetastasis effect (37) was investigated on 4T1 metastasis model, and the therapeutic schedule was shown in Fig. 6E. The construction of primary tumor and treatment was in accordance with the antitumor study. Besides, 4T1 cell infusion was performed on day 15, and the analysis of lung metastasis was evaluated on day 30. As shown in Fig. 6F, after immersed in Bouin’s fluid, the metastatic nodules were shown as yellow foci (38). With the treatment of AHL + ML + L, the metastatic foci significantly decreased and even totally disappeared, reflecting the superior antimetastasis effect of AHL + ML + L. The antimetastasis effect of AHL + ML + L was also confirmed by the H&E staining (Fig. 6F). After imaging, the number of metastatic nodules was also counted under microscopy (Fig. 6G). The average metastatic nodules of the saline group were around 150 of each mouse and decreased to 50 with AHL + L treatment. Notably, it further decreased to within five with the assistant of ML adjuvant. All of the data demonstrated the inspiring antimetastasis effect of the combination strategy via using GSH depletion adjuvant.
DISCUSSION
Here, MA capable of GSH depletion was encapsulated into liposomes to form the nanoadjuvant ML. The MA could react with the thiols on GSH and lead to the block of GSH, which break the balance of intracellular oxidation-redox system. Thus, ML adjuvant could up-regulate the intracellular ROS level in both tumor cells and DCs, endowed it with two roles in the tumor therapy. In this work, we also prepared HRP and ABTS coloaded liposomes (AHL) as the photothermal reagents that were inactivated in the blood circulation while activated in the ROS-abundant tumor for tumor-specific PTT and ICD induction. The induction of ICD could promote the CRT exposure as the “eat me” signal and HMGB1 and ATP secretion as the “find me” signal to activate immune response by recruiting DCs and CD8+ T cells (29, 30). As we know, DC maturation is the key factor for antigen presentation and CD8+ T cell activation. Therefore, the ML adjuvant was applied here to promote DC maturation by up-regulating the ROS as the danger signal for effective inflammation response (8, 13). As a result, the dual role of ML played good performance on the treatment of primary tumor, distant tumor, and metastatic tumor of breast cancer. The ML capable of GSH depletion was believed to be a superior candidate of adjuvants for enhancing immune response and cancer therapeutic efficacy.
Although the MLs have been demonstrated to display outstanding immune enhancement effect, there remain some limitations in this work that needs further evaluation in the future. Here, we revealed that the intracellular GSH depletion was a convincing strategy to enhance oxidation therapy and improve the immune response by promoting DC maturation. However, we only applied MA, cinnamaldehyde, or NEM to deplete GSH. Apart from them, there are also many drugs and many inorganic materials holding the potential to deplete GSH, such as manganese dioxide (MnO2), iron (Fe3+), and so on (15–16). It remains unclear whether these GSH depletion reagents share the same functions with MA, which needs further evaluations in the future to expand the application of this finding. Besides, the combination therapy of ML adjuvant with immunosuppressant anti–programmed death ligand 1 antibody, chemotherapy, or PDT still remained to be investigated to demonstrate its universality.
The laboratory study of the AHL or ML has been finished, and the large-scale production is in progress. Up to now, many liposomes formulations have been applied in the clinic and are available on the market. The advanced production technology and mature quality management system could accelerate the large-scale production of the AHL or ML. In addition, the loaded ABTS&HRP or MA was relatively cheap and easily obtained with kilogram level, which could further promote this process. Notably, the ML adjuvant has been demonstrated to achieve inspiring therapeutic effect on mice, and the evaluation on large animals (monkey or pig) is under planning. Thus, once the large-scale production and therapeutic evaluation on big animals are completed, the AHL and ML formulations are ready to be pushed for clinical translation.
MATERIALS AND METHODS
Materials
FITC, RhB, ABTS, HRP, MA, 1,2-distearoyl-sn-glycero-3-phosphocholine (DSPC), and GSH were purchased from the Aladdin chemical reagent company (Shanghai, China). Chlorin e6 was obtained from Sigma-Aldrich (MO, USA). Annexin V–FITC/PI cell apoptosis assay kit and Bouin’s fluid were purchased from Beijing Solarbio Science and Technology Co. Ltd. Dulbecco’s modified Eagle’s medium, PBS, MTT, DAPI, reduced GSH assay kit, and ROS fluorescence detection kit was purchased from KeyGen Biotech (Nanjing, China). Mouse TNF-α (no. EK0527), IFN-γ (no. EK0375), and IL-12 (EK0932) ELISA kit were purchased from Wuhan Boster Biological Technology Co. Ltd.
Preparation of AHLs
HRP liposomes were prepared by thin-film hydration method. Briefly, 20 mg of DSPC and 5 mg of cholesterol were dispersed into 15 ml of chloroform, followed by rotary evaporation for 30 min in a 50-ml round-bottom flask. After evaporating, 5 ml of HRP-contained and ABTS [HRP (0.2 mg/ml) and ABTS (1 mg/ml)]–contained water solution was added into the flask with vortex for another 30 min to suspend the lipid into the solution. The suspension was then well dispersed by ultrasound to obtain uniform AHL liposomes. At the end, the AHL liposome solutions were freeze-dried into powder for later use.
Preparation of MLs
Similar as the preparation method of AHL, MLs were also prepared by thin-film hydration method. Briefly, 20 mg of DSPC and 5 mg of cholesterol were dispersed into 15 ml of chloroform, followed by rotary evaporation for 30 min in a 50-ml round-bottom flask. After evaporating, 5 ml of MA (0.2 mg/ml)–contained water solution was added into the flask with vortex for another 30 min to suspend the lipid into the solution. The suspension was then well dispersed by ultrasound to obtain uniform MLs. At the end, the ML solutions were freeze-dried into powder for later use.
Characterization of the liposomes
The liposome powder (AHL or ML) was dispersed into saline for characterization. The DLS particle sizes and zeta potential of the liposomes were measured using Malvern Mastersizer. The morphology of the liposomes was observed using H-600 TEM (Hitachi, Japan).
H2O2-dependent catalysis of HRP and activation of ABTS
The HRP-mediated catalysis of inactive ABTS to active ABTS·+ was evaluated by scanning the UV-Vis spectrum among 200 to 1000 nm. Briefly, AHL or free ABTS&HRP [ABTS (60 μg/ml) and HRP (15 μg/ml)] was mixed with different concentrations of H2O2 (0, 12.5, 25, 50, 100, and 200 μM) and reacted at 37°C for 1 hour, followed by measuring the UV-Vis absorbance.
MA-mediated GSH depletion and the protection of MA against proteins
The GSH depletion ability of MA and ML was evaluated by Ellman’s assay. GSH was dissolved in PBS (pH 7.4) and reacted with free MA or ML at various molar ratios for 4 hours at 37°C. After that, the unreacted GSH was detected by Ellman’s assay via quantitative analysis of the free thiols.
The protection effect of liposomes on MA was evaluated by pretreatment of MA and ML with bovine serum albumin (BSA) (50 mg/ml) or fetal bovine serum (FBS) (v/v 1:1). After incubation for 4 hours, the MA/BSA or MA/FBS mixture solution was processed with ultrafiltration. The GSH depletion ability of the sublayer was measured, as mentioned above. Besides, the ML/BSA or ML/FBS solution was centrifuged at 12,000 rpm for 30 min to separate the liposomes. The precipitate was then resuspended with PBS to measure the GSH depletion ability.
Colloidal stability of the AHL and ML
The colloidal stability of the liposomes was firstly evaluated by monitoring the DLS size changing under storage environment at 4°C on days 1, 2, 3, 4, 5, 6, and 7 after preparation. In addition, the catalysis ability of AHL was monitored by measuring the absorbance at 730 nm under 100 μM H2O2. The GSH depletion ability of MA was also monitored by the methods mentioned above.
Influence of GSH and GSH depletion on ABTS·+ generation
AHL solution was mixed with 100 μM H2O2 and reacted at 37°C for 1 hour to obtain ABTS·+. Afterward, different concentrations of GSH (0, 0.1, 0.2, 0.4, 0.6, 0.8, 1, and 2 mM) were added to the mixture solution and reacted for 5 min, followed by measuring the absorbance among 400 to 1000 nm.
For GSH depletion on ABTS·+ protection experiment, different concentrations of GSH (0, 0.1, 0.2, 0.4, 0.6, 0.8, 1, and 2 mM) was pretreated with ML (MA, 2 mM) or NEM (2 mM) for 30 min and then added into the AHL+H2O2 system, followed by reacting for 5 min and absorbance measurement.
Photothermal effect of ABTS·+
The obtained above solutions of DW (deionized water), AHL + H2O2, AHL + H2O2 + GSH, and AHL + H2O2 + GSH were irradiated with NIR laser (808 nm, 1 W/cm2), and the temperature was monitored every 10 s for 120 s using both a temperature detector and an IR camera.
PA imaging of ABTS·+ in the solution
The AHL + H2O2 group was incubated with different concentrations of GSH (0, 0.1, 0.2, 0.4, 0.6, 0.8, 1, and 2 mM), and then the PA imaging was obtained by Vevo LAZR imaging system. For the GSH depletion group, the GSH was pretreated with ML for 30 min and then incubated with AHL + H2O2 for 1 hour in the 37°C water bath, followed by PA imaging.
Cell uptake
The cell uptake of ML and AHL was evaluated on 4T1 cells (murine breast cancer). To track the ML, water soluble dye RhB was encapsulated into liposomes, obtaining ML&RhB liposomes. For HRP-FITC synthesis, 2 mg of FITC was dissolved into 100 μl of dimethyl sulfoxide (DMSO) and then dropwise added into HRP containing PBS solution (20 mg, 5 ml, pH 7.4). The mixture solution was stirred at room temperature for 12 hours, followed by dialysis against distilled water and lyophilization. HRP-FITC was used to replace HRP for obtaining FITC-labeled AHL liposomes (ABTS&HRP-FITC liposomes). For CLSM study, 4T1 cells were seeded into confocal dishes and grew for 24 hours. Afterward, ML&RhB liposomes and ABTS&HRP-FITC liposomes were coincubated with cells for 4 hours. After incubation, the cells were fixed with polyformaldehyde, and the nucleic was stained with DAPI for 15 min. The samples were observed by CLSM (Zeiss, LSM700).
Intracellular GSH depletion and H2O2 elevation
For GSH detection, 4T1 cells (1 × 10⁵ per well) were seeded into a six-well plate and grew for 24 hours in the incubator. Then, the cells were washed with PBS and incubated with ML (0.5 μg/ml) for 4 hours. After treatment, the 4T1 cells were harvested, and the intracellular GSH level was detected by GSH/GSSH (oxidized glutathione) assay kit based on Ellman’s assay. We also evaluated the intracellular GSH level by Fluorescence Thiol Detector Assay Kit (Cayman). The 4T1 cells were given the same treatment as mentioned above and stained with the fluorescence thiol dye for 30 min at 37°C in the incubator, followed by washing with PBS twice and observing with fluorescence microscopy.
The intracellular ROS levels of both 4T1 cells and DCs after ML treatment were evaluated by DCFH-DA. ROS could selectively oxidize the nonfluorescent DCFH to fluorescent DCF, enabling the DCFH to indicate the ROS level. The cells were given the same treatment as mentioned in the GSH detection experiment. The cells were stained with DCFH-DA for 30 min in the incubator and washed with PBS before observation by fluorescence microscopy. In addition, the intracellular H2O2 level was analyzed by H2O2 quantitative analysis kit referring to the standard protocol.
Cell viability
The cytotoxicity of AHL and ML in the absence or presence of laser irradiation was evaluated on 4T1 cells by MTT assay. The 4T1 cells (5 × 10³ per well) were seeded into a 96-well plate and grew for 24 hours to reach the confluence of 80%. AHL with different concentrations of ABTS (0, 2.5, 5, 10, 20, 30, 40, and 50 μg/ml) were diluted with phenol red–free medium and incubated with cells for 24 hours. Then, 20 μl of MTT solution (5 mg/ml) were added to each well and incubated with the cells for additional 4 hours, followed by removing the medium and adding DMSO to dissolve the formazan. The absorbance at 492 nm was detected using a microplate reader. The cell viability was calculated according to the following formula: Cell viability = Absorbance of test group / Absorbance of untreated group × 100%.
Besides, the ML with different concentrations of MA (0, 0.12, 0.25, 0.5, 1, 2, and 4 μg/ml) were also incubated with cells for 24 hours and performed on MTT assay. Furthermore, the tumor cell–killing ability of AHL + H2O2, AHL + H2O2 + L (1 W/cm2, 5 min), AHL + H2O2 + ML, and AHL + H2O2 + ML + L (1 W/cm2, 5 min) was also evaluated on 4T1 cells.
Cell apoptosis
The tumor cell apoptosis after different treatments was evaluated by annexin V/PI assay on 4T1 cells. 4T1 cells were seeded into 12-well plate and given different treatments of AHL + H2O2, AHL + H2O2 + L (1 W/cm2, 5 min), AHL + H2O2 + ML, and AHL + H2O2 + ML + L (1 W/cm2, 5 min) when reaching 80% confluence. After 24 hours, the cells were harvested and washed with PBS twice, followed by staining with annexin V (3 μl) and PI (3 μl) for 15 min. The samples were analyzed by FCM.
ICD biomarkers detection
The exposure of CRT and secretion of HMGB1 and ATP were chosen as the biomarkers of the induction of ICD. First, the exposed CRT was detected by CLSM and FCM. For CLSM observation, 4T1 cells were seeded into confocal dishes and grew to 80% confluence. The cells were given different treatments: PBS, AHL + H2O2, AHL + H2O2 + L (1 W/cm2, 5 min), AHL + ML + H2O2, and AHL + ML + H2O2 + L (1 W/cm2, 5 min). After incubation for 24 hours, the medium was removed, and the cells were washed with PBS twice. The nucleic was stained with DAPI for 15 min at room temperature after fixed. The cells were washed with PBS three times and then observed by CLSM. For FCM analysis, 4T1 cells were seeded into a 24-well plate. When reached 80% confluence, the cells were given the same treatment, as mentioned in the CLSM observation experiment. After incubation, cells were washed, harvested, and stained with CRT-FITC antibody under 4°C for 30 min. The cell samples were analyzed by BD Accuri C6. The secretion of HMGB1 in the culture medium was detected by ELISA assay kit, and the secretion of ATP was detected by the Enhanced ATP Assay Kit.
In vitro induction of DC maturation
The induction of DC maturation was evaluated on DCs (DC2.4). Briefly, 4T1 cells were seeded into a 12-well plate and given different treatments, as mentioned in ICD biomarker detection experiment. After 12 hours posttreatment, the DC 2.4 cells were cocultured with the residual 4T1 cells for additional 12 hours. After staining with anti–CD11c-FITC, anti–CD80-PE, and anti–CD86-APC antibodies, the maturation of DC cells was examined using FCM.
Animals and tumor models
The female BALB/c (18 to 22 g) mice were purchased from Yangzhou University. The unilateral mouse breast tumor xenograft model was established by subcutaneous injection of 4T1 cells (1 × 10⁶ per mouse) into the right flank of the mice. For the construction of bilateral tumor model, the 4T1 cells (1 × 10⁶ per mouse) were subcutaneously injected into the right flank on day −6 to obtain the primary tumor, and 4T1 cells (2 × 10⁵ per mouse) were subcutaneously injected into the left flank of the same mouse on the same day to obtain the distant tumor. For the construction of tumor metastasis model, mice were subcutaneously injected with 4T1 cells (1 × 10⁶ per mouse) into the right flank on day −6 and intravenously injected with 4T1 cells (5 × 10⁵ per mouse) on day 15. All animal experiments followed regulations of the Institutional Animal Care and Use Committee of China Pharmaceutical University, and protocols were approved by the Science and Technology Department of Jiangsu Province.
In vivo tumoral GSH depletion by ML
The tumoral GSH depletion was evaluated when tumor size reached 300 mm3. The mice were randomly divided into three groups: saline, AHL, and AHL + ML [200 μl; HRP (1 mg/ml), ABTS (4 mg/ml), and MA (0.5 mg/ml)]. The formulations were administrated by intravenous injection. At 24 hours after injection, the tumors were harvested, and the GSH level of the tumor was determined according to the standard protocol of the Reduced GSH Assay Kit. Briefly, the tumor tissues were frozen in liquid nitrogen and then pulverized. Subsequently, the proteins in the sample were removed by the buffer, followed by homogenate treatment. After centrifuging under 10,000g and 4°C for 10 min, the GSH level in the supernatant was measured by Ellman’s assay.
In vivo PA imaging of AHL and ML + AHL
When the tumor size reached 300 mm3, the 4T1 tumor–bearing mice were randomly divided into two groups (n = 3) and imaged by Vevo LAZR imaging system before injection to obtain the background signal of the mice (800 nm). Afterward, the mice were administrated by intravenous injection of AHL and AHL + ML [200 μl; HRP (1 mg/ml), ABTS (4 mg/ml), and MA (0.5 mg/ml)], and the PA imaging of the tumor was performed at 6, 12, and 24 hours after injection at an exciting wavelength of 800 nm.
In vivo photothermal effect
The in vivo photothermal effect of AHL and AHL + ML was evaluated on 4T1 xenograft model when tumor size reached 150 mm3. The mice were randomly divided into three groups and administrated by intravenous injection of saline, AHL, and AHL + ML [200 μl; HRP (1 mg/ml), ABTS (4 mg/ml), and MA (0.5 mg/ml)]. The laser irradiation (1 W/cm2, 808 nm, 5 min) was given to each mouse at 24 hours after injection. The temperature of the tumor was monitored and imaged using an IR camera.
Antitumor efficacy, abscopal effect, and antimetastasis study
For in vivo antitumor efficacy study, the mice were randomly divided into five groups (n = 13): saline, AHL, AHL + L, AHL + ML, and AHL + ML + L. When the tumor size reached 150 mm3, the mice were administrated with the formulations by intravenous injection on day 0. The laser irradiation treatment (1 W/cm2, 808 nm, 5 min) was performed at 24 hours after injection (day 1).
Tumor size and body weight of each mouse were recorded every 3 days by day 27. The tumor volume was calculated according to the following formula: Tumor volume (mm3) = 0.5 × length × width2. The survival time of the remaining mice for each group was monitored until day 100 after the first injection. The PTT-induced tumor cell apoptosis and necrosis were evaluated by H&E staining and immunofluorescence staining of cleaved caspase 3 on day 5 after injection.
The infiltrating lymphocytes in tumors of each group were analyzed by FCM (BD FACSVerse, USA). The collected lymphocytes were incubated with anti–CD45-FITC 30-F11 (BD), anti–CD3-PerCP-Cy5.5 (BD), and anti–CD8-PE-Cy7 (BD) antibodies to determine the content of CD8+ T cells. In addition, the Tregs infiltrating in the tumors were stained by anti–CD25 BV421 3C7 (BD), anti–CD4-APC RM4-5, and anti–Foxp3-PE (BD) antibodies. The ratio of matured DCs in the lymph nodes was also analyzed by FCM after staining with anti–CD11c-FITC (BD), anti–CD80-PE (BD), and anti–CD86-APC (BD) antibodies.
For abscopal effects study, the liposomes were administered by intravenous injection, and the laser irradiation of 808 nm was also performed on primary tumors. The immune effects (CD8+ and Treg) in distant tumors were analyzed on day 6 after the first injection, and the tumor sizes were monitored until day 27 after the first injection.
For antimetastasis effect study, the primary tumor was given the same treatment, as mentioned in the abscopal effect study. On day 30, the mice were euthanized, and the lungs were fixed in Bouin’s solution for 4 hours, followed by taking images of the lungs. Besides, the tumor metastasis sites were counted under microscopy by analyzing the surface yellow nodules. After counting, the tissues were washed with 75% alcohol for H&E staining.
Statistical analysis
All statistical analyses were performed using GraphPad Prism version 6 software. Data from the experiments were performed three times or more than three times. The results were expressed as means ± SD. A two-tailed Student’s t test was performed for statistical analysis of the difference between the two groups. P < 0.05 was considered statistically significant between the datasets, where all significant values were indicated as follows: *P < 0.05, **P < 0.01, and ***P < 0.001.
Supplementary Material
Acknowledgments
Funding: This work was financially supported by the National Key Research and Development Program of China (2017YFA0205402), the National Natural Science Foundation of China (81872817, 81573377, and 81803477), the Jiangsu Fund for Distinguished Youth (BK20170028), the Natural Science Foundation of Jiangsu Province (BK20180557), the “Double First-Class” University Project of China Pharmaceutical University (CPU2018GY07), and the Postdoctoral Innovative Talent Support Program (BX20200387). Author contributions: M.S. conceived and directed the research. Z.Z. performed the experiments and manuscript writing. H.W., A.X., and Q.Z. helped to do the in vitro and in vivo experiment. J.D. helped to do the immune experiment. R.Y. helped to draw the scheme of the manuscript. C.Q. helped to polish up the manuscript data. Competing interests: The authors declare that they have no competing interests. Data and materials availability: All data needed to evaluate the conclusions in the paper are present in the paper and/or the Supplementary Materials. Additional data related to this paper may be requested from the authors. Correspondence and requests for materials should be addressed to M.S. (msun@cpu.edu.cn).
SUPPLEMENTARY MATERIALS
Supplementary material for this article is available at http://advances.sciencemag.org/cgi/content/full/6/36/eabc4373/DC1
REFERENCES AND NOTES
- 1.Binnewies M., Roberts E. W., Kersten K., Chan V., Fearon D. F., Merad M., Coussens L. M., Gabrilovich D. I., Ostrand-Rosenberg S., Hedrick C. C., Vonderheide R. H., Pittet M. J., Jain R. K., Zou W., Howcroft T. K., Woodhouse E. C., Weinberg R. A., Krummel M. F., Understanding the tumor immune microenvironment (TIME) for effective therapy. Nat. Med. 24, 541–550 (2018). [DOI] [PMC free article] [PubMed] [Google Scholar]
- 2.Musetti S., Huang L., Nanoparticle-mediated remodeling of the tumor microenvironment to enhance immunotherapy. ACS Nano 12, 11740–11755 (2018). [DOI] [PubMed] [Google Scholar]
- 3.Gulzar A., Xu J., Wang C., He F., Yang D., Gai S., Yang P., Lin J., Jin D., Xing B., Tumour microenvironment responsive nanoconstructs for cancer theranostic. Nano Today 26, 16–56 (2019). [Google Scholar]
- 4.Gao F., Tang Y., Liu W. L., Zou M. Z., Huang C., Liu C. J., Zhang X. Z., Intra/extracellular lactic acid exhaustion for synergistic metabolic therapy and immunotherapy of tumors. Adv. Mater. 31, 1904639 (2019). [DOI] [PubMed] [Google Scholar]
- 5.Chauhan V. P., Chen I. X., Tong R., Ng M. R., Martin J. D., Naxerova K., Wu M. W., Huang P., Boucher Y., Kohane D. S., Langer R., Jain R. K., Reprogramming the microenvironment with tumor-selective angiotensin blockers enhances cancer immunotherapy. Proc. Natl. Acad. Sci. U.S.A. 116, 10674–10680 (2019). [DOI] [PMC free article] [PubMed] [Google Scholar]
- 6.Wang H., Tang Y., Fang Y., Zhang M., Wang H., He Z., Wang B., Xu Q., Huang Y., Reprogramming Tumor Immune Microenvironment (TIME) and metabolism via biomimetic targeting codelivery of Shikonin/JQ1. Nano Lett. 19, 2935–2944 (2019). [DOI] [PubMed] [Google Scholar]
- 7.Shen S., Li H.-J., Chen K.-G., Wang Y.-C., Yang X.-Z., Lian Z.-X., Du J.-Z., Wang J., Spatial targeting of tumor-associated macrophages and tumor cells with a pH-sensitive cluster nanocarrier for cancer chemoimmunotherapy. Nano Lett. 17, 3822–3829 (2017). [DOI] [PubMed] [Google Scholar]
- 8.Fu L.-H., Qi C., Lin J., Huang P., Catalytic chemistry of glucose oxidase in cancer diagnosis and treatment. Chem. Soc. Rev. 47, 6454–6472 (2018). [DOI] [PubMed] [Google Scholar]
- 9.Yang B., Chen Y., Shi J., Reactive oxygen species (ROS)-based nanomedicine. Chem. Rev. 119, 4881–4985 (2019). [DOI] [PubMed] [Google Scholar]
- 10.Fu L.-H., Qi C., Hu Y., Lin J., Huang P., Glucose oxidase-instructed multimodal synergistic cancer therapy. Adv. Mater. 31, 1808325 (2019). [DOI] [PubMed] [Google Scholar]
- 11.Nathan C., Cunningham-Bussel A., Beyond oxidative stress: An immunologist’s guide to reactive oxygen species. Nat. Rev. Immunol. 13, 349–361 (2013). [DOI] [PMC free article] [PubMed] [Google Scholar]
- 12.Wang C., Li P., Liu L., Pan H., Li H., Cai L., Ma Y., Self-adjuvanted nanovaccine for cancer immunotherapy: Role of lysosomal rupture-induced ROS in MHC class I antigen presentation. Biomaterials 79, 88–100 (2016). [DOI] [PubMed] [Google Scholar]
- 13.Castano A. P., Mroz P., Hamblin M. R., Photodynamic therapy and anti-tumour immunity. Nat. Rev. Cancer 6, 535–545 (2006). [DOI] [PMC free article] [PubMed] [Google Scholar]
- 14.Liu Y., Zhou Z., Liu Y., Li Y., Huang X., Qian C., Sun M., H2O2-activated oxidative stress amplifier capable of GSH scavenging for enhancing tumor photodynamic therapy. Biomater. Sci. 7, 5359–5368 (2019). [DOI] [PubMed] [Google Scholar]
- 15.Liu J., Wu M., Pan Y., Duan Y., Dong Z., Chao Y., Liu Z., Liu B., Biodegradable nanoscale coordination polymers for targeted tumor combination therapy with oxidative stress amplification. Adv. Funct. Mater. 30, 1908865 (2020). [Google Scholar]
- 16.Lin L. S., Song J., Song L., Ke K., Liu Y., Zhou Z., Shen Z., Li J., Yang Z., Tang W., Niu G., Yang H., Chen X., Simultaneous fenton-like ion delivery and glutathione depletion by MnO2-based nanoagent to enhance chemodynamic therapy. Angew. Chem. Int. Ed. 57, 4902–4906 (2018). [DOI] [PubMed] [Google Scholar]
- 17.Gong N., Ma X., Ye X., Zhou Q., Chen X., Tan X., Yao S., Huo S., Zhang T., Chen S., Teng X., Hu X., Yu J., Gan Y., Jiang H., Li J., Liang X., Carbon-dot-supported atomically dispersed gold as a mitochondrial oxidative stress amplifier for cancer treatment. Nat. Nanotechnol. 14, 379–387 (2019). [DOI] [PubMed] [Google Scholar]
- 18.Renoux B., Raes F., Legigan T., Péraudeau E., Eddhif B., Poinot P., Tranoy-Opalinski I., Alsarraf J., Koniev O., Kolodych S., Lerondel S., Pape A. L., Clarhaut J., Papot S., Targeting the tumour microenvironment with an enzyme-responsive drug delivery system for the efficient therapy of breast and pancreatic cancers. Chem. Sci. 8, 3427–3433 (2017). [DOI] [PMC free article] [PubMed] [Google Scholar]
- 19.Yang W., Shi X., Shi Y., Yao D., Chen S., Zhou X., Zhang B., Beyond the roles in biomimetic chemistry: An insight into the intrinsic catalytic activity of an enzyme for tumor-selective phototheranostics. ACS Nano 12, 12169–12180 (2018). [DOI] [PubMed] [Google Scholar]
- 20.Zhao Z., Fu J., Dhakal S., Johnson-Buck A., Liu M., Zhang T., Woodbury N. W., Liu Y., Walter N. G., Yan H., Nanocaged enzymes with enhanced catalytic activity and increased stability against protease digestion. Nat. Commun. 7, 10619 (2016). [DOI] [PMC free article] [PubMed] [Google Scholar]
- 21.Chen Q., Liang C., Sun X., Chen J., Yang Z., Zhao H., Feng L., Liu Z., H2O2-responsive liposomal nanoprobe for photoacoustic inflammation imaging and tumor theranostics via in vivo chromogenic assay. Proc. Natl. Acad. Sci. U.S.A. 114, 5343–5348 (2017). [DOI] [PMC free article] [PubMed] [Google Scholar]
- 22.Böhme A., Thaens D., Schramm F., Paschke A., Schüürmann G., Thiol reactivity and its impact on the ciliate toxicity of α, β-unsaturated aldehydes, ketones, and esters. Chem. Res. Toxicol. 23, 1905–1912 (2010). [DOI] [PubMed] [Google Scholar]
- 23.Dong Y., Jin Q., Zhou L., Chen J., N-heterocyclic carbene catalyzed sulfenylation of α, β-unsaturated aldehydes. Org. Lett. 18, 5708–5711 (2016). [DOI] [PubMed] [Google Scholar]
- 24.Zhou Z., Zhang Q., Yang R., Wu H., Zhang M., Qian C., Chen X., Sun M., ATP-charged nanoclusters enable intracellular protein delivery and activity modulation for cancer theranostics. iScience 23, 100872 (2020). [DOI] [PMC free article] [PubMed] [Google Scholar]
- 25.Han Y., Yin W., Li J., Zhao H., Zha Z., Ke W., Wang Y., He C., Ge Z., Intracellular glutathione-depleting polymeric micelles for cisplatin prodrug delivery to overcome cisplatin resistance of cancers. J. Control. Release 273, 30–39 (2018). [DOI] [PubMed] [Google Scholar]
- 26.Liang H., Zhou Z., Luo R., Sang M., Liu B., Sun M., Qu W., Feng F., Liu W., Tumor-specific activated photodynamic therapy with an oxidation-regulated strategy for enhancing anti-tumor efficacy. Theranostics 8, 5059–5071 (2018). [DOI] [PMC free article] [PubMed] [Google Scholar]
- 27.Bai J., Jia X., Zhen W., Cheng W., Jiang X., A facile ion-doping strategy to regulate tumor microenvironments for enhanced multimodal tumor theranostics. J. Am. Chem. Soc. 140, 106–109 (2018). [DOI] [PubMed] [Google Scholar]
- 28.Zhou Z., Li H., Wang K., Guo Q., Li C., Jiang H., Hu Y., Oupicky D., Sun M., Bioreducible cross-linked hyaluronic acid/calcium phosphate hybrid nanoparticles for specific delivery of siRNA in melanoma tumor therapy. ACS Appl. Mater. Interfaces 9, 14576–14589 (2017). [DOI] [PubMed] [Google Scholar]
- 29.Krysko D. V., Garg A. D., Kaczmarek A., Krysko O., Agostinis P., Vandenabeele P., Immunogenic cell death and DAMPs in cancer therapy. Nat. Rev. Cancer 12, 860–875 (2012). [DOI] [PubMed] [Google Scholar]
- 30.Chao Y., Liang C., Tao H., Du Y., Wu D., Dong Z., Jin Q., Chen G., Xu J., Xiao Z., Chen Q., Wang C., Chen J., Liu Z., Localized cocktail chemoimmunotherapy after in situ gelation to trigger robust systemic antitumor immune responses. Sci. Adv. 6, eaaz4204 (2020). [DOI] [PMC free article] [PubMed] [Google Scholar]
- 31.Zhou F., Feng B., Yu H., Wang D., Wang T., Ma Y., Wang S., Li Y., Tumor microenvironment-activatable prodrug vesicles for nanoenabled cancer chemoimmunotherapy combining immunogenic cell death induction and CD47 blockade. Adv. Mater. 31, 1805888 (2019). [DOI] [PubMed] [Google Scholar]
- 32.Zhang L., Wu S., Qin Y., Fan F., Zhang Z., Huang C., Ji W., Lu L., Wang C., Sun H., Leng X., Kong D., Zhu D., Targeted codelivery of an antigen and dual agonists by hybrid nanoparticles for enhanced cancer immunotherapy. Nano Lett. 19, 4237–4249 (2019). [DOI] [PubMed] [Google Scholar]
- 33.Perez C. R., Palma M. D., Engineering dendritic cell vaccines to improve cancer immunotherapy. Nat. Commun. 10, 1–10 (2019). [DOI] [PMC free article] [PubMed] [Google Scholar]
- 34.Chen W., Guo Z., Zhu Y., Qiao N., Zhang Z., Sun X., Combination of bacterial-photothermal therapy with an Anti-PD-1 peptide depot for enhanced immunity against advanced cancer. Adv. Funct. Mater. 30, 1906623 (2020). [Google Scholar]
- 35.Wang C., Wang J., Zhang X., Yu S., Wen D., Hu Q., Ye Y., Bomba H., Hu X., Liu Z., Dotti G., Gu Z., In situ formed reactive oxygen species–responsive scaffold with gemcitabine and checkpoint inhibitor for combination therapy. Sci. Transl. Med. 10, eaan3682 (2018). [DOI] [PubMed] [Google Scholar]
- 36.Li Z., Wang Y., Shen Y., Qian C., Oupicky D., Sun M., Targeting pulmonary tumor microenvironment with CXCR4-inhibiting nanocomplex to enhance anti–PD-L1 immunotherapy. Sci. Adv. 6, eeaz9240 (2020). [DOI] [PMC free article] [PubMed] [Google Scholar]
- 37.Nam J., Son S., Ochyl L. J., Kuai R., Schwendeman A., Moon J. J., Chemo-photothermal therapy combination elicits anti-tumor immunity against advanced metastatic cancer. Nat. Commun. 9, 1–13 (2018). [DOI] [PMC free article] [PubMed] [Google Scholar]
- 38.Chen G., Wang Y., Wu P., Zhou Y., Yu F., Zhu C., Li Z., Hang Y., Wang K., Li J., Sun M., Oupicky D., Reversibly stabilized polycation nanoparticles for combination treatment of early-and late-stage metastatic breast cancer. ACS Nano 12, 6620–6636 (2018). [DOI] [PubMed] [Google Scholar]
Associated Data
This section collects any data citations, data availability statements, or supplementary materials included in this article.
Supplementary Materials
Supplementary material for this article is available at http://advances.sciencemag.org/cgi/content/full/6/36/eabc4373/DC1