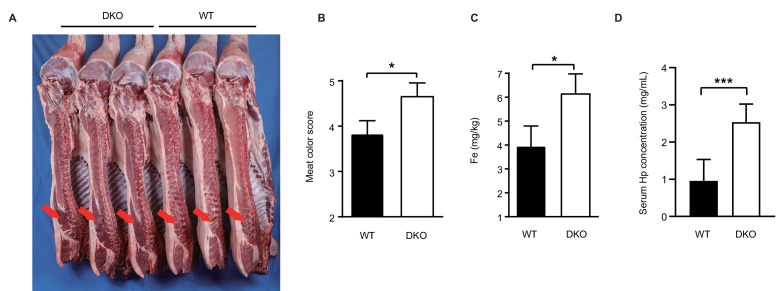
Figure 5. DKO pigs maintain normal production performance.
(A) Carcass photo of DKO and WT pigs. The meat of DKO pigs becomes darker red (red arrow). (B) Meat color scores for WT and DKO pigs. WT group: N = 3; DKO group: N = 3. (C) Detection of Fe content in longissimus dorsi muscle from both experimental groups. WT group: N = 3; DKO group: N = 3. (D) Serum Hp levels of WT and DKO pigs. WT group: N = 22; DKO group: N = 6. Data are expressed as the mean ± SD. Statistical significance was determined by Student’s t-test; ns, p>0.05; *p<0.05; **p<0.01; ***p<0.001.

