. 2020 Aug 7;9:e58223. doi: 10.7554/eLife.58223

Figure 1. GCRs recovered in uGCR strains with sae2 defects are primarily hairpin-mediated foldback inversions.

(A) Diagram of the left arm of chromosome V (chrV L) containing the uGCR assay. The normal CAN1 locus is deleted by substitution with a hisG fragment and a cassette containing the CAN1 and URA3 genes has been inserted into the YEL068C gene. Coordinates for the modified chrV L are reported as the reference genome coordinates for unmodified regions or reported as positions relative to the centromeric coordinate of the insertion site for inserted elements, for example chrV:34,339–110 is a position in the inserted hisG fragment 110 bases telomeric to the insertion site at chrV 34,339. Simultaneous selection against CAN1 and URA3 by canavanine (Can) and 5-fluoroorotic acid (5FOA) selects for GCRs that ultimately lose both CAN1 and URA3 and are stabilized by addition or capture of a telomere. (B) The relative uGCR rate for strains with mre11 or sae2 defects are displayed with error bars corresponding to the 95% confidence intervals. GCR rates are reported in Supplementary file 1. (C) The relative foldback inversion GCR rate for strains with mre11 or sae2 defects are displayed as in panel B. (D) Example read depth plot determined by WGS for chrV from a foldback inversion GCR resolved by the ura3-53/URA3 homology-mediated rearrangement. Thick-hashed arrows underneath the plot indicate the connectivity between the portions of the GCR that map to the different regions of the reference chromosome. (E) Example read depth plot for chrV and chrXIV from a foldback inversion GCR resolved by a ura3-52/YNLCTy1-1 homology-mediated rearrangement displayed as in panel D, showing the duplication of the region of chrXIV between TEL14L and YNLCTy1-1.

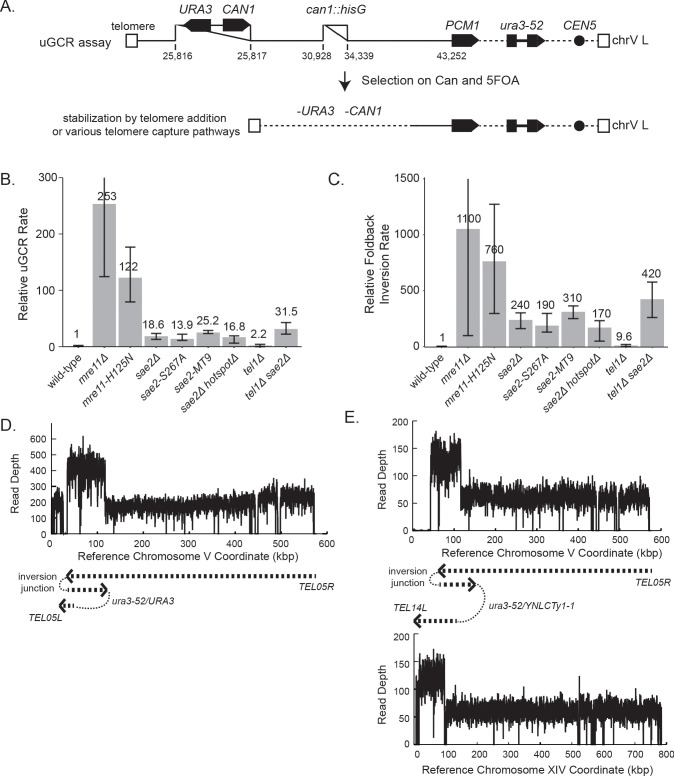
Figure 1—source data 1. Complex GCR structures.
GCR structures that are more complicated than those displayed in Figures 1D and 1E, and Figure 1—figure supplement 1 are displayed using the same scheme as those displayed in Figure 1—figure supplement 1. Panels A to U are sorted by the PGSP isolate number. The regions included in the GCR-containing chromosome are displayed using the red dashed arrow (oriented from chrV R to chrV L in the GCR-containing chromosome). The black dotted lines show the connectivity between regions included in the GCR-containing chromosome that are separate in the reference genome. Telomeres added to the chrV L side of the GCR are displayed using black boxes.

Figure 1.

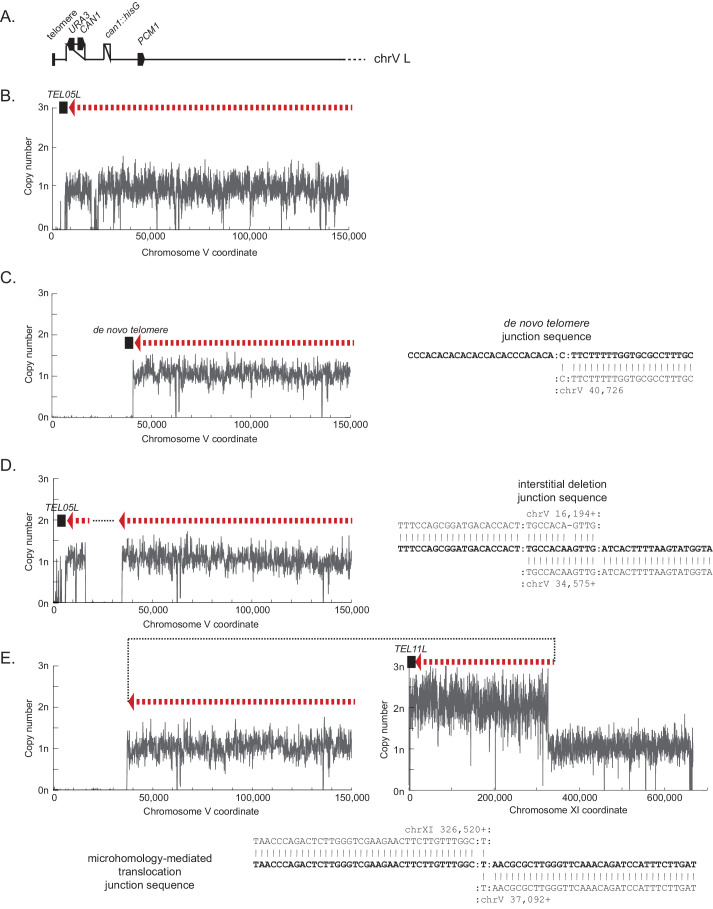
Figure 1—figure supplement 1. Example copy number plots for simple GCR structures not involving foldback inversions.

Figure 1—figure supplement 1.

The example copy number plots for the foldback inversion GCRs are displayed in Figure 1D and Figure 1E. The regions included in the GCR-containing chromosome are displayed using the red dashed arrow (oriented from chrV R to chrV L in the GCR-containing chromosome). The black dotted lines show the connectivity between regions included in the GCR-containing chromosome that are separate in the reference genome. Telomeres added to the chrV L side of the GCR are displayed using black boxes. (A) The diagram of the uGCR chrV L assay is drawn to scale for the copy number plots below. (B) The copy number plot (read depth at each base in the uniquely mapping regions of the genome divided by the median read depth of the nuclear chromosomes) for chrV L in a parental strain that has not formed a GCR. (C) The copy number plot of an example of a de novo telomere addition GCR (PGSP2215, isolated from a pif1Δ strain). (D) The copy number plot of an example of an interstitial deletion (PGSP5065, isolated from an exo1Δ yku80Δ strain). (E) The copy number plot of an example of a microhomology-mediated translocation with chrV L on left and the duplicated target (in this case chrXI) on the right (PGSP940, isolated from a sgs1Δ strain). Note that the duplication of the region of chrXI L indicates that the translocation-containing GCR is present in addition to an intact chrXI.