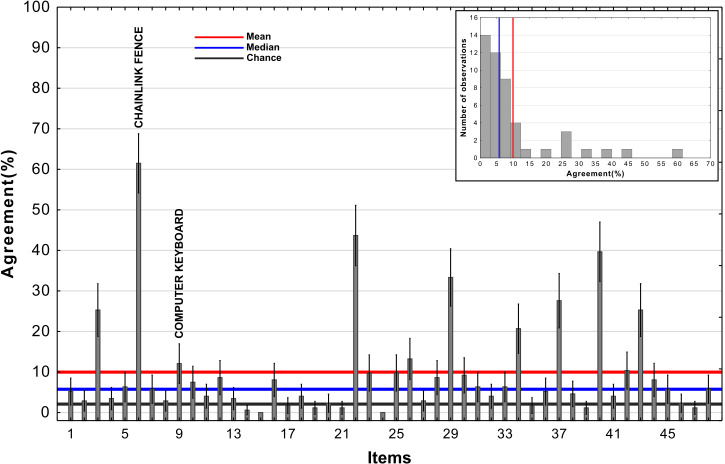
Appendix 1—figure 1. Agreement across adversarial images from Experiment 3b in Zhou and Firestone, 2019.
The red line represents the mean, the blue line represents the median, and the black reference line represents chance agreement. The inset contains a histogram of agreement levels across the 48 images.

