Abstract
The structure, morphology, and mechanical properties of two compression-molded grades of ultrahigh-molecular-weight polyethylene (UHMWPE) and, for comparison, one conventional linear polyethylene (HDPE) were studied. Compression molding resulted in some preferred orientation of lamellae in the compression direction in UHMWPE samples, while no preferred orientation in HDPE. The mean crystal thickness estimated from the size distribution agrees better with those obtained from small-angle X-ray scattering (SAXS) and mechanical yield data than the thickness determined from the melting peak temperature. Microscopic examination of microtomed and etched UHMWPE samples showed that the lamellae are in the form of platelets with the width and length in the range of 300–700 nm. The lamellae radiate from primary nuclei forming small embryonal spherulites; their radial growth ends at 0.3–0.7 μm from the center. There is no evidence of branching and secondary nucleation from those primary lamellae. Because the lamellae are radially ordered, there is no parallel stacking of lamellae. Samples were subjected to deformation by plane-strain compression at a constant true strain rate. In axial UHMWPE samples, where lamellae were preferentially oriented along the loading direction, the second yield was clearly observed. The second yield was found to be related to the deformation instability leading to kinking of lamellae oriented initially along the loading direction. Kinking was clearly shown by SAXS and microscopic observation of microtomed and etched samples. No cooperativity of kinking was observed because the lamellae are arranged in small spherulites and not parallel in stacks. The stress–strain curves were fitted with model curves assuming crystal plasticity and network elasticity in the amorphous component. The effective density of the molecular network within the amorphous phase depended on the molecular weight of UHMWPE.
1. Introduction
Ultrahigh-molecular-weight polyethylene (UHMWPE) is a well-known polyethylene grade possessing excellent mechanical properties including a high toughness, high abrasion, and wear resistances as well as excellent friction characteristics compared to any other polymer materials. Owing to that, UHMWPE has been used successfully as a bearing material in total joint replacement prostheses for over 50 years.1
Because of the high molar mass, UHMWPE cannot be processed via conventional techniques such as extrusion or injection molding. Products based on UHMWPE are manufactured mainly by machining from semifinished sheets, rods, and plates that have been obtained by sintering, compression molding, or ram extrusion of UHMWPE nascent powders. For good material performance, the powder particles should be well fused. This, however, is extremely difficult and appears to be a major problem because of low mobility of extremely long macromolecules to diffuse across grains’ interfaces during fusion. Bonding in melt-processed UHMWPE rarely reaches the stage at which all traces of grain boundaries have been completely eliminated. In high-performance applications, such as hip joint replacement, improper or insufficient fusion of the submicron size UHMWPE powder particles is, however, considered to be one of the main reasons for formation of debris that can lead further to inflammation and osteolysis, see, for example, refs (2) and (3), whereas in the knee-joint prosthesis, the grain boundaries appear to be the weak zones, leading to delamination, see, for example, ref (4).
Various ways were explored to improve the fusion of UHMWPE reactor powder grains. The most successful way was through the hexagonal phase at high pressure and temperature (annealing at 1.2 kbar and 205 °C, followed by conventional melting/recrystallization).5,6 Materials processed in this way demonstrate a much more homogeneous structure than those conventionally processed, where grain boundaries practically are no longer observed. Unfortunately, such processing was never employed on an industrial/commercial scale. Attention has also been paid to the phenomenon called “explosive melting” as it may occur during UHMWPE sintering. “Explosive melting” of polyethylene single crystals was described by Barham and Sadler7 with a brief molecular model proposed later by de Gennes.8 Explosive melting of crystals in particles of the nascent powder during their sintering was, in fact, proven by Deplancke et al.(9,10) to play a significant role in improving the fusion across grain interfaces.
Considering the difficulties encountered in achieving strong interparticle bonding in melt-processed UHMWPE, as well as in testing for properties and weaknesses, the members of IUPAC Subcommittee 4.2.1 (Structure and Properties of Commercial Polymers) initiated the present investigation. The aim was to assess the structure and mechanical properties of UHMWPE semifinished sheets, rods, or plates. Furthermore, the survey of current methods of quality assurance and quality control for UHMWPE products was of great interest. If possible, recommendation for improving both detection of defects and reducing their damaging effects in orthopedic joint implants were also desirable. This paper is the result of that initiative. The Members of the IUPAC Subcommittee who participated in UHMWPE project and during the preparation of this paper (2016–19) are listed in the Acknowledgments.
The wear performance of UHMWPE has been related also to its plastic deformation behavior, governing the rate of generation of wear particles11 in addition to the structural defects as fusion defects, mentioned above. Microscopic deformation is generally thought to be a precursor to wear on the articular surface of components.12 In acetabular components, the generation of submicron wear particles has been associated with the local accumulation of plastic strain under multiaxial loading conditions until a critical or ultimate strain has been reached.13 In tibial components, the fatigue and fracture mechanisms have been directly related to the plastic flow parameters of UHMWPE, such as the yield stress and ultimate stress. The microscopic plastic flow behavior, especially in the presence of structural defects, for example, remnants of intergrain boundaries, is considered to play an important role in the clinical performance of UHMWPE components.14
A large number of experimental studies of plastic deformation in polyethylene have been reviewed thoroughly (see, for example, refs (15−20)). Because of the complex, multilevel structure of semicrystalline polymers, their deformation appears generally also a complex and multistage process, in which both the crystalline phase and the associated amorphous phase are involved. At the microscopic level, the basic micromechanisms of deformation of crystals and the amorphous phase are considered. The mesoscopic level can include bending, rotations, translations and fragmentation or other structural rearrangements of lamellar stacks, formation of shear bands, deformation of entire spherulites, and so forth.16,17 Various deformation micromechanisms can operate together or compete with each other, affecting each other’s response.
Plastic deformation is considered as a sequence of continuous processes, involving primarily the crystallographic deformation mechanisms, like the crystallographic slip. A very important supporting role in that sequence is played by the deformation of amorphous interlamellar layers, primarily interlamellar shear, partially reversible on unloading.
The overall deformation of the assembly of crystalline lamellae and associated amorphous components has been captured by experimental studies and modeling.21−31 The overwhelming evidence accumulated is that the crystalline lamellae of PE deform plastically by the generation and motion of dislocations. The rate-controlling process is the repeated emission of dislocation from lamellar edges under stress and moving fast across the slip plane and leaving quickly the lamellae on the other side, which requires the generation to be repeated continuously.
Hence, the plastic deformation of polyethylene crystals is crystallographic in nature26,27 and takes place without destruction of the crystalline order. As a consequence, the evolution of the crystalline texture observed upon deformation is a continuous process resulting from active crystallographic slip systems, interlamellar shear, and associated crystal rotations.16,17,32 The yield point indicates the transition from elastic to plastic behavior and it is the onset of cooperative activity of the crystallographic slip mechanism.33 The yield stress is then directly related to the critical resolved shear stress of the easiest slip system active in the material. The yield stress was observed in many polymers to increase with increasing crystal thickness. This relation was studied in detail34−36 using polyethylene samples exhibiting lamellae with the thickness up to 170 nm.
It has been shown that the true stress–true strain curve provides useful information about the yielding behavior, the true rate of strain hardening, and the stress-induced transformations of crystalline texture, much better than the conventional stress–strain curve.22,25,37−39 Therefore, when characterizing the mechanical behavior of UHMWPE, especially at large deformations, it is useful to obtain the true stress–true strain data from the experiment. In addition to the shape of the true stress–true strain curve, the yielding and ultimate behavior of UHMWPE are of considerable theoretical and practical importance. They are also relevant to the theoretical development of micromechanical wear and fracture models as well as to the development of finite element models to predict accurately the multiaxial stress state, including increased equivalent von Mises stresses, in the cup of the hip or knee joint replacement (see, for example, refs (1) and (40)).
Most of the previous studies of the mechanical properties and deformation-related structural changes of semicrystalline polymers, including PE, were performed in a tensile mode, guided by obvious technological incentive to explain processes associated with orientation by drawing. However, the compression deformation seems to be more fundamental as it avoids cavitation and voiding, which are usual, yet unwanted, side effects of tensile deformation. Second, as tensile deformation is most frequently inhomogeneous (necking) determination of the true stress–true strain curve from tensile data, it is difficult and requires additional monitoring and measuring of the sample sizes during tensile experiment. In contrast, determination of the true stress–true strain curves in compression is much easier, especially almost straightforward in the plane-strain compression mode. Furthermore, in the case of UHMWPE with imperfectly fused grains, deformation by compression should be preferred because the compressive stress components mostly act on UHMWPE implants and prevent premature sample damage on poorly fused grain boundaries, which can easily happen under tension.
Therefore, the plane-strain compression was chosen as a deformation mode because of its advantages over other deformation modes, primarily its homogeneity and inhibition of any side effects, for example, cavitation. Moreover, maintaining the constant true strain rate during the test and determination of the true stress–true strain curve are relatively easy in the plane-strain compression.39,41,42
2. Experimental Section
2.1. Materials and Sample Preparation
Large batches of two grades of UHMWPE, with Mv ≈ 5 and 9 MDa and for comparison one grade of linear high density polyethylene with Mv ≈ 0.6 MDa, were prepared exclusively for this project by industrial partner Celanese Engineered Materials (formerly Ticona) using Ziegler–Natta catalysts. These grades are identified in this article by the code names UHMWPE 5, UHMWPE 9, and HDPE 06. Unless otherwise stated, all results presented in this report were obtained from tests on compression moldings made by the manufacturer under standardized processing conditions. Materials were supplied to project participants as disk plaques approx. 136 mm in diameter and 25 mm thick obtained by compression molding. The mold was filled with polymer powder and compressed to 50 bar (25 bar for the HDPE06) and heated up to 210 °C (180 °C for HDPE06) under pressure for at least 1 h. Cooling down was performed under pressure (100 bar for UHMWPEs, 50 bar for HDPE06) for at least 30 min, after which the disks were removed from the mold. These samples were prepared simply from the plain reactor powder with no additives. In that respect, these raw materials tested in this work were different from standard commercial grades of UHMWPE.
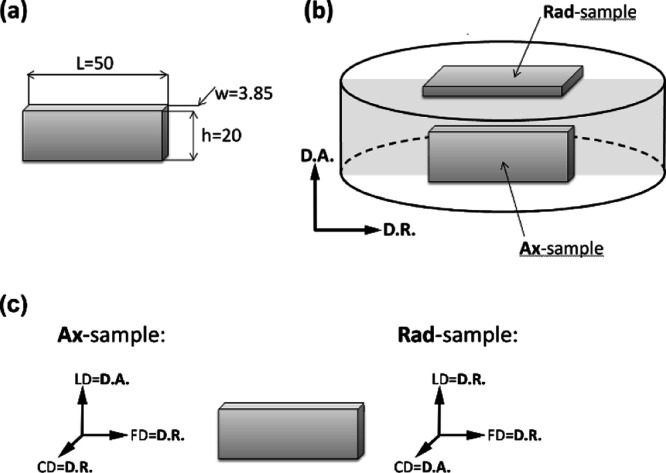
From the disks, the rectangular specimens designed for mechanical measurements—plane strain compression tests using a channel die—were machined out. Ethyl alcohol was used as a coolant of the tool and machined material in order to prevent any thermal modification of the machined surfaces. The cut specimens designed for channel die compression were 50 mm long, 20 mm high, and 3.85 mm thick. The specimen length was equal to the length of the channel of the channel-die compression fixture, while the thickness matched very tightly the width of the channel. The intended compression direction (LD) was along the sample height (20 mm). Specimens with two orientations with respect to the axis of the compression-molded cylinder were prepared: (1) LD parallel to the extrusion direction (i.e., to the cylinder axis), (2) LD along the radial direction of the cylinder, that is, perpendicular to the extrusion direction. The specimens were coded with the letters Ax (axis) and Rad (radial), respectively. Figure 1 illustrates the shape and orientation of the specimens with respect to the direction of the compression molding and intended compression in a channel-die.
Figure 1.
Samples prepared for compression experiments from compression-molded cylinders: (a) specimen dimensions (in mm); (b) orientation of Ax- and Rad-samples with respect to the cylinder axis (D.A.) and radius (D.R.) of the compression-molded cylinder; and (c) directions of the axes of two coordinate systems used in this paper, related to the material (compression-molded cylinder) and to the process (plane-strain compression) in Ax-s and Rad-samples. LD, CD, and FD denote the loading, constrained, and flow directions in a channel-die, respectively.
2.2. Characterization
2.2.1. Small-Angle X-ray Scattering
The lamellar structure of samples was probed with two-dimensional small-angle X-ray scattering (2-D SAXS). A Kiessig-type camera with a sample-to-detector distance of 1.2 m was coupled to a X-ray Cu Kα low divergence microsource, operating at 50 kV and 1 mA (sealed-tube microsource integrated with multilayer collimation optics, producing a highly collimated beam with a divergence of 0.8 × 0.8 mrad2; GeniX Cu-LD by Xenocs, France). The collimation optics was combined with two additional hybrid scatter-less slit systems (Xenocs) placed between the multilayer optics and the sample stage, forming the beam of the square cross-section. The two slit assemblies were separated by 1200 mm. The scattering produced by the sample was recorded with the Pilatus 100K solid-state area detector of the resolution of 172 × 172 μm2 (Dectris, Switzerland). One of the parameters describing the morphology of semicrystalline polymers is the so-called long period (LP). LP characterizes the parallel packing of lamellae that are interspersed with rather uniform amorphous layers, it describes the spatial periodicity of lamellar/amorphous layers’ regular packing and gives rise to a distinct X-ray scattering. The LP of nonoriented samples was determined from one-dimensional sections (background and Lorentz corrected) of 2-D patterns using Bragg’s law.
Nondeformed samples of each polymer studied were probed with 2D-SAXS in 2 orthogonal directions: with the X-ray beam along the compression-molding direction (disk axis, D.A.) and along disk radius (D.R.). For this purpose, the 1 mm thick specimens taken from the Rad- and Ax-samples were used for this experiment, respectively. The deformed samples were examined with the X-ray illumination along the constrained direction (CD).
2.2.2. Scanning Electron Microscopy
The specimens for microscopic observations were prepared by permanganic etching according to the procedure developed originally by Olley et al.(43) Typically, samples were etched for 1 h at room temperature in the mixture containing 1 wt % of KMnO4, dissolved in a 1:1 v/v mixture of concentrated sulfuric and phosphoric acid. Details of the procedure are given in.44 The etched samples, coated with 20 nm thick gold layer, were examined with a scanning electron microscope JEOL JSM-6010 LA (JEOL, Japan).
2.2.3. Differential Scanning Calorimetry
Thermal analysis of the PE samples was conducted using a differential scanning calorimeter (TA Instruments Q20 (Thermal Analysis, USA)). The melting thermograms were recorded during heating from 0 to 200 °C with a rate of 10 °C/min, under nitrogen flow. The differential scanning calorimetry (DSC) apparatus was indium calibrated. The samples were 7.1 ± 0.1 mg in weight in the form of 0.2 mm thick sections. Tightly sealed TA Instr. aluminum pans were used. The equilibrium melting temperature Tmo was determined for HDPE using the Hoffman–Weeks method on a similar DSC apparatus applying identical TA Instrument aluminum pans. Hence, the existing thermal lags in determination of melting temperatures of samples and in equilibrium melting temperature were very similar. When the undercooling is determined: Tm – Tm, these thermal lags cancel themselves. The weight crystallinity Xc was estimated on the basis of heat of melting of the sample
| 1 |
where Δhf is the heat of melting of the sample determined from the DSC melting curve and Δhf100 = 293 J/g45 is the heat of melting of 100% crystalline PE.
2.3. Compression Tests
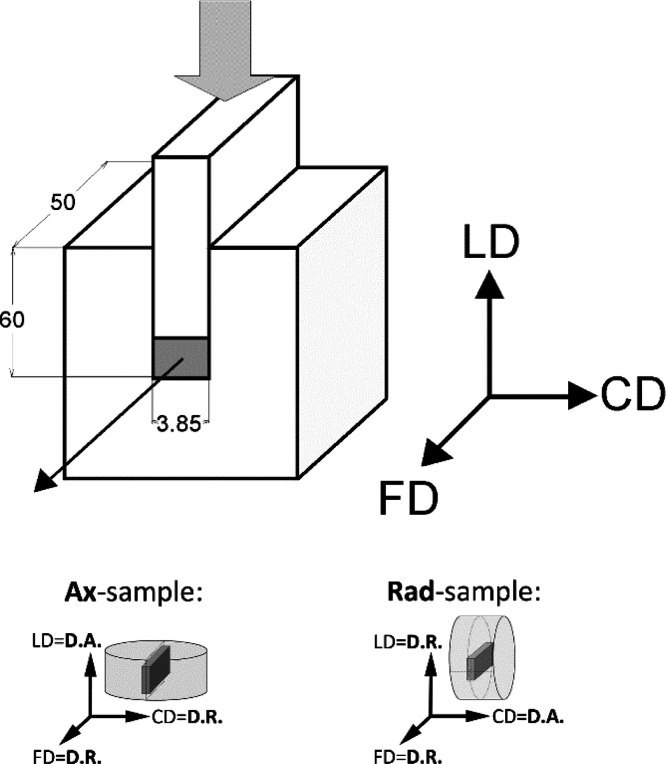
Plane-strain compression tests were performed using the loading frame of an universal tensile testing machine (Instron, model 5582, controlled by the Bluehill II software) and a compression fixture of the type of deep channel-die (channel length of 50 mm, width of 3.85 mm, and depth of 60 mm) made of steel, equipped with a LVDT transducer, mounted close to the specimen for precise strain determination. The channel-die tool is shown schematically in Figure 2. The specimen filled the full length of the channel and fitted precisely its width. Sample surfaces contacting the walls of the die and the plunger were lubricated to minimize friction. Other details are given in ref (42).
Figure 2.
Schematic drawing of the channel-die tool used for plane-strain compression. The compressed sample is marked gray. LD, CD, and FD denote the loading direction, constrained direction, and flow direction, respectively. Dimensions were given in millimeters. The sketch at the bottom illustrates the orientation of the Ax- and Rad samples with respect to the channel-die.
Deformation experiments were performed at room temperature with the constant true strain rate of ė = 0.001 s–1 controlled using the software of the testing machine (the current speed of the crosshead was adjusted continuously to the actual specimen height to maintain the constant true strain rate). The strain was determined as the true strain calculated from the reduction of the specimen height (along the loading direction) using the following equation (Hencky measure of strain)
| 2 |
where ho denotes the initial height of the specimen, h = ho – Δh represents its actual height (Δh is the measured displacement of the plunger), and λ = CR = ho/h is the compression ratio. As the area of the sample under load in a channel-die is always constant and equal to the cross-section of the plunger, the true stress was calculated from the measured force, F, and the surface area of the plunger, A.
3. Results
Thermograms of melting of the samples recorded on heating at a rate of 10 °C/min are presented in Figure 3. The melting peaks for both UHMWPEs (the maxima at ∼133.6 and ∼134.1 °C for UHMWPE 5 and UHMWPE 9, respectively) are at slightly lower temperature than the peak of HDPE 06 (Tm ∼ 136.0 °C).
Figure 3.
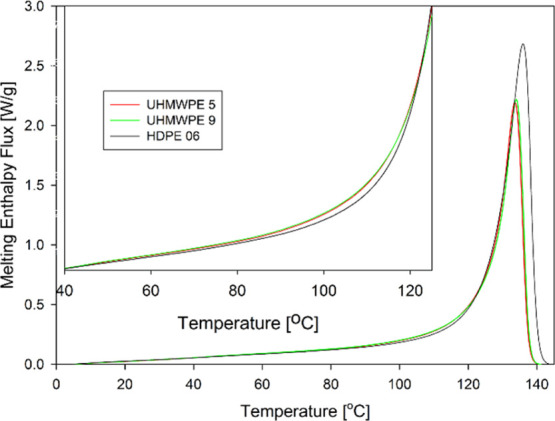
Melting thermograms of UHMWPEs and HDPE. The contribution from thermal capacities of the samples was subtracted from the DSC signal regarding the change in crystallinity degree during melting. The inset illustrates very small differences in melting enthalpy flux for all three polyethylenes in the range of melting of small crystals.
These data can indicate that HDPE is characterized by thicker crystals that melt at higher temperature than the crystals in both UHMWPEs. On the other hand, all these melting temperatures are notably higher than those usually observed in polyethylenes processed by conventional methods, for example, compression or injection molding. That is because in the compression-molding process employed here, a polymer crystallizes slowly at relatively low undercooling and can thus form thicker lamellae compared to other processing techniques.
In principle, melting data can be converted to the crystal thickness. One possibility is by using the Gibbs–Thomson approach and equation, which reflects the dependence of the surface-to-volume ratio of the crystal and presents the melting temperature as a function of the reciprocal lamellar thickness.46 This representation implicitly assumes that the lateral size of crystalline lamellae is much larger than the lamellar thickness. Therefore, a linear extrapolation to an infinitely thick lamellar crystal yields the value of Tmo.47−50 The melting temperature of lamellar crystals with lateral sizes a and b and thickness l according to the Gibbs–Thomson equation is
| 3 |
where σ is the surface free energy, σe is the end surface free energy, and Δh is the heat of fusion.51 In polymers, usually a ≫ l, b ≫ l, and σe is the surface free energy of the basal plane of crystalline lamellae, so the above equation can be written in a simpler form
| 4 |
or
| 5 |
It means that the DSC melting data can be transformed into crystal thickness using the formula 4 or 5 ascribing the heat flow to the amount of crystals melting at the momentary temperature Tm. The following data for polyethylene crystals were assumed in calculations: σe = 9 × 10⁻⁶ J/cm2,52 Δhf = 293 J/cm3,45 and Tmo = 145.1 °C.50
Usually, a single value of the crystal thickness is calculated with eq 5 substituting the measured peak maximum temperature for Tm. The obtained value of l is considered then as the average thickness, which of course, is only a crude approximation. The average thickness calculated in this way for the studied polyethylenes was: lc′ = 22.4, 23.3, and 28.1 nm, for UHMWPE 5, UHMWPE 9, and HDPE 06, respectively. However, determination of the real average value requires a more sophisticated approach. The formally correct transformation of melting enthalpy distribution into the distribution of the crystal thickness was derived by Crist and Mirabella53 as
| 6 |
where G(l) is the weight fraction of crystals having the thickness between l and l + Δl, K is the normalization constant, and P(T) is the melting enthalpy signal from DSC. The treatment has some peculiar feature that results from hyperbolic dependence of melting temperature on the crystal thickness as described by Thomson–Gibbs eq 5, for example: a fraction of crystals with the thickness between 20 and 21 nm melts in a narrow temperature interval from 132.25 to 132.86 °C, whereas a similar amount of crystals with the thickness in the range between 4 and 5 nm melts in a wide temperature interval from 80.86 to 93.71 °C. It then appears that the heat flow signal in DSC during heating with a constant rate is very low for melting of small crystals as compared to the heat flow recorded during melting of the same amount of large crystals (more than 20-folds lower!). It appears that because of this effect, the smallest crystals often escape the detection in routine DSC examination because the heat flux for melting of small crystals could be very low, at the noise level. The heating rate alteration during the scan may compensate this effect, however, it would make the DSC experiment more difficult.
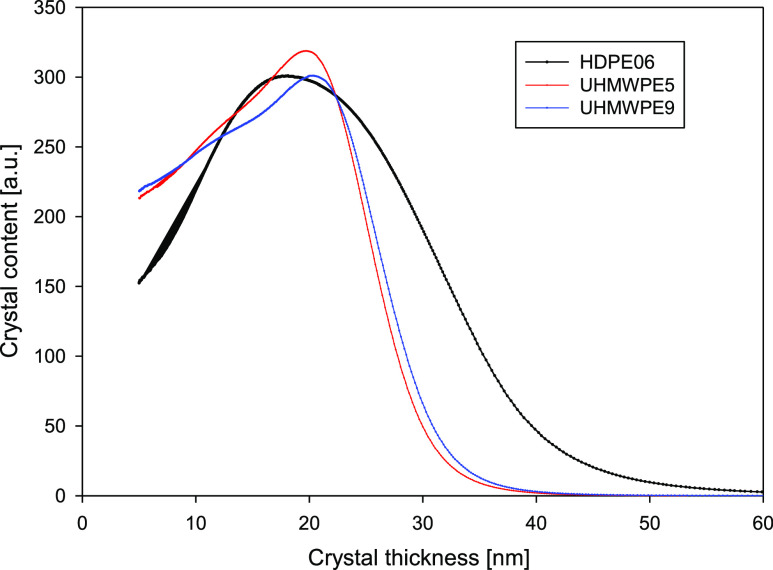
The results of recalculation of the DSC melting peak data to the distribution of the crystal thickness by means of eqs 5 and 6 are presented in Figure 4. The results for the smallest crystals are based on the very low DSC signal recorded at low temperatures (related to very low heat flux upon melting of thin crystals, as discussed above). Actually, it turned out that the fraction of crystals smaller than approx. 9–10 nm estimated using eq 6 from their melting region (Tm < 116–119 °C) appeared very sensitive to even small differences between the heat flow signal from the PE sample and the noise, which led to an irrational distribution of the crystal thickness. Therefore, on the basis of very similar melting characteristics of all samples in the low temperature range (see the inset in Figure 3), we consider that the content of crystals thinner than approx. 9–10 nm in all three polyethylenes studied here is similar.
Figure 4.
Weight distribution of the crystal thickness in UHMWPEs and HDPE as calculated from DSC melting enthalpy based on the Gibbs–Thomson approach to melting—eqs 5 and 6. The contribution from thermal capacity was subtracted from the DSC signal regarding the change in crystallinity degree during melting.
It appeared then that also in the range from 10 to 23 nm, the thickness distribution curves for all three polyethylenes were at a similar level, which demonstrates that both UHMWPEs and HDPE 06 contain very similar amounts of crystals of the thickness within that range, as can be seen in Figure 4. The distributions obtained for all samples demonstrate distinct maxima in this size range, located at 16.4 nm in HDPE 06, 19.3 nm in UHMWPE 5, and 20.1 nm in UHMWPE 9. However, the right side of the distribution, reflecting thicker crystals, is dramatically different for UHMWPEs and HDPE: HDPE shows a much broader distribution with a significantly larger fraction of lamellar crystals, 23 nm thicker than those seen in the UHMWPE samples, both of which demonstrate a similar crystal size distribution in this range. Accordingly, the mean crystal size determined from the whole distribution is significantly larger in HDPE 06—lc = 22.5 nm than in UHMWPEs: lc = 18.3 and 18.6 nm in UHMWPE 5 and UHMWPE 9, respectively.
Independent information on the crystal thickness can be obtained from SAXS. For this purpose, the LP was determined from the SAXS results. The exemplary Lorentz-corrected 1-D SAXS curves are presented in Figure 5. Each curve exhibited a clear main maximum and a very weak second maximum at the shoulder of the main peak. From the position of that main maximum, the LP was calculated using Bragg’s law, as described in the Experimental Section. The value of LP = 34.6 nm was obtained for HDPE 06, whereas LP = 40.6 nm for UHMWPE 5 and 43.6 nm for UHMWPE 9. Similar values of LP were obtained from the electron density correlation functions, which were calculated from the data of Figure 5. The average thickness of amorphous layers la can be determined from the mean lamellae thickness lc and the linear crystallinity X1, obtained from the DSC-based weight crystallinity Xc as described using eqs 7 and 8
| 7 |
where
| 8 |
Figure 5.
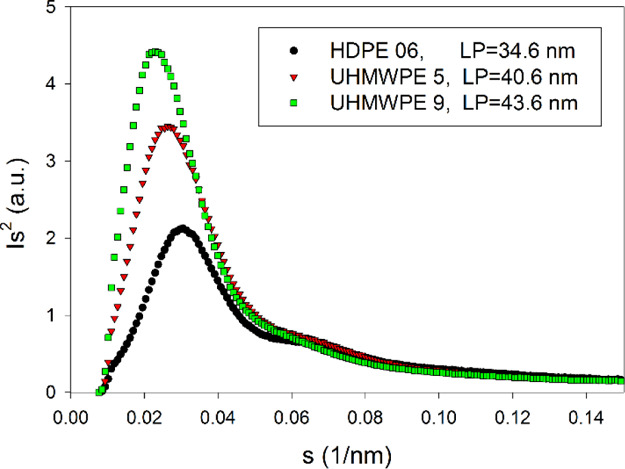
Lorentz-corrected 1-D SAXS profiles derived from the linear sections of 2-D images of HDPE and UHMWPE nondeformed samples, sliced perpendicular to the D.A. and illuminated with X-ray along the axial direction.
The density of PE crystals ρc = 1.0 g/cm354 and density of amorphous phase ρa = 0.855 g/cm355 were assumed in calculations. Similar calculations were carried out using the lamellar thickness estimated from the position of the maximum of the melting peak lc′ instead of lc to obtain another estimate of amorphous thickness la. The sum of lc + la or lc′ + la gave two estimates of the LPDSC for every material studied, which could be compared with LP derived from SAXS. Table 1 summarizes the obtained results. It can be seen that LPDSC = lc + la, estimated from the DSC data using the mean lamellar thickness (column 6), matches well the LP values determined from the SAXS data (column 8). The agreement is much better than that of lc′ + la and LP (columns 7 and 8, respectively), where the thickness lc′ was obtained from conventional estimation based on the melting peak value. On this basis, it can be concluded that the mean crystal thickness obtained from the crystal thickness distribution should be used here rather than the crystal thickness estimated merely from the melting peak. The second, weak maximum in SAXS curves can be seen at s around 0.061–0.066 nm–1, thus it is not the second order of the first peak (s = 0.023–0.029 nm–1). This corresponds to the periodicity of 14.9–16.4 nm. Perhaps, it reflects a small fraction of thinner lamellae, which probably were formed at a late stage of cooling the compression-molded disk, already taken out of the mold.
Table 1. Structural Parameters Derived from the DSC and SAXS Data for UHMWPE and HDPE Samplesa.
| sample | heat of melting [J/g] | DSC weight crystallinity, Xc [%] | DSC mean crystal thickness lcb, [nm] | crystal thickness estimated from the melting <keep-together>peak—lc′c [nm]</keep-together> | lc + la[nm]d | <keep-together>lc′ + la</keep-together> [nm]d | long period from SAXS [nm] |
|---|---|---|---|---|---|---|---|
| HDPE 06 | 194.2 | 66.3 | 22.46 | 28.14 | 35.81 | 44.84 | 34.6 |
| UHMWPE 5 | 153.9 | 52.5 | 18.27 | 22.4 | 37.6 | 46.1 | 40.6 |
| UHMWPE 9 | 154.3 | 52.7 | 18.61 | 23.34 | 38.14 | 47.8 | 43.6 |
Mean crystal thickness obtained from the crystal thickness distributions in Figure 4, amorphous layer thickness calculated from the crystallinity degree and the crystal thickness. Assuming PE crystal density 1.0 g/cm354 and density of the PE amorphous phase 0.855 g/cm3.55 LP determined from the SAXS images in Figure 5.
The orientation of the lamellar crystals of all three materials was probed with 2-D SAXS in two perpendicular directions, along the cylinder axis or along its radius. This was done using the Ax- and Rad-samples sliced along the plane perpendicular to the D.A. or to the D.R., respectively, as shown in Figure 1. Figure 6 presents the 2-D SAXS images of these samples obtained in axial and radial illumination. It can be observed that the HDPE 06 sample shows a nearly identical uniform circular pattern under both sample illuminations, which indicates the lack of any preferred orientation of lamellae in this material. In contrast, both UHMWPE samples exhibit a significant fraction of oriented lamellae stacks with individual lamellae preferentially oriented with their planes parallel to the axis of the compression-molded cylinder (D.A.), which is manifested in a two-point SAXS pattern when the Ax-sample is viewed perpendicularly to D.A. The UHMWPE 9 sample displays a similar lamellar orientation, even slightly sharper than UHMWPE 5. SAXS patterns obtained for axial illumination of both UHMWPEs (Rad-samples cut out in the plane normal to the D.A. direction and viewed along this axis) have a form of uniform ring, which indicates that there is no preferred lamellae orientation parallel to D.A. in both UHMWPE materials studied, similar to HDPE 06.
Figure 6.
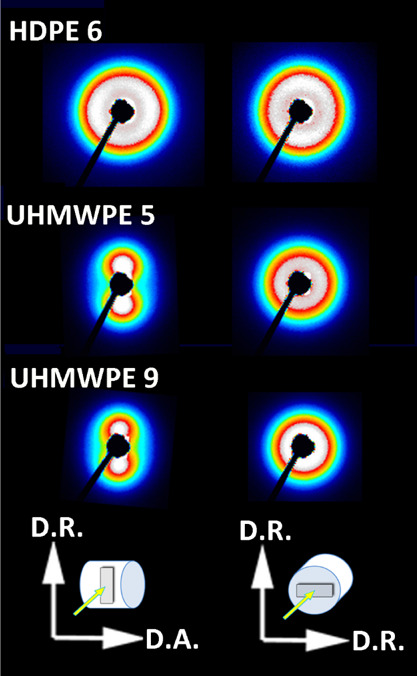
2-D SAXS patterns of HDPE 06, UHMWPE 5, and UHMWPE 9 samples obtained for illumination with the X-ray beam along the D.R. direction (Ax-samples) and along D.A. (Rad-sample). The coordinates shown at the bottom indicate the orientation of the examined specimens with respect to the compression-molded cylinder and the X-ray beam.
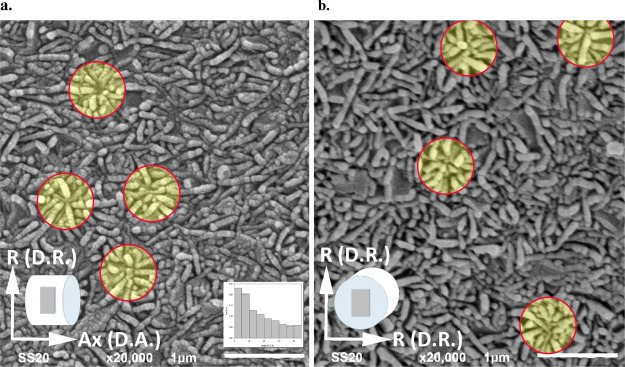
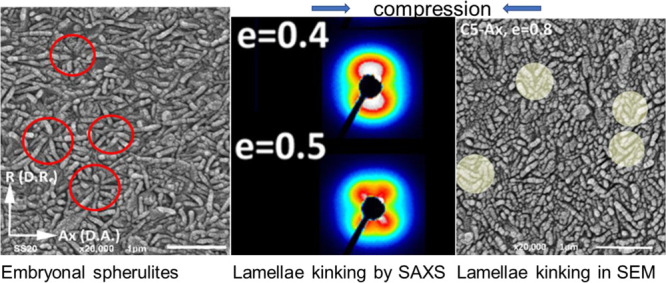
Figure 7a,b shows exemplary SEM micrographs of the UHMWPE 5 sample observed along D.R. and D.A. directions, respectively. There are several important facts that can be noticed: (i) the main features are lamellae, (ii) the width and the length of lamellae are in the range of 300–700 nm, lamellae are only a few times (from 3 to 7 times) wider than their mean thickness and a few times longer than their thickness, as it can be judged from two perpendicular sections shown in Figure 7a,b. It must be remembered that the lamellae were oriented accidentally onto the cutting planes; hence, the lamellae thickness seen in Figure 7 is just projections on the cutting planes. (iii) The prevailing impression is that the lamellae have the form of platelets, not tapes and not fibrils, (iv) there is no well recognizable supermolecular structure such as spherulitic, instead some embryonal stages of spherulite growth can be observed, that is, a nucleation of few lamellae and their radial growth. The radial growth ends in 0.3–0.7 μm. The most striking observation is that there is no evidence of branching and secondary nucleation from these primary lamellae. Several examples of such embryonal spherulites are encircled in Figure 7a,b. The positions of embryonal spherulites are accidental with respect to the cutting plane, so most of them are cut through their periphery. (vi) Lamellae are not packed in parallel stacks but loosely and randomly arranged and (vii) lamellae seen in Figure 7a demonstrate some preferred orientation along the D.A. direction (lamella normals parallel to D.R.), while those seen in Figure 7b are oriented more randomly. That last observations agree with the preferred orientation parallel to the axial direction, deduced from the SAXS patterns.
Figure 7.
SEM images of UHMWPE 5 observed in the plane perpendicular to the D.R. (a) and the plane perpendicular to the D.A. (b). Sample surfaces prepared by microtoming and etched with the permanganic etchant to reveal the crystal shape and packing. Exemplary embryonic spherulites are indicated with red/yellow circles. Inset in the right-lower corner of the micrograph (a) illustrates the distribution of lamellae orientation with respect to the D.A. direction in this micrograph.
Because lamellae are not arranged in parallel stacks, the determination of LP from SAXS is not justified. It may lead to incorrect values of lamellae thickness and the crystallinity degree.
Primary nucleation is involved in crystallization, however, the lamellae are not able to grow beyond 300–700 nm in width and length, which follow probably from a very high molecular weight and very high viscosity.
Because of the preferred lamellar orientation observed in UHMWPEs, the mechanical behavior was tested in plane strain compression in both radial (D.R.) and axial (D.A.) directions using the Rad- and Ax-samples (cf.Figure 1). Samples (Ax- and Rad-) of the studied polymers were subjected to deformation up to high strains (e ≈ 1.6, corresponding to the compression ratio λ ≈ 5) at room temperature using a channel-die. The constant true strain rate of ė = 0.001 s–1 was employed in all experiments. Figure 8 presents the exemplary true stress–true strain curves determined from the experimental load–displacement data. All curves show a similar shape, typical for a semi-crystalline polymer in plane-strain compression, with yielding, plastic flow, and very distinct strain-hardening stage leading to very high stress, reaching 400 MPa or higher, before failure. A decrease in the yield stress, an increase of the slope in the strain-hardening region, and the shift of the onset of strain hardening toward lower strains are observed for increasing molecular weights of polyethylenes: HDPE 06, UHMWPE 5, and UHMWPE 9, respectively.
Figure 8.
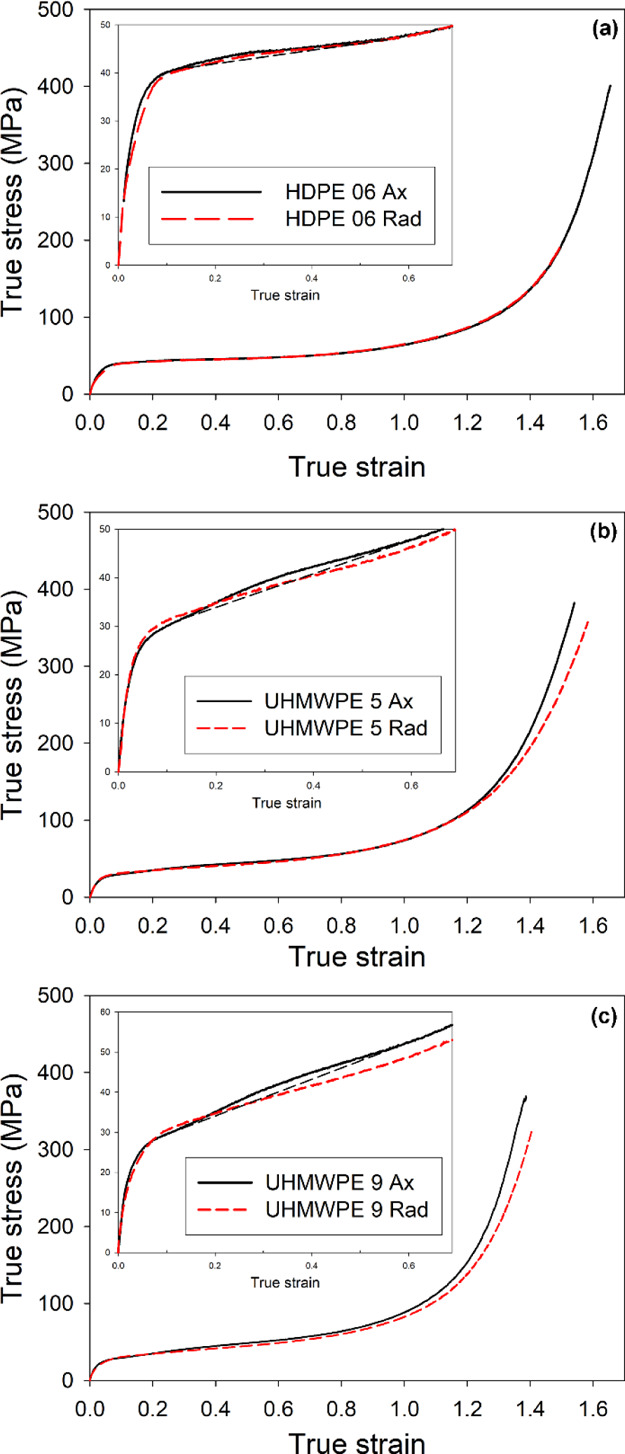
True stress–true strain curves obtained by plane strain compression with the constant true compression rate of 6%/min at room temperature, compression along the D.A. (black curve) and along the D.R. (red curve) directions: (a) HDPE 06, (b) UHMWPE 5, and (c) UHMWPE 9. The insets present the initial part of the curves with elastic and yielding regions. The black-dashed lines were drawn in the inset to help to identify the humps related to the second yield in the stress–strain curves of the Ax-samples.
The Rad- and Ax-samples of HDPE 06, loaded along D.R. and D.A., respectively, practically do not show any difference in the mechanical response at any stage of the deformation (Figure 8a), which reflects the lack of orientation in this material. In contrast, some slight differences in the mechanical response of Rad- and Ax-samples can be seen in both UHMWPE grades. These differences can be observed in the range of low strains, near and above the yield point (see the insets in Figure 8a–c presenting enlarged initial parts of the stress–strain curves), as well as in the range of the highest strains, that is, in a very advanced stage of strain hardening.
The yield point was estimated using the 2% offset method because the compression true stress–true strain curves do not show any maximum in the yielding range. The yield stress of HDPE was found to be higher than that of both UHMWPE materials, whereas it appeared practically independent of the orientation of the specimen. This behavior can be understood easily because the yield point represents the activation of the crystallographic slip mechanisms, controlled by the properties of the crystalline phase, primarily lamellae thickness,34,35 which is notably smaller in UHMWPE than in HDPE of much lower molecular weight, cf.Table 1.
Additional feature was observed in the stress–strain curves just above the yield point, especially in the axial samples. It was a small hump (or a very low and broad local maximum), centered around e ≈ 0.3—see enlarged curves, displayed in the insets of Figure 8a–c. Such a hump is usually referred to as the “second yield”. Several semicrystalline polymers, including polyethylene, frequently display the double-yielding phenomenon, in which two apparent yield points are observed in the stress–strain curves.56−62 For UHMWPE samples, such a hump is well seen in the Ax-samples of UHMWPE 5 and UHMWPE 9, while it can be hardly discerned in curves of UHMWPE 5 Rad and UHMWPE 9 Rad. As can be seen in Figure 8a, a very low hump indicating the second yield can also be recognized in the curves of HDPE 06 (similar in both Ax- and Rad-samples).
The presence of the second yield can be visualized better when plotting the stress–strain data in coordinates that follow from the neo-Hookean solid deformed under the plane-strain conditions (Gaussian equation)63,64
| 9 |
where σ is the true stress in the direction of loading, Y is the plastic flow stress of the crystalline phase, Gn is the strain-hardening modulus, and λ is the compression ratio. Such a presentation follows from the approximation of the plastic response of the crystalline phase and from the amorphous material with a network of Gaussian chains subjected to deformation. The Gaussian approximation of chains holds at relatively low strains, roughly up to λ ≈ 2.64Equation 9 implies a linear increase of stress with increasing deformation (expressed by λ2 – 1/λ2) due to network stretching. Figure 9a presents the true stress data of samples compressed in a channel die along D.A. replotted from Figure 8 versus λ2 – 1/λ2. In the range of (λ2 – 1/λ2) < 3, the stress–strain curves can be approximated with three straight line segments: first representing the Hookean range and two others illustrating the postyield and strain hardening. The bulge on the slope observed at the end of the postyield range is a local maximum on the true stress–true strain curves and can be interpreted as a mark of the second yield. The strain hardening observed beyond the second yield is related mainly to the response of the molecular network. It is clearly seen in Figure 9a that all Ax-samples (HDPE, UHMWPE) exhibit double yielding. The second yield is indicated for each sample in Figure 9a with arrows. A similar plot constructed for Rad-samples compressed along D.R. is shown in Figure 9b. The curves representing UHMWPE 5 Rad and UHMWPE 9 Rad do not show double yielding, while in the curve constructed for the HDPE 6 Rad sample, a second yield point can be poorly recognized. The values of stresses and strains related to the main and the second yield, determined from the true stress versus λ2 – 1/λ2, are listed in Table 2.
Figure 9.
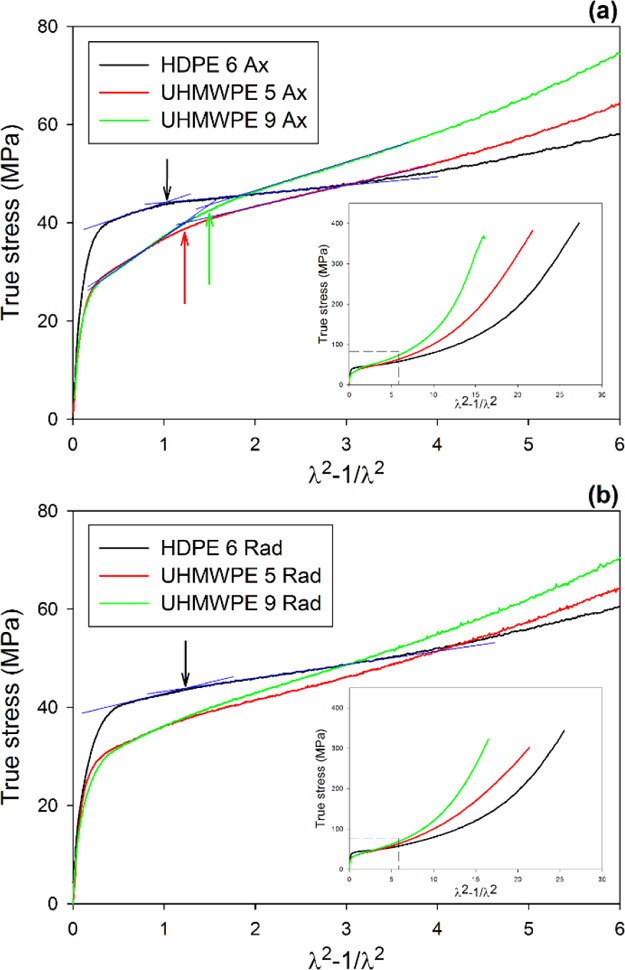
True stress plotted as a function of λ2 – 1/λ2 for Ax-samples loaded along D.A. (a) and Rad-samples loaded along D.R. (b). Arrows indicate the second yield point. Insets show the same curves in the full range of deformation.
Table 2. True Stress and True Strain Determined for the First and Second Yield Point for Ax- and Rad-Samples Compressed along the Direction of Compression Molding (D.A.) or Perpendicular to It (D.R.)a.
| sample | σy1 (MPa) | ey1 | σy2 (MPa) | ey2 |
|---|---|---|---|---|
| Ax-Samples, Compressed along the Direction of Compression Molding (D.A.) | ||||
| HDPE 06 | 34.2 | 0.046 | 44.0 | 0.24 |
| UHMWPE 5 | 25.5 | 0.048 | 41.8 | 0.31 |
| UHMWPE 9 | 24.6 | 0.042 | 42.2 | 0.34 |
| Rad-Samples, Compressed Perpendicularly to the Direction of Compression Molding, along D.R. | ||||
| HDPE 06 | 29.4 | 0.042 | 43.5 | ∼0.28 |
| UHMWPE 5 | 27.1 | 0.050 | ||
| UHMWPE 9 | 22.9 | 0.042 | ||
It is well known that the main (first) yield point is associated with the initiation of plastic deformation of polymer crystalline lamellae, primarily by crystallographic slips, for example.65,66 It was also found that thicker crystals require higher stress to activate slip.34,35,67 As it can be seen from Table 2, the yield stress of HDPE is higher than the yield stress of UHMWPEs. It is caused precisely by significantly thicker lamellae of HDPE than those of UHMWPEs (cf.Table 1).
In most cases, the second yield is observed in an engineering stress–strain curve as a broad hump or a shoulder occurring at strain above the main yield point56−61 or as a clear change of the slope in a true stress–true strain curve.62 Apparently, there is no common simple cause of the phenomenon of the second yield as it occurs at various deformation modes and depends on various parameters.
Below, we list the proposed explanations of double yielding:
-
(1)
In 1995, when the crystallographic slip mechanisms were yet not obvious for yielding, the double yielding was explained as a two-step “mechanical melting”.68
-
(2)
Second yield associated with neck development,60
-
(3)
Dependent on crystallinity and appears at a lower stretching rate,59
-
(4)
First yield occurs at low strain and marks the onset of temporary plastic deformation, the second yield occurs at higher strains, marks the onset of permanent plastic deformation, and is associated with the development of a neck in tension and is attributed to the smaller size and the narrower distribution of the crystallites,58
-
(5)
Double yielding occurs regardless of the crystallinity level, chain folding may play a primary role,57
-
(6)
Second yield is less pronounced for higher crystallinity and is not only associated with crystalline regions,61
-
(7)
Second yield is attributed to the activation of a so-called “coarse” chain slip of lamellar crystals.62,69−73 However, it was demonstrated by others39,74 that the block slip leading to fragmentation and destruction of lamellae sets in at much higher strains, above e = 1.0.
-
(8)
Second yield can be a signature of the activation of the transverse slip (showing higher critical stress than the chain slip, activated in primary yield).25,75
Lamellae in both nondeformed UHMWPE samples demonstrate the preferred orientation parallel to the D.A. It is clearly shown by the SAXS and SEM data presented in Figures 6 and 7. Such much less-pronounced orientation of lamellae exists in the HDPE 6 sample. Based on these observations, we suggest that the second yield observed in compression of the samples along the D.A. is connected with distinct orientation of lamellae along that axis and is associated with the deformation instability involving microbuckling of lamellae. Such an orientation parallel to the compression direction may lead to cooperative folding or angular kinking of those lamellae. Kinking and formation of a chevron-like lamellar morphology was observed in deformed polyethylene44,76,77 as well as in other semicrystalline polymers, like iPP, POM, or iPS,78−80 deformed either in compression or tension. At that time, however, it was not associated with double yielding. Recently,81,82 we demonstrated that for lamellae arranged in stacks (HDPE and cross-linked HDPE), the second yield phenomenon can be directly related to the microbuckling instability. This instability, leading to cooperative kinking of the stacked lamellae, facilitated the initiation of further deformation. Prior to kinking, the lamellae could not deform more by the crystallographic slip because of very low-resolved shear stress in the plane and direction of a potential slip. A significant change of orientation within kinks results in increasing shear stress in the slip planes, and consequently in crystallographic slips in the kinked lamellae. The rapid extension of slip activity to a new fraction of lamellae showed up macroscopically as the second yield point.
Buckling instability is a general phenomenon observed in systems consisting alternating hard and soft layers on very different length scales, ranging from nanometers (liquid crystals, polymers) to kilometers (geological structures).83,84 It originates from very different stiffness of the hard- and soft-stacked parallel layers and a strong coupling between them. It allows the system to deform in a way that minimizes energy—the change in free energy associated with buckling of hard layers turns out to be lower than the dilatation of highly constrained soft layers.83 Our studies demonstrated that the lamellae microbuckling observed at relatively low deformation is controlled by the stiffness ratio of amorphous and crystalline layers, which is consistent with theoretical models and results obtained for other layered materials.81,82
The above considerations were based on the observation and assumption that the lamellae are parallel and packed in stacks. However, the UHMWPE crystalline structure is characterized by nonparallel arrangement of lamellae (see Figure 7a,b and the discussion that follows). In addition, the lamellae of UHMWPE are not long and wide, unlike lamellae of HDPE, having sizes in these dimensions no more than 0.3–0.7 μm.
In order to confirm the occurrence of microbuckling and kinking during deformation and the correlation with the second yield point, the 2D-SAXS and microscopic observations were carried out for the UHMWPE 05 deformed samples. Figure 10 presents the 2D-SAXS patterns collected for the UHMWPE 5 Ax (showing double yield) and UHMWPE 5 Rad (no double yield observed) samples compressed to various true strains in the range of e = 0.2–1.6. If microbuckling takes place during deformation, it should manifest stronger in Ax-samples than in Rad-samples because of a larger number of lamellae oriented along the loading direction (lamellae are oriented preferentially parallel to LD in the Ax-samples, while are oriented randomly with respect to LD in the Rad-sample, cf.Figures 6 and 7). Figure 10 shows that the SAXS patterns of the Ax-sample with lamellae oriented along the compression direction exhibit an abrupt and significant reorientation of lamellae, reflected in the four-point SAXS pattern at around e = 0.4. Such a behavior is a direct consequence of lamellae buckling and subsequent formation of kinks. Once the four-point pattern develops, it evolves with a further increase in strain in a similar fashion in both Ax- and Rad samples. The developed four-point pattern maxima indicate a decreasing fraction of lamellae oriented parallel to the loading direction and increasing number of lamellae in inclined orientation. Such abrupt generation of inclined lamellae is not observed for the Rad-sample during compression at e = 0.4.
Figure 10.
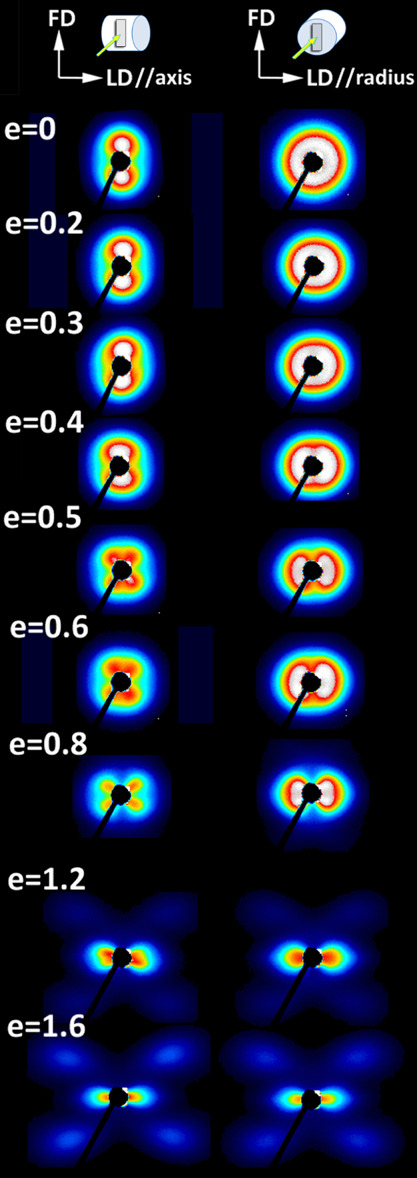
SAXS patterns recorded for the UHMWPE 5 sample compressed in a channel die to true strains indicated. Samples for deformation were machined from the compression-molded cylinder in the way to compress them along the cylinder axis (Ax-samples, patterns shown in the left row) or the cylinder radius (Rad-samples, patterns shown in the right row) as illustrated in the top of the graph. Samples deformed to a specified strain were examined with SAXS after unloading, in the relaxed state.
Usually, a characteristic parameter, an “LP” can be determined from the SAXS patterns. In the view of the results presented in Figure 7a,b and the discussion that follows, such an “LP” would not necessarily have the same meaning as for other polymers exhibiting regular stacking of wide and long lamellae. However, we used it here as another indication of microbuckling. Figure 11 evidences the increase of the “LP” in the FD direction (Figure 11), that is, for lamellae oriented along LD that are predisposed to buckling in channel die compression. At low strains, e < 0.4, this LP increases markedly in both Ax- and Rad-samples, which indicates the lamellae separation mechanism, while above e = 0.4, it stabilizes at almost constant value while the deformation increases. The “LP” observed in other directions (illustrated in Figure 11 by LP measured along LD) changes very little with strain. Such a behavior is consistent with postulated microbuckling of lamellae oriented parallel to LD, followed by the formation of kinks, all occurring between e = 0.3 and e = 0.4. The critical strain e ≈ 0.4 is close to the strain at the second yield determined from the stress–strain curves, ey2 = 0.31.
Figure 11.
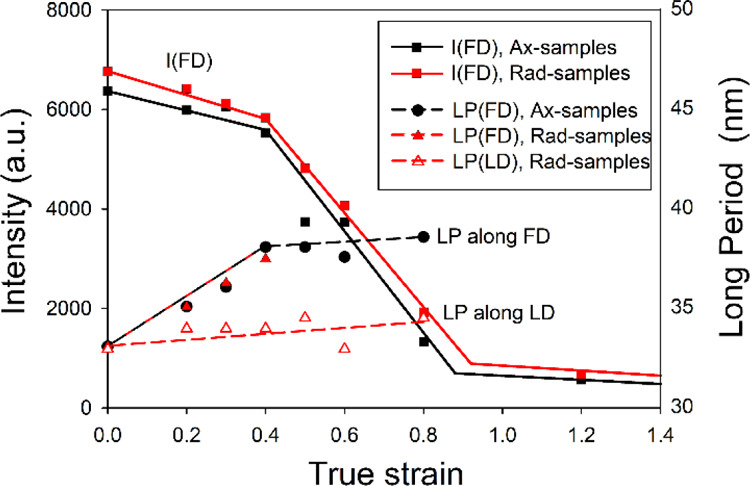
Intensity of scattering observed along FD in Ax- and Rad-UHMWPE-5 samples (solid lines) and “LP” along FD and LD in the same samples (dashed lines), derived from 2D-SAXS patterns of Figure 10.
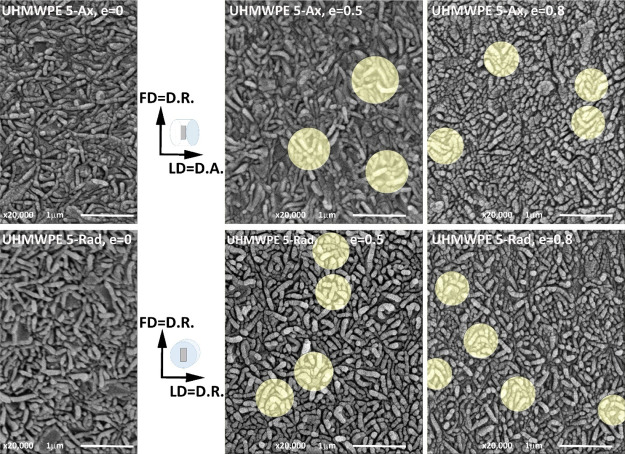
Microscopic observations of the deformed samples with SEM give further evidence of kinking. Figure 12 shows SEM micrographs of the samples deformed to e = 0.5 and e = 0.8 observed in the LD-FD plane. In both Ax- and Rad-samples, the lamellae kinks can be recognized, which are marked with circles. In addition, the length (and width) of lamellae visible on cross-sections for e = 0.5 are roughly half of those visible on micrographs in the first column of undeformed materials (also in Figure 7a,b) indicating the extensive kinking. For the samples deformed to e = 0.8, the length of lamellae is even less than half of undeformed lamellae.
Figure 12.
SEM micrographs of the LD-FD plane of the UHMWPE 5-Ax sample (upper row) and the UHMWPE 5-Rad sample (bottom row), undeformed (left column) and deformed to e = 0.5 (center column) and to e = 0.8 (right column). The observation plane was exposed by microtoming followed by permanganic etching. Exemplary lamellar kinks are highlighted by bright circles.
Kinking causes a quick and dramatic change of orientation of fragments of lamellae and a partial collapse of a rigid skeleton formed by lamellae. In addition, lamellae are likely to break at sharp tips of advanced kink hinges, which contributes to a very limited lamella fragmentation. In SEM images of Figure 12, it is well seen that the lamellae are shattered. Fragmentation of lamellae could also be emphasized on SEM images from Figure 12 by slight over etching with the permanganic etchant. This quick and rapid change of orientation is very important for further deformation.
The experimental evidence provided by SAXS and SEM fully supports the hypothesis that the second yield is associated with microbuckling instability, resulting in the formation of lamella kinks and significant reorientation of these lamellae. All these experimental data indicate that arrangement of lamellae into stacks is not necessary for microbuckling. Sufficient is the arrangement into small embryonal spherulites with radiating short lamellae that do not show secondary nucleation. In UHMWPE, the second yield is better marked on the stress–strain curves of Ax- than Rad-samples, because the fraction of lamella stacks oriented favorably for buckling is clearly higher in the Ax-than in the Rad-samples because of the preferred orientation. For the HDPE 06 material, the preferred lamellar orientation is nearly absent, therefore, both the Ax- and Rad-samples show a similar mechanical response including limited microbuckling, which is manifested as similar low humps of the second yield in the stress–strain curves.
As mentioned earlier in this section, the studied samples differ also in the strain-hardening behavior—a systematic increase of the slope of the curve in the strain-hardening region and the shift of the onset of strain hardening toward lower strains with increasing molecular weight of the polymer are observed—cf.Figure 8. There is also a slight difference between the Ax- and Rad-samples of both UHMWPE 5 and 9 at the final stage of strain hardening. The strain hardening is controlled primarily by the properties of the molecular network of entangled chains in the amorphous phase, including the density of entanglements, and its response to strain.85,86 Accordingly, the network density can be estimated from the stress–strain data through comparison of the experimental stress–strain data with the results of model calculations. Long time ago, Haward and Thackray85 suggested that the deformation of a polymer can be modeled using a simple constitutive model derived from the theory of rubber elasticity, even if employed in the simplest Gaussian form. They hypothesized that strain hardening originates from stretching of the molecular entanglement network, which is represented in the model by the nonlinear spring element. Strain hardening is then represented by the single strain-hardening coefficient Gn. Models based on Haward’s hypothesis were successfully applied to model the stress–strain behavior of several amorphous or semicrystalline polymers,23,64,85−88 therefore, we decided to use this concept to model experimental curves here. For the purpose of this work, the previously developed model,64 using non-Gaussian chain statistics and the 8-chain model of Arruda and Boyce,89 was used. Because the primary interest was in the response of the molecular network, several simplifying assumptions were done, including the reduction of the viscoplastic response to purely plastic, neglecting the dependence on the strain rate and temperature as well as phenomenon of molecular relaxation.64 These simplifications lead to some systematic overestimation of the network density.90 To account these effects and obtain more precise estimation of the network, the viscous contribution to the stress should be subtracted from the stress41,90 and/or more sophisticated models should be applied.91 The model equation used here for the stress in the direction of loading (plane-strain compression) was defined earlier in refs (42) and (64) and has the form
| 10 |
where Y is the plastic
flow stress and Ne is the effective molecular
network cross-link density, n is the average number
of “rigid links” between these cross-links providing
limiting extensibility of a chain (λmax = n1/2), and λchain is the stretch
on each chain in the 8-chain cell representing a network; for the
plane-strain compression λchain = (1/3 (λ2 + 1 + 1/λ2))1/2, where λ
= ho/h is the compression
ratio. The quantity NekT is equivalent to the strain-hardening modulus of the network, Gn.  denotes the
inverse Langevin function (
 ; where x = λchain/n1/2). Note
that for large values of n, eq 10 reduces to the Gaussian eq 9.
Equation 10 was used to fit the experimental true stress–true strain curves shown in Figure 8. They were fitted in the strain-hardening range of e = 0.35–1.4 (i.e., above the second yield, which was observed at e = 0.24–0.34). The parameters of the fit were a flow stress Y, the effective cross-link density Ne, and the number of rigid links between entanglements n. In addition, fitting with the Gaussian model given by eq 9 was performed in the range of low strain, where Gaussian chain statistics can be applied. In Figure 13, the obtained non-Gaussian fits are compared with experimental curves of the Ax-samples. Very good agreement can be observed in a wide range of strain, up to e ≈ 1.3 (λ ≈ 3.7). For higher strains, the experimental curves show a lower slope than these calculated, which can be related to viscous and relaxation phenomena neglected in the model as well as to partial destruction of the network.90 Very similar results were obtained also for Rad-samples, with only a slightly higher deviation observed at the highest strains.
Figure 13.
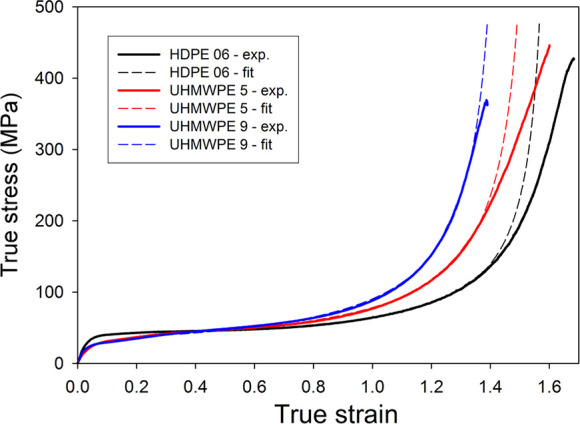
True stress–true strain curves obtained in plane-strain compression with the constant true compression rate of 6%/min at room temperature, compression along the cylinder axis. Dotted curves represent 8-chain fitting as described above.
The results obtained from the best fits of experimental curves using Gaussian and non-Gaussian modeling, carried out in the range of e = 0.35–0.7 and 0.35–1.4, respectively, are presented in Table 3. It can be seen that fitting the stress–strain curve in the range of early strain hardening using a simple Gaussian model results in values of the strain-hardening modulus similar to those obtained using the non-Gaussian model applied in a much wider strain range. The effective network density Ne, calculated from the strain-hardening modulus and related to concentration of entanglements in the amorphous phase, increases, while the limiting stretch of the network λmax decreases with increasing molecular weight of the polymer. Although the obtained values can be slightly overestimated due to model simplicity, they still seem to be reasonable when compared with the entanglement density reported for polyethylene melt Ne ≈ 4.2 × 10⁻²⁶ m–3.64 The entanglement density in the solidified sample of PE of a high molecular weight, as those studied here, must be higher than that in the molten material because not all of the preexisting entanglements created by the very long chains were resolved upon crystallization and many of them were only swept into interlamellar amorphous layers, contributing then to the enhanced entanglement density. Therefore, the increase of Ne with molecular weight can be expected. As it turned out, this increase influences not only the drawability (through a reduced stretch limit of the network λmax) and strain-hardening behavior but also the stability of deformation at low strains—the buckling instability resulting in the second yield point.
Table 3. Parameters Derived from Fitting the Experimental Curves with Gaussian and Non-Gaussian/8-Chain Models: the Yield Stress Y, Strain-Hardening Modulus Gn, Network Stretch Limit λMax, and the Effective Cross-Link Density, Ne.
| Gaussian
model (eq 9)a |
non-Gaussian/8-chain model (eq 10)b |
|||||
|---|---|---|---|---|---|---|
| Y (MPa) | Gn (MPa) | Y (MPa) | λmax = n1/2 | Gn (MPa) | Ne = Gn/kT (×10–26 m–3) | |
| HDPE 6 | 41.4 | 2.17 | 39.0 | 2.98 | 2.68 | 6.5 |
| UHMWPE 5 | 36.8 | 4.43 | 34.3 | 2.84 | 4.45 | 10.8 |
| UHMWPE 9 | 34.3 | 6.00 | 31.7 | 2.58 | 5.41 | 13.1 |
Fitting range: e = 0.35–0.72, (λ2 – 1/λ2 = 1.5 – 4).
Fitting range: e = 0.35–1.40, (λ2 – 1/λ2 = 1.5 – 16).
4. Conclusions
Melting of HDPE and melting of UHMWPEs are significantly different, which result in different thickness distributions of lamellar crystals: HDPE exhibits a significant fraction of crystals thicker than 23 nm. At the same time, fractions of crystals thinner than 23 nm are very similar for all polyethylenes studied. It appears that the heat flow signal in DSC during a constant heating rate is very low for melting of the same amount of small crystals, while it is high for large crystals (could exceed tens of times). This is the reason that small crystals are often escaping the detection in routine DSC examination because the heat flux for melting of small crystals could be at the noise level.
Mean crystal thickness determined from the thickness distribution of lamellar crystals fits better to the amorphous layer thickness than the crystal thickness determined from the peak melting temperature.
Microscopic examination of UHMWPE showed that the lamellae are in the form of platelets with the width and length in the range of 300–700 nm, lamellae are only a few times (from 3 to 7 times) wider and longer than their mean thickness. Lamellae radiate from primary nuclei forming a kind of embryonal spherulite, that is, there is a nucleation of a few lamellae and their radial growth that ends at 0.3–0.7 μm from the center. The most striking observation is that there is no evidence of branching and secondary nucleation from these primary lamellae. Because the lamellae are radially ordered, there is no parallel stacking of lamellae.
Double yield was observed in polyethylene samples deformed by compression along the D.A. of the compression-molded material, while it was not observed in the samples compressed along the D.R. direction, which is related to the specific preferred orientation of lamellae parallel to the D.A. (i.e., the direction of the compression molding). The second yield was associated with deformation instability involving microbuckling and subsequent kinking of lamellae. The kinking occurs in lamellae, which are oriented initially along the compression direction; therefore, it is more intense when the sample is compressed along D.A. than along D.R. Similar buckling and cooperative kinking of lamellae were observed also in other crystalline polymers deformed either in compression or in tension, however, when lamellae were arranged parallel in stacks. Microbuckling and kinking result in a rapid and dramatic reorientation of lamellae and facilitate their further deformation by relatively easy crystallographic slip. SAXS examination indicated that beyond the kinking stage, further plastic deformation takes place with crystallographic slip of the reoriented kink arms without any significant lamellae fragmentation, except in sharp kink tips, up to the strain of e ≈ 1, indicating the coherence of lamellae. The crystallographic slip is the main deformation mechanism in all lamellae inclined with respect to the compression direction, either already oriented that way or reoriented in kinks.
Because the lamellae in UHMWPE are not arranged parallel in stacks, we did not observe microbuckling, but rather kinking of separate lamellae. Hence, the strain at the second yield should depend on the stiffness of the amorphous and crystalline layers ka/kc. However, not as straightforward as in HDPE with stacks of lamellae. Therefore, microbuckling is initiated in the HDPE material, while in the UHMWPE material, the lamellae are kinked separately, not as an assembly.
Acknowledgments
The following Members of the IUPAC Subcommittee on Structure and Properties of Commercial Polymers participated in UHMWPE project and during the preparation of this paper (2016–19): Clive Bucknall (Cranfield University, UK), Volker Altstädt (Universität Bayreuth, Germany), Dietmar Auhl (Technische Universität Berlin, Germany), Paul Buckley (University of Oxford, UK), Christoph Gögelein (Lanxess Deutschland GmbH, Leverkusen, Germany), Dirk Dijkstra (Covestro Deutschland A.G., Leverkusen, Germany), A.G. (Polish Academy of Science, Lodz, Poland), Goerg Michler (Martin-Luther-Universität Halle-Wittenberg, Germany), Ulrich Handge (Helmholtz-Zentrum Geesthacht, Germany), Jiasong He (Chinese Academy of Science, Beijing, China), Chen-Yang Liu (Chinese Academy of Science, Beijing, China), Ewa Piorkowska (Polish Academy of Science, Lodz, Poland), Miroslav Slouf (Institute of Macromolecular Chemistry CAS, Prague, Czech Republic), Iakovos Vittorias (Lyondell Basell GmbH, Mainz, Germany), and Jun Jie Wu (Durham University, UK). More on the Subcommittee can be found on: https://iupac.org/who-we-are/committees/committee-details/?body_code=421. This project was supported by the National Science Center, Poland, on the basis of the decision number DEC-2014/15/B/ST8/04306.
The authors declare no competing financial interest.
References
- Kurtz S. M.UHMWPE Biomaterials Handbook: Ultra High Molecular Weight Polyethylene in Total Joint Replacement and Medical Devices, 3rd ed.; Elsevier, 2015. [Google Scholar]
- Goodman S. B. Wear particles, periprosthetic osteolysis and the immune system. Biomaterials 2007, 28, 5044–5048. 10.1016/j.biomaterials.2007.06.035. [DOI] [PMC free article] [PubMed] [Google Scholar]
- Ingham E.; Fisher J. Biological reactions to wear debris in total joint replacement. Proc. Inst. Mech. Eng., Part H 2000, 214, 21–37. 10.1243/0954411001535219. [DOI] [PubMed] [Google Scholar]
- Bartel D. L.; Bicknell V. L.; Wright T. M. The effect of conformity, thickness, and material on stresses in ultra-high molecular weight components for total joint replacement. J. Bone Jt. Surg. 1986, 68, 1041–1051. 10.2106/00004623-198668070-00010. [DOI] [PubMed] [Google Scholar]
- Kurelec L.; Rastogi S.; Meier R. J.; Lemstra P. J. Chain mobility in polymer systems: On the borderline between solid and melt. 3. Phase transformations in nascent ultrahigh molecular weight polyethylene reactor powder at elevated pressure as revealed by in situ Raman spectroscopy. Macromolecules 2000, 33, 5593–5601. 10.1021/ma9911187. [DOI] [Google Scholar]
- Rastogi S.; Kurelec L.; Lemstra P. J. Chain mobility in polymer systems: On the borderline between solid and melt. 2. Crystal size influence in phase transition and sintering of ultrahigh molecular weight polyethylene via the mobile hexagonal phase. Macromolecules 1998, 31, 5022–5031. 10.1021/ma980261h. [DOI] [PubMed] [Google Scholar]
- Barham P. J.; Sadler D. M. A neutron scattering study of the melting behaviour of polyethylene single crystals. Polymer 1991, 32, 393–395. 10.1016/0032-3861(91)90440-t. [DOI] [Google Scholar]
- de Gennes P. G. Explosion à la fusion. C. R. Acad. Sci., Ser. IIb: Mec., Phys., Chim., Astron. 1995, 321, 363–365. [Google Scholar]
- Deplancke T.; Lame O.; Rousset F.; Aguili I.; Seguela R.; Vigier G. Diffusion versus Cocrystallization of Very Long Polymer Chains at Interfaces: Experimental Study of Sintering of UHMWPE Nascent Powder. Macromolecules 2014, 47, 197–207. 10.1021/ma402012f. [DOI] [Google Scholar]
- Deplancke T.; Lame O.; Rousset F.; Seguela R.; Vigier G. Mechanisms of Chain Reentanglement during the Sintering of UHMWPE Nascent Powder: Effect of Molecular Weight. Macromolecules 2015, 48, 5328–5338. 10.1021/acs.macromol.5b00618. [DOI] [Google Scholar]
- Kurtz S. M.; Pruitt L.; Jewett C. W.; Paul Crawford R.; Crane D. J.; Edidin A. A. The yielding, plastic flow, and fracture behavior of ultra-high molecular weight polyethylene used in total joint replacements. Biomaterials 1998, 19, 1989–2003. 10.1016/s0142-9612(98)00112-4. [DOI] [PubMed] [Google Scholar]
- Galetz M. C.; Glatzel U. Molecular Deformation Mechanisms in UHMWPE During Tribological Loading in Artificial Joints. Tribol. Lett. 2010, 38, 1–13. 10.1007/s11249-009-9563-y. [DOI] [Google Scholar]
- Wang A.; Stark C.; Dumbleton J. H. Role of cyclic plastic deformation in the wear of UHMWPE acetabular cups. J. Biomed. Mater. Res. 1995, 29, 619–626. 10.1002/jbm.820290509. [DOI] [PubMed] [Google Scholar]
- Wrona M.; Mayor M. B.; Collier J. P.; Jensen R. E. The correlation between fusion defects and damage in tibial polyethylene bearings. Clin. Orthop. Relat. Res. 1994, 299, 92–103. 10.1097/00003086-199402000-00013. [DOI] [PubMed] [Google Scholar]
- Lin L.; Argon A. S. Structure and plastic-deformation of polyethylene. J. Mater. Sci. 1994, 29, 294–323. 10.1007/bf01162485. [DOI] [Google Scholar]
- Galeski A. Strength and toughness of crystalline polymer systems. Prog. Polym. Sci. 2003, 28, 1643–1699. 10.1016/j.progpolymsci.2003.09.003. [DOI] [Google Scholar]
- Oleinik E. F. Plasticity of semicrystalline flexible-chain polymers at the microscopic and mesoscopic levels. Polym. Sci., Ser. C 2003, 45, 17–117. [Google Scholar]
- Bartczak Z.; Galeski A. Plasticity of Semicrystalline Polymers. Macromol. Symp. 2010, 294, 67–90. 10.1002/masy.201050807. [DOI] [Google Scholar]
- Séguéla R. Plasticity of semi-crystalline polymers: crystal slip versus melting-recrystallization. e-Polym. 2007, 7, 032. 10.1515/epoly.2007.7.1.382. [DOI] [Google Scholar]
- Bartczak Z.; Galeski A.; Argon A. S.; Cohen R. E. On the plastic deformation of the amorphous component in semicrystalline polymers. Polymer 1996, 37, 2113–2123. 10.1016/0032-3861(96)85856-3. [DOI] [Google Scholar]
- Bergström J.; Kurtz S. M.; Rimnac C. M.; Edidin A. A. Constitutive modeling of ultra-high molecular weight polyethylene under large-deformation and cyclic loading conditions. Biomaterials 2002, 23, 2329–2343. 10.1016/s0142-9612(01)00367-2. [DOI] [PubMed] [Google Scholar]
- Lee B. J.; Argon A. S.; Parks D. M.; Ahzi S.; Bartczak Z. Simulation of large-strain plastic-deformation and texture evolution in high-density polyethylene. Polymer 1993, 34, 3555–3575. 10.1016/0032-3861(93)90039-d. [DOI] [Google Scholar]
- Vandommelen J.; Parks D.; Boyce M.; Brekelmans W.; Baaijens F. Micromechanical modeling of the elasto-viscoplastic behavior of semi-crystalline polymers. J. Mech. Phys. Solid. 2003, 51, 519–541. 10.1016/s0022-5096(02)00063-7. [DOI] [Google Scholar]
- van Dommelen J. A. W.; Parks D. M.; Boyce M. C.; Brekelmans W. A. M.; Baaijens F. P. T. Micromechanical modeling of intraspherulitic deformation of semicrystalline polymers. Polymer 2003, 44, 6089–6101. 10.1016/S0032-3861(03)00558-5. [DOI] [Google Scholar]
- van Dommelen J. A. W.; Poluektov M.; Sedighiamiri A.; Govaert L. E. Micromechanics of semicrystalline polymers: Towards quantitative predictions. Mech. Res. Commun. 2017, 80, 4–9. 10.1016/j.mechrescom.2016.01.002. [DOI] [Google Scholar]
- Young R. J. A dislocation model for yield in polyethylene. Philos. Mag. 1974, 30, 85–94. 10.1080/14786439808206535. [DOI] [Google Scholar]
- Young R. J. Screw dislocation model for yield in polyethylene. Mater. Forum 1988, 11, 210–216. [Google Scholar]
- Frank F. C.; Read W. T. Multiplication processes for slow moving dislocations. Phys. Rev. 1950, 79, 722–723. 10.1103/PhysRev.79.722. [DOI] [Google Scholar]
- Peterson J. M. Thermal Initiation of Screw Dislocations in Polymer Crystal Platelets. J. Appl. Phys. 1966, 37, 4047–4050. 10.1063/1.1707973. [DOI] [Google Scholar]
- Shadrake L. G.; Guiu F. Dislocations in polyethylene crystals: line energies and deformation modes. Philos. Mag. 1976, 34, 565–581. 10.1080/14786437608223794. [DOI] [Google Scholar]
- Darras O.; Séguéla R. Tensile Yield of Polyethylene in Relation to Crystal Thickness. J. Polym. Sci., Part B: Polym. Phys. 1993, 31, 759–766. 10.1002/polb.1993.090310702. [DOI] [Google Scholar]
- Argon A. S.The Physics of Deformation and Fracture of Polymers; Cambridge University Press: Cambridge, 2013. [Google Scholar]
- Argon A. S. Craze initiation in glassy polymers – Revisited. Polymer 2011, 52, 2319–2327. 10.1016/j.polymer.2011.03.019. [DOI] [Google Scholar]
- Brooks N.; Mukhtar M. Temperature and stem length dependence of the yield stress of polyethylene. Polymer 2000, 41, 1475–1480. 10.1016/s0032-3861(99)00362-6. [DOI] [Google Scholar]
- Kazmierczak T.; Galeski A.; Argon A. S. Plastic deformation of polyethylene crystals as a function of crystal thickness and compression rate. Polymer 2005, 46, 8926–8936. 10.1016/j.polymer.2005.06.073. [DOI] [Google Scholar]
- Argon A. S.; Galeski A.; Kazmierczak T. Rate mechanisms of plasticity in semi-crystalline polyethylene. Polymer 2005, 46, 11798–11805. 10.1016/j.polymer.2005.06.126. [DOI] [Google Scholar]
- Hiss R.; Hobeika S.; Lynn C.; Strobl G. Network stretching, slip processes, and fragmentation of crystallites during uniaxial drawing of polyethylene and related copolymers. A comparative study. Macromolecules 1999, 32, 4390–4403. 10.1021/ma981776b. [DOI] [Google Scholar]
- G’Sell C.; Jonas J. J. Determination of the plastic behaviour of solid polymers at constant true strain rate. J. Mater. Sci. 1979, 14, 583–591. 10.1007/bf00772717. [DOI] [Google Scholar]
- Galeski A.; Bartczak Z.; Argon A. S.; Cohen R. E. Morphological alterations during texture-producing plastic plane-strain compression of high-density polyethylene. Macromolecules 1992, 25, 5705–5718. 10.1021/ma00047a023. [DOI] [Google Scholar]
- Vasu R.; Carter D. R.; Harris W. H. Stress distributions in the acetabular region—I. Before and after total joint replacement. J. Biomech. 1982, 15, 155–164. 10.1016/0021-9290(82)90247-0. [DOI] [PubMed] [Google Scholar]
- Bartczak Z. Evaluation of effective density of the molecular network and concentration of the stress transmitters in amorphous layers of semicrystalline polyethylene. Polym. Test. 2018, 68, 261–269. 10.1016/j.polymertesting.2018.04.027. [DOI] [Google Scholar]
- Bartczak Z. Influence of molecular parameters on high-strain deformation of polyethylene in the plane-strain compression. Part II. Strain recovery. Polymer 2005, 46, 10339–10354. 10.1016/j.polymer.2005.07.096. [DOI] [Google Scholar]
- Olley R. H.; Hodge A. M.; Bassett D. C. A permanganic etchant for polyolefines. J. Polym. Sci., Polym. Phys. Ed. 1979, 17, 627–643. 10.1002/pol.1979.180170406. [DOI] [Google Scholar]
- Galeski A.; Bartczak Z.; Kazmierczak T.; Slouf M. Morphology of undeformed and deformed polyethylene lamellar crystals. Polymer 2010, 51, 5780–5787. 10.1016/j.polymer.2010.10.004. [DOI] [Google Scholar]
- Wunderlich B.; Czornyj G. A Study of Equilibrium Melting of Polyethylene. Macromolecules 1977, 10, 906–913. 10.1021/ma60059a006. [DOI] [Google Scholar]
- Hoffman J. D.; Davis G. T.; Lauritzen J. I.. The Rate of Crystallization of Linear Polymers with Chain Folding in Teatise on Solid State Chemistry; Hannay N. B., Ed.; Plenum Press: New York, 1976; Vol. 3, pp 497–614. [Google Scholar]
- Iijima M.; Strobl G. Isothermal crystallization and melting of isotactic polypropylene analyzed by time- and temperature-dependent small-angle X-ray scattering experiments. Macromolecules 2000, 33, 5204–5214. 10.1021/ma000019m. [DOI] [Google Scholar]
- Hamad F. G.; Colby R. H.; Milner S. T. Lifetime of Flow-Induced Precursors in Isotactic Polypropylene. Macromolecules 2015, 48, 7286–7299. 10.1021/acs.macromol.5b01408. [DOI] [Google Scholar]
- Xu J.; Heck B.; Ye H.-M.; Jiang J.; Tang Y.-R.; Liu J.; Guo B.-H.; Reiter R.; Zhou D.-S.; Reiter G. Stabilization of Nuclei of Lamellar Polymer Crystals: Insights from a Comparison of the Hoffman–Weeks Line with the Crystallization Line. Macromolecules 2016, 49, 2206–2215. 10.1021/acs.macromol.5b02123. [DOI] [Google Scholar]
- Psarski M.; Piorkowska E.; Galeski A. Crystallization of Polyethylene from Melt with Lowered Chain Entanglements. Macromolecules 2000, 33, 916–932. 10.1021/ma990298h. [DOI] [Google Scholar]
- Wunderlich B.Macromolecular Physics Volume1, Crystal Structure, Morphology, Defects; Academic Press: New York, 1973; Vol. 1. [Google Scholar]
- Hoffman J. D. Role of reptation in the rate of crystallization of polyethylene fractions from the melt. Polymer 1982, 23, 656–670. 10.1016/0032-3861(82)90048-9. [DOI] [Google Scholar]
- Crist B.; Mirabella F. M. Crystal Thickness Distributions from Melting Homopolymers or Random Copolymers. J. Polym. Sci., Part B: Polym. Phys. 1999, 37, 3131–3140. . [DOI] [Google Scholar]
- Kavesh S.; Schultz J. M. Lamellar and interlamellar structure in melt-crystallized polyethylene. I. Degree of crystallinity, atomic positions, particle size, and lattice disorder of the first and second kinds. J. Polym. Sci., Part A-2 1970, 8, 243–276. 10.1002/pol.1970.160080205. [DOI] [Google Scholar]
- Allen G.; Gee G.; Wilson G. J. Intermolecular forces and chain flexibilities in polymers: I. Internal pressures and cohesive energy densities of simple liquids. Polymer 1960, 1, 456–466. 10.1016/0032-3861(60)90061-6. [DOI] [Google Scholar]
- Seguela R.; Rietsch F. Double yield point in polyethylene under tensile loading. J. Mater. Sci. Lett. 1990, 9, 46–47. 10.1007/bf00722865. [DOI] [Google Scholar]
- Séguéla R.; Darras O. Phenomenological Aspects Of The Double Yield Of Polyethylene And Related Copolymers Under Tensile Loading. J. Mater. Sci. 1994, 29, 5342–5352. 10.1007/bf01171546. [DOI] [Google Scholar]
- Kontou E.; Niaounakis M. Thermo-mechanical properties of LLDPE/SiO2 nanocomposites. Polymer 2006, 47, 1267–1280. 10.1016/j.polymer.2005.12.039. [DOI] [Google Scholar]
- Manzur A.; Rivas J. I. Crystallinity Variations in the Double Yield Region of Polyethylene. J. Appl. Polym. Sci. 2007, 104, 3103–3111. 10.1002/app.25905. [DOI] [Google Scholar]
- Brooks N. W.; Duckett R. A.; Ward I. M. Investigation Into Double Yield Points In Polyethylene. Polymer 1992, 33, 1872–1880. 10.1016/0032-3861(92)90486-g. [DOI] [Google Scholar]
- Shan G.-F.; Yang W.; Yang M.-b.; Xie B.-h.; Li Z.-m.; Feng J.-m. Effect of crystallinity level on the double yielding behavior of polyamide 6. Polym. Test. 2006, 25, 452–459. 10.1016/j.polymertesting.2006.01.013. [DOI] [Google Scholar]
- Schrauwen B. A. G.; Janssen R. P. M.; Govaert L. E.; Meijer H. E. H. Intrinsic deformation behavior of semicrystalline polymers. Macromolecules 2004, 37, 6069–6078. 10.1021/Ma035279t. [DOI] [Google Scholar]
- Haward R. N. Strain hardening of thermoplastics. Macromolecules 1993, 26, 5860–5869. 10.1021/ma00074a006. [DOI] [Google Scholar]
- Bartczak Z.; Kozanecki M. Influence of molecular parameters on high-strain deformation of polyethylene in the plane-strain compression. Part I. Stress-strain behavior. Polymer 2005, 46, 8210–8221. 10.1016/j.polymer.2005.06.100. [DOI] [Google Scholar]
- Young R. J. Screw dislocation model for yield in polyethylene. Mater. Forum 1988, 11, 210–216. [Google Scholar]
- Darras O.; Séguéla R. Tensile yield of polyethylene in relation to crystal thickness. J. Polym. Sci., Part B: Polym. Phys. 1993, 31, 759–766. 10.1002/polb.1993.090310702. [DOI] [Google Scholar]
- Flores A.; Baltá Calleja F. J.; Attenburrow G. E.; Bassett D. C. Microhardness studies of chain-extended PE: III. Correlation with yield stress and elastic modulus. Polymer 2000, 41, 5431–5435. 10.1016/s0032-3861(99)00755-7. [DOI] [Google Scholar]
- Lucas J. C.; Failla M. D.; Smith F. L.; Mandelkern L.; Peacock A. J. The double yield in the tensile deformation of the polyethylenes. Polym. Eng. Sci. 1995, 35, 1117–1123. 10.1002/pen.760351308. [DOI] [Google Scholar]
- Butler M. F.; Donald A. M.; Ryan A. J. Time resolved simultaneous small- and wide-angle X-ray scattering during polyethylene deformation 3. Compression of polyethylene. Polymer 1998, 39, 781–792. 10.1016/S0032-3861(97)00346-7. [DOI] [Google Scholar]
- Butler M. F.; Donald A. M.; Ryan A. J. Time resolved simultaneous small- and wide-angle X-ray scattering during polyethylene deformation—2. Cold drawing of linear polyethylene. Polymer 1998, 39, 39–52. 10.1016/S0032-3861(97)00226-7. [DOI] [Google Scholar]
- Butler M. F.; Donald A. M.; Ryan A. J. Time resolved simultaneous small- and wide-angle X-ray scattering during polyethylene deformation: 1. Cold drawing of ethylene-α-olefin copolymers. Polymer 1997, 38, 5521–5538. 10.1016/S0032-3861(97)00111-0. [DOI] [Google Scholar]
- Gaucher-Miri V.; Séguéla R. Tensile Yield of Polyethylene and Related Copolymers: Mechanical and Structural Evidences of Two Thermally Activated Processes. Macromolecules 1997, 30, 1158–1167. 10.1021/ma9601878. [DOI] [Google Scholar]
- Scogna R. C.; Register R. A. Plastic Deformation of Ethylene/Methacrylic Acid Copolymers and Ionomers. J. Polym. Sci., Part B: Polym. Phys. 2009, 47, 1588–1598. 10.1002/polb.21762. [DOI] [Google Scholar]
- Rozanski A.; Galeski A. Crystalline Lamellae Fragmentation during Drawing of Polypropylene. Macromolecules 2015, 48, 5310–5322. 10.1021/acs.macromol.5b01180. [DOI] [Google Scholar]
- Sedighiamiri A.; Govaert L. E.; van Dommelen J. A. W. Micromechanical Modeling of the Deformation Kinetics of Semicrystalline Polymers. J. Polym. Sci., Part B: Polym. Phys. 2011, 49, 1297–1310. 10.1002/polb.22297. [DOI] [Google Scholar]
- Burnay S. G.; Groves G. W. The lamellar structure of oriented high-density polyethylene. J. Mater. Sci. 1977, 12, 1139–1142. 10.1007/bf02426851. [DOI] [Google Scholar]
- Bartczak Z.; Cohen R. E.; Argon A. S. Evolution of the Crystalline Texture of High-Density Polyethylene during Uniaxial Compression. Macromolecules 1992, 25, 4692–4704. 10.1021/Ma00044a034. [DOI] [Google Scholar]
- Michler G. H.; Adhikari R.; Henning S. Micromechanical properties in lamellar heterophase polymer systems. J. Mater. Sci. 2004, 39, 3281–3292. 10.1023/B:JMSC.0000026929.30869.da. [DOI] [Google Scholar]
- Mohanraj J.; Morawiec J.; Pawlak A.; Barton D. C.; Galeski A.; Ward I. M. Orientation of polyoxymethylene by rolling with side constraints. Polymer 2008, 49, 303–316. 10.1016/j.polymer.2007.11.008. [DOI] [Google Scholar]
- Krumova M.; Henning S.; Michler G. H. Chevron morphology in deformed semicrystalline polymers. Philos. Mag. 2006, 86, 1689–1712. 10.1080/14786430500501671. [DOI] [Google Scholar]
- Bartczak Z.; Vozniak A. WAXS/SAXS study of plastic deformation instabilities and lamellae fragmentation in polyethylene. Polymer 2019, 177, 160–177. 10.1016/j.polymer.2019.05.076. [DOI] [PMC free article] [PubMed] [Google Scholar]
- Bartczak Z.; Vozniak A. Deformation Instabilities and Lamellae Fragmentation during Deformation of Cross-linked Polyethylene. polymers 2019, 11, 1954. 10.3390/polym11121954. [DOI] [PMC free article] [PubMed] [Google Scholar]
- Michler G. H.; Balta-Calleja F. J.. Nano- and Micromechanics of Polymers; Carl Hanser Verlag: Munich, 2012. [Google Scholar]
- Davis G. H.; Reynolds S. J.; Reynolds S. J.. Structural Geology of Rocks and Regions; Wiley, 1996; pp 372–424. [Google Scholar]
- Haward R. N.; Thackray G. Use of a mathematical model to describe isothermal stress-strain curves in glassy thermoplastics. Proc. R. Soc. London, Ser. A 1967, 302, 453–472. 10.1098/rspa.1968.0029. [DOI] [Google Scholar]
- Haward R. N. Strain hardening of high density polyethylene. J. Polym. Sci., Part B: Polym. Phys. 2007, 45, 1090–1099. 10.1002/polb.21123. [DOI] [Google Scholar]
- Boyce M. C.; Parks D. M.; Argon A. S. Large inelastic deformation of glassy polymers. part I: rate dependent constitutive model. Mech. Mater. 1988, 7, 15–33. 10.1016/0167-6636(88)90003-8. [DOI] [Google Scholar]
- Boyce M. C.; Socrate S.; Llana P. G. Constitutive model for the finite deformation stress–strain behavior of poly(ethylene terephthalate) above the glass transition. Polymer 2000, 41, 2183–2201. 10.1016/S0032-3861(99)00406-1. [DOI] [Google Scholar]
- Arruda E. M.; Boyce M. C. A three-dimensional constitutive model for the large stretch behavior of rubber elastic materials. J. Mech. Phys. Solid. 1993, 41, 389–412. 10.1016/0022-5096(93)90013-6. [DOI] [Google Scholar]
- Bartczak Z.; Grala M.; Richaud E.; Gadzinowska K. Erosion of the molecular network in the amorphous layers of polyethylene upon high- strain deformation. Polymer 2016, 99, 552–565. 10.1016/j.polymer.2016.07.068. [DOI] [Google Scholar]
- Hong K.; Rastogi A.; Strobl G. A model treating tensile deformation of semicrystalline polymers: Quasi-static stress-strain relationship and viscous stress determined for a sample of polyethylene. Macromolecules 2004, 37, 10165–10173. 10.1021/ma049174h. [DOI] [Google Scholar]


