Abstract
The impact of material chemical composition on microbial growth on building materials remains relatively poorly understood. We investigate the influence of the chemical composition of material extractives on microbial growth and community dynamics on 30 different wood species that were naturally inoculated, wetted, and held at high humidity for several weeks. Microbial growth was assessed by visual assessment and molecular sequencing. Unwetted material powders and microbial swab samples were analyzed using reverse phase liquid chromatography with tandem mass spectrometry. Different wood species demonstrated varying susceptibility to microbial growth after 3 weeks and visible coverage and fungal qPCR concentrations were correlated (R2 = 0.55). Aspergillaceae was most abundant across all samples; Meruliaceae was more prevalent on 8 materials with the highest visible microbial growth. A larger and more diverse set of compounds was detected from the wood shavings compared to the microbial swabs, indicating a complex and heterogeneous chemical composition within wood types. Several individual compounds putatively identified in wood samples showed statistically significant, near-monotonic associations with microbial growth, including C11H16O4, C18H34O4, and C6H15NO. A pilot experiment confirmed the inhibitory effects of dosing a sample of wood materials with varying concentrations of liquid C6H15NO (assuming it presented as Diethylethanolamine).
Subject terms: Environmental microbiology, Environmental sciences
Introduction
Buildings are complex ecosystems that contain many habitats for microbial communities1–4. In buildings that lack a history of water damage or exposure to excessive moisture conditions, microbial communities found on surfaces are generally considered to consist of deposited microbes originating from outdoor environments and the microbiome of human occupants, typically with minimal microbial growth5,6. However, most buildings experience some kind of high moisture event(s) throughout their life cycles, often resulting from rain or snow penetration, plumbing leaks, building foundation cracks, floods and extreme weather events, condensation of damp air, and/or rising dampness from the ground7–9. Building materials that have experienced moisture damage and/or are subjected to sustained high (i.e., > 80%) relative humidity (RH) can experience microbial growth9, which can generate metabolites that are toxic to humans10,11. Microbial growth can also cause material biodeterioration, which adversely affects their physical and mechanical properties12. Moreover, dampness in buildings alone is associated with a variety of adverse health outcomes13–16.
There are several well-known factors that influence the likelihood and extent of microbial growth on building materials, including environmental conditions, water availability, and material susceptibility to microbial growth. Decades of research have shown that microbial (especially fungal) growth on building materials is enhanced under warm and humid conditions17–22. Furthermore, microbial growth is also enhanced under liquid wetting (i.e., soaked) conditions compared to when high humidity is the sole moisture source23. Microbial growth on material surfaces is also influenced by light, available nutrients, pH value, and even by the orientation of the material24,25. Available surface water also plays an important role in microbial growth on materials. Common building and furnishing materials such as plywood, oriented strand board (OSB) sheathing, and gypsum board are hygroscopic and will absorb trapped moisture, making them highly susceptible to fungal growth26. On the other hand, many other materials are hydrophobic and are far less susceptible to fungal growth, such as glass, ceramic products, polymer-based materials such as polystyrene, and others21,27.
Past research has shown that material composition appears to be a key driver of microbial growth susceptibility. For example, materials such as ceiling tiles, wood, and gypsum board paper backing, which are organic or are produced from organic products, have been shown to provide ample nutrients to support fungal growth when held at high moisture conditions, while paper-free materials such as inorganic ceiling tiles and gypsum itself support little or no growth28. Material composition, including the presence of organic matter via settled dust, has also been shown to influence fungal abundance and enzyme activity of fungal species29, as well as the composition and structure of fungal communities and the relative abundance of specific genera on materials30. Specific chemical components that are widely considered to encourage fungal growth on materials include natural organic polymers such as lignin, cellulose, hemicellulose, pectin, and starch, which fungi can break down and utilize as a nutrient source31,32. Additionally, wood extractives are non-structural wood molecules that represent a minor fraction in wood and that can be removed from wood by solvents. However, they are a key source of diverse molecules, including those that are putatively bioactive33. The composition of extractives in wood varies widely from species to species and can vary depending on geographical origin and from which part of the tree a sample originates34–36.
Of particular interest to this study, many wood-based materials have been shown to have high microbial growth susceptibility, albeit with high variability between different wood species37. For instance, pine plywood and paper-covered gypsum board have been identified to have high fungal growth susceptibility. The large amount of sapwood in pine plywood, which has a relatively high free sugar content, and the starch adhesive used to glue the paper layers of paper-covered gypsum board, likely contribute significantly to their susceptibility to microbial colonization and growth26. Conversely, several wood-based materials have been shown to have decay-resistant properties. For example, yellow-cedar heartwood contains compounds that inhibit decay38 and Norway spruce heartwood was found to be relatively resistant to microbial growth as well39. One recent study assessed the relationship between fungal growth susceptibility of wood-plastic composites and volatile chemical components of the samples, finding that several compounds identified in a head space analysis above the materials were associated with higher fungal growth resistance in some wood samples (e.g., 8-propoxy-cedrane, cedrol, α-cedrene and β-cedrene in C. lanceolate, or China fir), while other compounds were associated with lower fungal growth resistance in other wood samples (e.g., longifolene, caryophyllene and α-pinene in P. massoniana, or Masson’s pine)40.
Previous studies have demonstrated that the decay-resistance of wood could be determined by the extractive content and its chemical compounds. For example, a strong correlation has been established between wood durability and extractive content and diversity41,42. For instance, an important extractive compound in teak wood, napthoquinone, was found more consistently correlated with higher decay resistance, implying that napthoquinone imparted decay resistance to teak wood against two brown-rot fungi Polypomus palustris and Gloeophyllum trabeum43. Also, the methonal extracts of Alaska cedar wood and western juniper wood showed significant antimicrobial activity against test microbes, including Fusobacterium necrophorum, Clostridium perfringens, Actinomyces bovis and Candida albicans44.
Despite these findings, there still remains a lack of understanding of the fundamental chemical drivers of microbial growth susceptibility in wood extractives and how variability in wood extractives chemical composition influences microbial growth and community composition when subject to high moisture conditions. Therefore, the objective of this study is to investigate the influence of the chemical composition of wood extractives on microbial growth and dynamics on a diverse set of wetted wood material samples using small-scale chamber experiments.
Results
Visible microbial growth and fungal qPCR
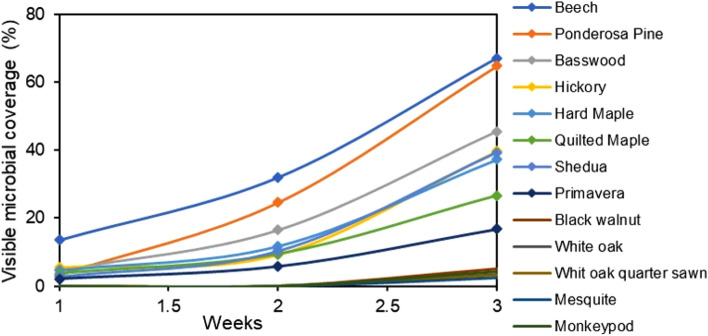
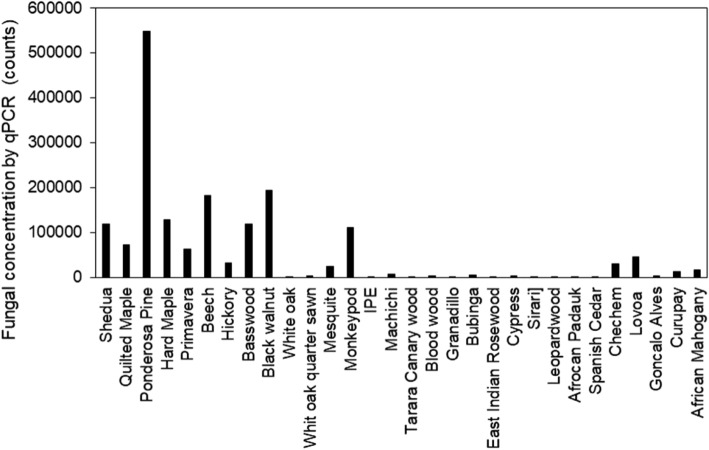
A typical example of visible microbial growth observed from an overhead picture, as well as an example of ImageJ processing to quantify visible growth, is shown in Fig. S1. Visible microbial growth was observed within 3 weeks on 13 of the 30 wood species, with different wood species demonstrating widely varying susceptibility to growth (Fig. 1). Of the 13 species with the greatest visible coverage area, Beech (Fagus grandifolia) showed the greatest amount of coverage followed by Ponderosa Pine (Pinus ponderosa) and Basswood (Tilia americana). Similarly, for fungal qPCR outcomes, we observed that Ponderosa Pine had the greatest fungal abundance, followed by Beech, Black Walnut (Juglans nigra), and Hard Maple (Acer saccharum) (Fig. 2). The correlation between visible microbial growth coverage and fungal qPCR concentrations, both at the end of the incubation period, was relatively strong given the uncertainties involved in swabbing, extraction, and PCR reactions (R2 = 0.55; Fig. 3).
Figure 1.
Fractional area of microbial growth coverage over time on 13 wood species with visible microbial growth after wetting and held at 94% RH for 3 weeks. There was no visible microbial growth on the other 17 wood species in the 3-week test period.
Figure 2.
Fungal qPCR concentrations on all 30 wood species after 3 weeks of incubation at high RH.
Figure 3.
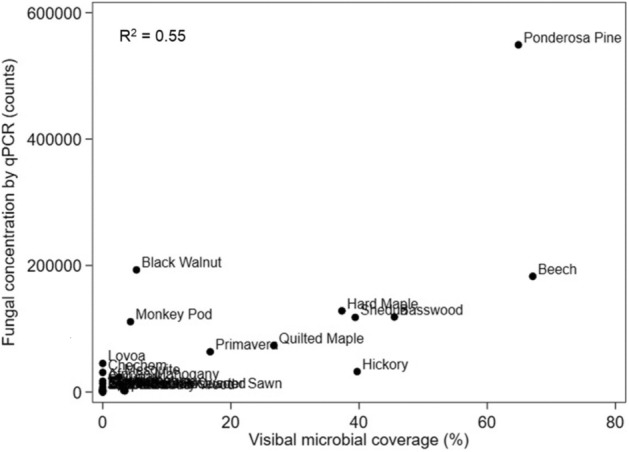
Correlation between visible microbial growth coverage and fungal qPCR concentrations for the 30 tested wood species after 3 weeks of incubation at high RH.
Relative abundance of fungal taxa
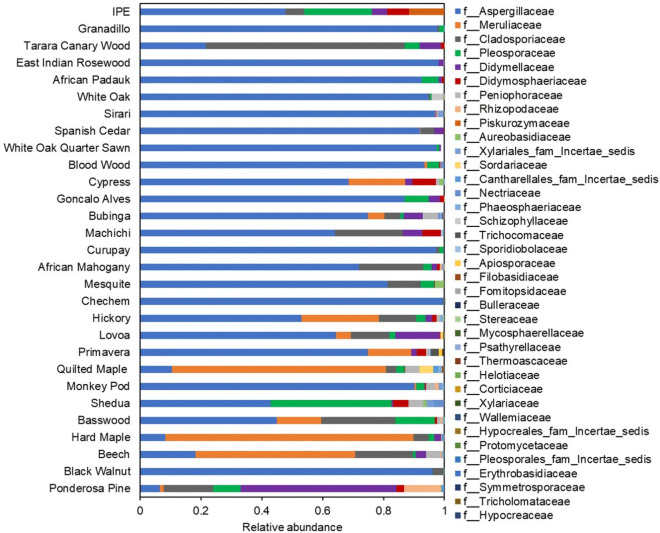
Using DADA2 amplicon inference software45, 274 amplicon sequence variants (ASVs) were inferred from the ITS amplicon data. These ASVs represent the overall distinct fungal community members identified by the ITS sequencing and Fig. S2 shows the rarefaction curve for each wood type. The ASVs most likely taxonomy classification was determined by mapping their ITS nucleotide sequences to the UNITE reference database46. These taxonomies were later grouped at the family level for each wood type to identify the specific signatures and patterns across different materials (Fig. 4). Wood species are shown in descending order of qPCR magnitude from bottom to top, and the legend is sorted by taxa prevalence. Despite all being naturally inoculated in the same environment and wetted with the same water, it appears that inherent differences in material composition contributed to differences in which fungal families thrived after wetting and being held at high RH. For example, Aspergillaceae was most abundant across all of the wood samples. However, Meruliaceae was more prevalent on the 8 materials that were observed to have the greatest visible microbial growth coverage, especially for Beech and Maple. Ponderosa Pine, which had both high visible microbial growth coverage and high fungal qPCR concentrations, was dominated by Didymellaceae, while Pleosporaceae appeared in high abundance only on Shedua. Among the identified families in Fig. 4, Aspergillaceae, Cladosporiaceae, Tricholomataceae, Sporidiobolaceae and Nectriaceae were also found commonly in homes with dampness and mold27,47–50.
Figure 4.
Fungal relative abundance detected by ITS sequencing in 30 different wood materials (with the exception of Leopardwood, which did not yield any ITS DNA) after 3 weeks of high RH exposure. Wood species are shown in descending order of qPCR magnitude from bottom to top, and the legend is sorted by taxa prevalence.
Untargeted metabolomics of microbial and material samples
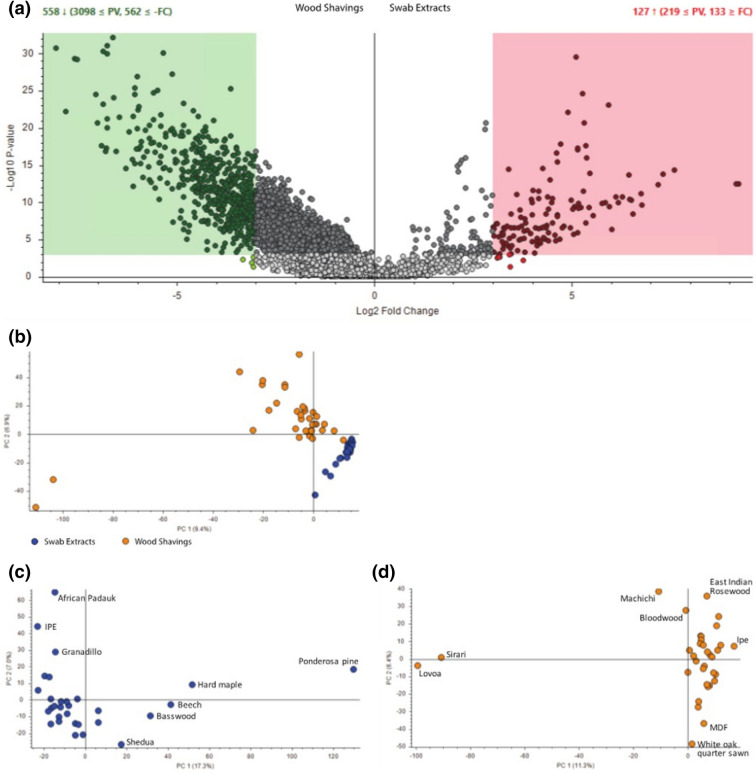
Figure 5a shows a comparison of the microbial and wood metabolites in a volcano plot, which revealed several broad trends. Although there is some overlap in the metabolites detected in these two data sets, there is a large number of metabolites that significantly differentiate the two groups, with differences in relative abundance up to 500-fold. Additionally, a larger and more diverse set of metabolites was detected from the wood shavings compared to the microbial swabs, indicating a complex and heterogeneous chemical composition within the wood types.
Figure 5.
Metabolomics analysis of microbial swab extracts and wood shavings: (a) Volcano plot indicating metabolites that are selectively present in either wood shaving samples (left, green dots) or in swab extract samples (right, red dots), (b) PCA plot contrasting clustering of swab extract samples (blue) and wood shavings samples (gold), (c) PCA plot for swab extract samples only, and (d) PCA plot for wood shaving samples only.
Data visualization by principal component analysis (PCA) plots revealed further insights. Comparison of the wood shavings and swab extracts on the same plot (Fig. 5b) shows that these groups have distinct signatures, and also that the swab extract samples cluster tightly together, indicating low heterogeneity. These observations mirror the trends seen in Fig. 5a. Furthermore, PCA of either the wood shaving or swab extract samples on their own demonstrates that metabolomics data can be used to distinguish between different wood types. For example, within the swab extract samples (Fig. 5c), Ponderosa Pine was significantly separated from the other wood types; interestingly, this material also exhibited one of the highest levels of fungal growth (Figs. 2, 3) as well as a unique signature of fungal taxa (Fig. 4). Within the wood shaving samples, Sirari and Lovoa wood samples separate significantly from the others, across the PC1 dimension (Fig. 5d). Both of these wood types showed very low levels of microbial growth.
Chemical composition of wood material extractives and associations with microbial growth
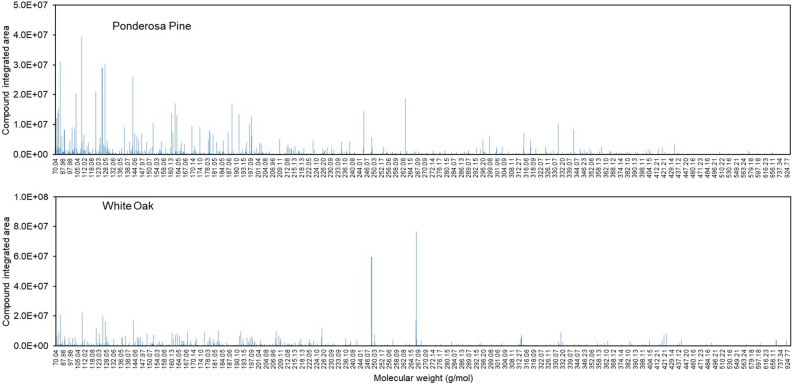
From the metabolomics analysis of wood shaving samples, a total of 5,375 spectral features were correlated with molecular formulas. Examples of chemical composition results for both Ponderosa Pine and White Oak are shown in Fig. 6 for illustration. Spectra data from the other 28 wood samples are also shown in Fig. S3.
Figure 6.
Chemical compounds identified (represented by molecular weight) and quantified (represented by compound integrated area) in Ponderosa Pine and White Oak wood shavings.
Multi-compound analysis
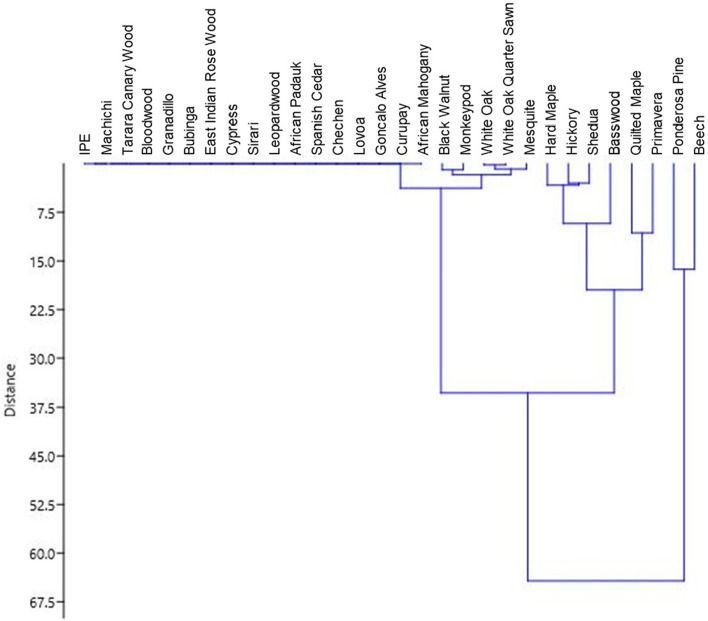
Figure 7 and Table 1 show results from the ANOSIM cluster analysis to explore the potential for clusters of multiple compounds to be associated with microbial growth. Results from this dissimilarity test suggest that multiple compound composition factors had only small effects on the microbial growth variables (average ANOSIM R ≈ 0.2) with borderline significance (p ranged from 0.05 to 0.07). This cursory analysis suggests that there were no particular suites of compounds that were clearly associated with the extent of microbial growth coverage, although the borderline level of significance suggests similar approaches are warranted in future studies.
Figure 7.
Clustering analysis of 30 wood materials by microbial growth.
Table 1.
Dissimilarity coefficients between groups (group 1: heavy growth; group 2: light growth; group 1: no growth).
| Group 1 versus Group 2 | Group 1 versus Group 3 | Group 2 versus Group 3 | |
|---|---|---|---|
| R | 0.23 | 0.18 | 0.24 |
| P | 0.05 | 0.05 | 0.07 |
Single-compound analysis
Tables 2 and 3 show the top 35 and 25 compounds identified and quantified that were most strongly correlated with visible microbial growth and fungal growth quantified via qPCR, respectively (e.g., Spearman correlation coefficients > 0.6 and p < 0.001). Compound molecular weights and speculated compound formulas are both shown; note that compound formulas are speculative because compounds identified with a particular molecular weight could represent different compounds depending on molecular structure. Also noted in Tables 2 and 3 are those compounds for which correlations were strongly correlated with both microbial growth outcomes, as well as those compounds that showed the clearest monotonic relationships between abundance and microbial growth outcome upon visual inspection (which is approximately 10 compounds per outcome). Correlations are also shown visually in Fig. S4 and S5 for the same 25–35 speculatively identified compounds.
Table 2.
Top 35 compounds that showed the strongest Spearman rank correlations with visible microbial growth.
| Compound formula | MW (g/mol) | Spearman rho | p value |
|---|---|---|---|
| C11H16O4* | 212.10 | 0.74 | 2.71E−06 |
| C15H12O5 | 272.07 | − 0.74 | 2.90E−06 |
| C6H7N2O6P | 234.01 | − 0.72 | 8.17E−06 |
| C18H28O4*† | 308.20 | 0.72 | 8.88E−06 |
| C10H14O3* | 182.09 | 0.71 | 1.07E−05 |
| C12H20O5 | 244.13 | 0.71 | 1.33E−05 |
| C12H22O6 | 262.14 | 0.70 | 1.76E−05 |
| C12H16N2O12*† | 380.07 | 0.70 | 1.79E−05 |
| C25H20N4O4* | 440.15 | 0.69 | 2.62E−05 |
| C32H36O11 | 596.23 | 0.68 | 3.15E−05 |
| C32H32N4O7 | 584.22 | 0.68 | 3.92E−05 |
| C6H13N* | 99.10 | − 0.67 | 4.51E−05 |
| C6H15NO*† | 181.09 | − 0.66 | 6.38E−05 |
| C10H16N6O4 | 284.12 | 0.66 | 7.94E−05 |
| C32H36O12 | 612.22 | 0.65 | 9.20E−05 |
| C8H10O3* | 154.06 | 0.65 | 1.03E−04 |
| C12H20O4 | 228.14 | 0.65 | 1.07E−04 |
| C19H22O5 | 330.15 | 0.65 | 1.07E−04 |
| C10H10N4O2S | 250.05 | − 0.65 | 1.08E−04 |
| C20H28O3 | 316.20 | 0.64 | 1.29E−04 |
| C49H100N5O11PS3 | 1,061.63 | − 0.64 | 1.35E−04 |
| C13H8O5 | 244.04 | − 0.64 | 1.44E−04 |
| C18H35NO4 | 329.26 | 0.64 | 1.51E−04 |
| C12H16O5 | 240.10 | 0.63 | 1.70E−04 |
| C10H22N2O6 | 266.15 | 0.63 | 1.76E−04 |
| C17H14O4 | 282.09 | − 0.63 | 1.76E−04 |
| C12H23N4O6PS* | 382.11 | 0.63 | 1.78E−04 |
| C5H13NO | 103.10 | 0.63 | 1.84E−04 |
| C15H14O5 | 274.08 | − 0.63 | 1.87E−04 |
| C17H16O6 | 316.09 | − 0.63 | 1.87E−04 |
| C7H6O2 | 122.04 | − 0.63 | 1.95E−04 |
| C3H4N3O5P3 | 254.94 | − 0.63 | 2.07E−04 |
| C20H32O4* | 353.26 | 0.63 | 2.17E−04 |
| C11H14O4 | 210.09 | 0.62 | 2.27E−04 |
| C18H30O3 | 294.22 | 0.62 | 2.37E−04 |
*Promising compounds with near-monotonic relationships with visible fungal growth.
*†Promising compounds that correlate with both fungal growth outcomes.
Table 3.
Top 25 compounds that showed the strongest Spearman rank correlations with fungal qPCR concentrations.
| Compound formula | MW (g/mol) | Spearman rho | p value |
|---|---|---|---|
| C18H34O4* | 314.25 | 0.77 | 7.19E−07 |
| C18H35NO4* | 329.26 | 0.74 | 2.94E−06 |
| C14H12O3 | 228.08 | 0.69 | 2.73E−05 |
| C18H28O4*† | 308.20 | 0.68 | 3.12E−05 |
| C18H30O3* | 294.22 | 0.67 | 4.76E−05 |
| C6H14S3* | 182.03 | 0.66 | 6.20E−05 |
| C6H15NO*† | 181.09 | − 0.66 | 7.12E−05 |
| C20H26O3 | 314.19 | 0.65 | 1.03E−04 |
| C12H16N2O12*† | 380.07 | 0.65 | 1.10E−04 |
| C15H12O4 | 256.07 | − 0.63 | 2.11E−04 |
| C5H8O* | 84.06 | 0.63 | 2.14E−04 |
| C16H16O5 | 288.10 | − 0.63 | 2.20E−04 |
| C12H23NO4 | 245.16 | 0.62 | 2.23E−04 |
| C16H17N5O4P2 | 405.08 | 0.62 | 2.45E−04 |
| C11H9NO2* | 187.06 | 0.62 | 2.79E−04 |
| C19H14N2O5S | 382.06 | 0.62 | 2.83E−04 |
| C20H28O3* | 316.20 | 0.61 | 3.26E−04 |
| C12H6N6O | 250.06 | 0.61 | 3.26E−04 |
| C8H8O | 120.06 | − 0.60 | 4.24E−04 |
| C18H28O2* | 276.21 | 0.60 | 4.30E−04 |
| C4H6N6O4 | 202.05 | 0.60 | 4.46E−04 |
| C18H30O2 | 278.22 | 0.60 | 4.52E−04 |
| C10H15NO5 | 229.09 | 0.60 | 4.57E−04 |
| C13H18O9 | 318.09 | 0.60 | 4.98 E−04 |
| C9H12N2O3S2 | 260.03 | 0.60 | 5.04E−04 |
*Promising compounds with near-monotonic relationships with fungal qPCR concentration.
*†Promising compounds that correlate with both fungal growth outcomes.
Results indicate that the putatively identified C11H16O4 had the strongest correlation with visible microbial growth, with a Spearman’s rank correlation coefficient of 0.742 (p < 0.0001) (Fig. 8). The compound formula that was most strongly correlated with fungal qPCR concentration was C18H34O4, with a Spearman’s rank correlation coefficient of 0.768 (p < 0.0001) (Fig. 9). A strong positive correlation in these analyses suggest the potential for the presence/abundance of these compounds may encourage fungal proliferation.
Figure 8.
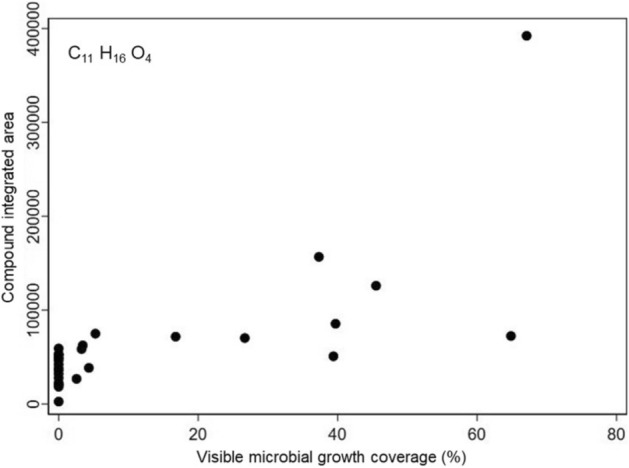
Abundance of C11H16O4 versus visible microbial growth percentage at the end of the 3-week test (Spearman rho = 0.742).
Figure 9.

Abundance of C18H34O4 versus fungal qPCR concentration at the end of the 3-week test (Spearman rho = 0.768).
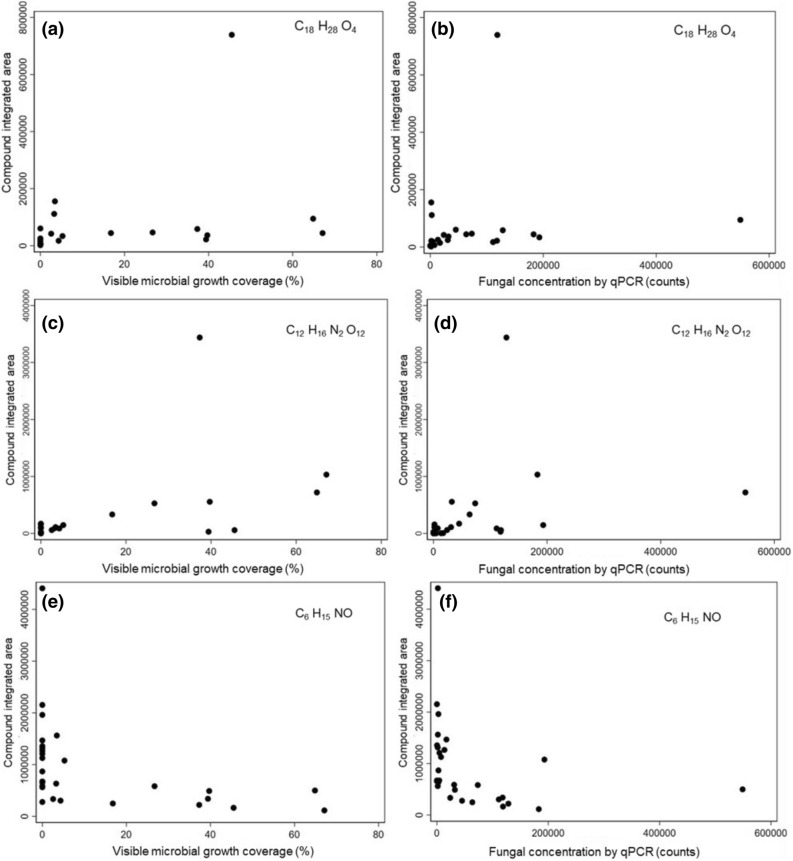
Figure 10 shows compound abundance versus microbial growth for several of the identified chemical compounds that were strongly correlated with both visible microbial growth and qPCR fungal growth outcomes. For example, C18H28O4 revealed a strong and significant correlation with visible growth (rho = 0.72, P < 0.0001) and fungal qPCR concentrations (rho = 0.68, P < 0.0001), although the relationship appears largely driven by a small number of outliers (Fig. 10a, b). C12 H16 N2 O12 was strongly correlated with both outcomes, although little information could be found about the potential names of this compound formula (Fig. 10c, d). The compound formula C6H15NO had a strong negative correlation with both microbial growth outcomes (rho = 0.66, P < 0.0001), with a shape that suggests a near-monotonic nonlinear response below a particular threshold for both growth outcomes (Fig. 10e, f). Because of these combined factors, we conducted a pilot experiment to investigate the inhibitory effects of dosing a sample of wood materials (Ponderosa Pine) with varying concentrations of pure liquid C6H15NO (assuming it was present in wood samples as Diethylethanolamine) mixed with both tap water and distilled water at varying concentrations.
Figure 10.
Abundance of three putatively identified chemical compounds versus microbial growth outcomes at the end of the 3-week test: (a) C18H28O4 versus visible growth, (b) C18H28O4 versus fungal qPCR, (c) C12H16N2O12 versus visible growth, (d) C12H16N2O12 versus fungal qPCR, (e) C6H15NO versus visible growth, and (f) C6H15NO versus fungal qPCR.
Inhibitory effect of C6H15NO on visible microbial growth assessment
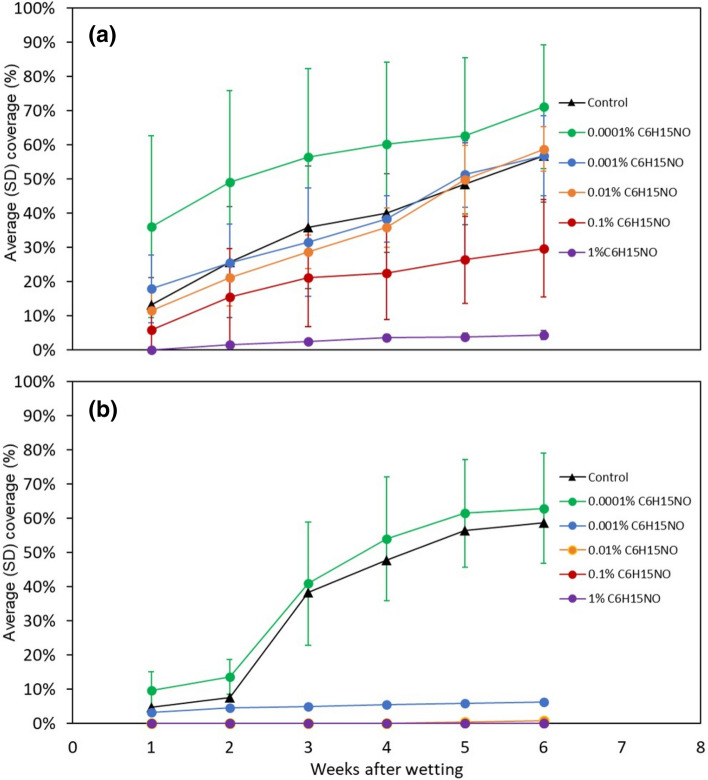
Figure 11 shows the mean (± S.D.) visible microbial growth coverage areas on the Ponderosa Pine samples over time after wetted with varying concentrations of C6H15NO (assuming Diethylethanolamine) solutions mixed with (a) tap water and (b) distilled water. Test coupons that were wetted with tap water and the lowest concentration (0.0001%) of C6H15NO showed the greatest amount of microbial coverage, ranging from ~ 36% for the first week to ~ 71% for the last week (Fig. 11a). Conversely, coupons that were wetted with tap water and the greatest concentration (1%) of C6H15NO showed the lowest amount of microbial coverage, with only ~ 4% at the last week of incubation (Fig. 11a). The amount of microbial coverage area on the coupons of the tap water control group was ~ 13% for the first week and increased to ~ 57% for the 6th week, which is similar in magnitude to the coupons that were wetted with 0.001% and 0.01% solutions of C6H15NO.
Figure 11.
Visible microbial growth coverage over time for Ponderosa Pine samples wetted with solutions with varying concentrations of C6H15NO: (a) tap water and (b) distilled water.
Similarly, the coupons that were wetted by distilled water solutions mixed with C6H15NO showed less overall microbial growth compared to the coupons wetted with tap water (Fig. 11b). However, the inhibitory effect of C6H15NO is still clearly demonstrated, as the distilled water control group and lowest concentration of C6H15NO (0.0001%) showed the greatest visible microbial growth, followed by small amounts of visible growth at 0.001% C6H15NO and negligible or no visible growth at 0.01% C6H15NO and higher.
Discussion
Results of this study indicate that the extractive chemical composition of the tested wood material samples has a significant effect on the magnitude and dynamics of microbial growth on wetted surfaces. Moreover, results suggest that a better understanding of fungal colonization susceptibility of different materials commonly used in construction could be used to limit adverse health outcomes caused by exposure to pathogenic fungal species and lessen the chance of fungal-associated wood rot.
The identified fungal families are mainly composed of saprobic species that decompose and digest plant matter. However, several contain members that are mycoparasitic or pathogenic, either to plants or animals. The fungal families Aspergillaceae, Aureobasidiaceae, Cladosporiaceae, and Nectriaceae all contain one or more pathogenic species that can cause disease in humans. The pathogenic species from these fungal families can all be characterized as opportunistic pathogens, most often infecting those with weakened immune systems such as cancer patients, people with disorders of their immune systems, or those taking drugs that intentionally suppress the immune system51–53.
Invasive aspergillosis, caused by certain species of the Aspergillaceae family, is a disease that can occur in several organs of the body but is most often associated with pulmonary infections initiated by the inhalation of fungal spores54–57. A devastating illness for immunocompromised patients, mortality rates linked to invasive aspergillosis can range from 40 to 90% in certain cases58. Chronic human exposure to one species of Aureobasidiaceae, Aureobasidium pullulans, can induce hypersensitivity pneumonitis59,60. Commonly referred to as “humidifier lung”, this disease is characterized by maladies of the lungs, including coughing, dyspnea, and acute inflammation. Species from the Cladosporiaceae family, although rarely pathogenic to humans, produce airborne spores that if one is exposed to over an extended period can cause adverse health effects, especially for people with asthma or those suffering from other respiratory diseases61,62. For Nectriaceae, the majority of species from this family are innocuous, soil-borne saprobes but several have been reported as opportunistic pathogens while others produce harmful mycotoxins63.
The fungal families Fomitopsidaceae, Merulicaeae, and Schizophyllaceae all cause forms of wood rot64. Brown rot, associated with members of Fomitopsidaceae, results from the breakdown of the structural compounds cellulose and hemicellulose by fungal enzymes and alters the wood into shrunken, brown-discolored cubical pieces65. Differing from Fomitopsidaceae, certain species of Meruliaceae and Schizophyllaceae families cause another form of wood rot called white rot, wherein the lignin of moist wood is broken down, leaving behind a stringy, light-colored material composed mostly of undigested cellulose66,67.
Of the individual chemical compounds that were most strongly correlated with the extent of visible microbial growth and/or fungal qPCR concentrations, several may have some plausible explanations. For example, possible names for the putatively identified C11H16O4, which was positively correlated with visible growth, could be methylenolactocin and DETOSU. According to a compound search, methylenolactocin is apparently known as an isolate of Penicillium with anti-cancer activity. Similarly, a possible name for the putatively identified C6H15NO, which had a strong negative correlation with both microbial growth outcomes, includes Diethylethanolamine, which is used as a corrosion inhibitor and a precursor in the production of a local anesthetic. Subsequent testing of the application of this individual compound at varying concentrations in tap water confirmed its inhibitory effects. Given that the compound is an alcohol with some known toxicity, the association is not particularly surprising, and the compound may not be a viable candidate for use as an anti-fungal agent in materials. However, the process used herein to identify individual and/or clusters of compounds intrinsic to materials that correlate with microbial growth outcomes can be utilized and expanded to isolate other candidate compounds from woods and other material and could potentially inform their integration into other types of materials to increase microbial growth resistance under wetting conditions.
While these data provide novel insights into the chemical drivers of differential microbial growth susceptibility within this otherwise homogenous set of material samples, it is important to note several limitations to this work, including: (1) only one test coupon for each type of wood was used, which does not allow for capturing variability inherent in microbial dynamics and growth on surfaces of the same material composition; (2) the material chemical composition analysis targeted a specific range of compounds (i.e., 70–1,050 m/z); other compositional analysis approaches could uncover additional insights outside of these bounds; and (3) the underlying mechanisms explaining observed associations between material compositions and microbial growth are not explored in detail. Future work with other materials and analytical approaches should focus on overcoming these limitations.
Methods
Thirty (30) different wood species were selected to study microbial growth susceptibility and community structure upon wetting. The wood samples were all purchased new in a kit from an online retailer in an attempt to collect a wide variety of wood species that were likely to experience a diversity of microbial growth patterns upon wetting. The wood samples were naturally seeded with environmental microbes, wetted, and then incubated at high relative humidity (RH) conditions. Microbial growth was assessed over time using a combination of visual assessment and quantitative polymerase chain reaction (qPCR). The same samples were also swabbed at the end of the experiments for ITS (fungal) rRNA amplicon sequencing. Additionally, powders from unwetted duplicates of each type of wood were shaved and collected for material chemical composition analysis using reverse phase liquid chromatography with tandem mass spectrometry (RPLC-MS-MS).
Preparation of materials
The names and categorical classification of rot resistance of each wood type utilized are listed in Table 4 68–70. All tested wood materials were cut to 5 cm × 7.5 cm coupons and sterilized by UV. The samples were then naturally inoculated by environmental microbes by leaving the sterilized coupons unprotected in a laboratory setting for ~ 30 days. Next, to simulate what happens after a material comes in direct contact with bulk liquid from a flood or leak, all 30 wood coupons were submerged in tap water for ~ 12 h. Tap water (as compared to distilled water) was chosen to provide more realistic growth from a wetting event. The same laboratory tap water source was used to wet all coupons at the same time. After wetting, each coupon was then placed in individual petri dishes and incubated at room temperature (20–25 °C) inside a static airtight chamber at high RH for ~ 3 weeks to encourage fungal growth. Potassium nitrate salt solutions were used to maintain RH at ~ 94% for the duration of the experiment.
Table 4.
30 types of woods selected for testing.
| Name | Scientific name | Type | Rot resistance68–70 | |
|---|---|---|---|---|
| 1 | Beech | Fagus grandifolia | Hardwood | Slightly or nonresistant |
| 2 | Basswood | Tilia americana | Hardwood | Slightly or nonresistant |
| 3 | Hickory | Carya ovata | Hardwood | Slightly or nonresistant |
| 4 | Quilted Maple | N/A | Hardwood | Slightly or nonresistant |
| 5 | Hard Maple | Acer saccharum | Hardwood | Slightly or nonresistant |
| 6 | African Mahogany* | Khaya spp. | Hardwood | Moderately resistant |
| 7 | Bubinga* | Guibourtia spp. | Hardwood | Moderately resistant |
| 8 | Lovoa* | Lovoa trichilioides | Hardwood | Moderately resistant |
| 9 | Ponderosa Pine | Pinus ponderosa | Softwood | Moderately resistant |
| 10 | Shedua* | Guibourtia ehie | Hardwood | Moderately resistant |
| 11 | Primavera | Roseodendron donnell-smithii | Hardwood | Moderately resistant |
| 12 | Cypress | Taxodium distichum | Softwood | Resistant |
| 13 | Leopardwood | Roupala montana | Hardwood | Resistant |
| 14 | Mesquite | Prosopis glandulosa | Hardwood | Resistant |
| 15 | Spanish Cedar* | Cedrela odorata | Hardwood | Resistant |
| 16 | White Oak | Quercus alba | Hardwood | Resistant |
| 17 | White Oak Quarter Sawn | Quercus alba | Hardwood | Resistant |
| 18 | Walnut Black | Juglans nigra | Hardwood | Resistant |
| 19 | African Padauk* | Pterocarpus soyauxii | Hardwood | Very resistant |
| 20 | Bloodwood | Brosimum rubescens | Hardwood | Very resistant |
| 21 | Chechen* | Metopium brownei | Hardwood | Very resistant |
| 22 | Curupay* | Anadenanthera colubrina | Hardwood | Very resistant |
| 23 | East Indian Rosewood* | Dalbergia latifolia | Hardwood | Very resistant |
| 24 | Granadillo | Platymiscium spp. | Hardwood | Very resistant |
| 25 | Goncalo Alves | Astronium spp. | Hardwood | Very resistant |
| 26 | IPE* | Handroanthus spp. | Hardwood | Very resistant |
| 27 | Monkeypod | Albizia saman | Hardwood | Very resistant |
| 28 | Machiche | Lonchocarpus spp. | Hardwood | Very resistant |
| 29 | Sirari | Guibourtia hymenaeifolia | Hardwood | Very resistant |
| 30 | Tarara Canary Wood | Centrolobium spp. | Hardwood | Very resistant |
*Imported wood as noted on the retailer’s website.
Microbial growth assessment
Microbial growth was assessed using multiple methods. Visual microbial growth was assessed by taking overhead images on a weekly basis during a ~ 3-week incubation period. Image analyses were conducted using ImageJ to estimate the percentage of microbial growth coverage over time using the area fraction option. Additionally, at the end of the incubation period, the surfaces of the coupons were swabbed using sterile polyester swabs for subsequent sequencing and analysis, including ITS for fungal communities and qPCR for fungal quantification using universal primers. Finally, coupon surfaces were also swabbed with cotton-tipped swabs that were dipped in ethanol for subsequent surface chemistry and metabolomics analysis.
DNA extraction, sequencing, and qPCR
The microbial community from each sample was collected by rubbing the tips of sterile polyester swabs along the surface of the coupons. Following sample collection, the swab tips were cut off into DNA extraction tubes (DNeasy Powersoil, Qiagen), and the DNA extracted following the manufacturer’s protocol71 with the following modification to reduce sample loss: combine steps 7 through 10 by adding 150 µL each of solutions C2 and C3 to the tube that the lysed sample was transferred to in step 6. Following a 5-min incubation period at 4 °C, the manufacturer’s protocol is resumed as normal at step 11.
Amplification of the ITS region used the Illumina Earth Microbiome ITS protocol72. Reactions were pooled, cleaned with Agencourt AMPure beads, and then the clean amplicon pool was sequenced at Argonne National Laboratory’s Environmental Sample Preparation and Sequencing Facility, following the Earth Microbiome Protocol73. For PCR cycling the following reaction mix was used: 9.5 μL of molecular biology grade H2O, 12.5 μL of Accustart II PCR Toughmix, 1 μL each of forward and reverse primers at 5 μM, and 1 μL of sample DNA for a total reaction volume of 25 μL. The following PCR program was used: Initial denaturing step at 94 °C for 3 min, followed by 35 cycles of: 94 °C for 45 s, 50 °C for 60 s, and 72 °C for 90 s, followed by a final extension step of 72 °C for 10 min. Sequencing was performed on an Illumina Miseq using V3 chemistry. Fungal amplicons were sequenced using 2 × 300 nt reads.
To quantify the total abundance of fungi, qPCR was performed using a Roche Lightcycler 480 and the SYBR Green I Master kit. Primers targeting the ITS1f.-ITS2 priming sites, without the Illumina adapters or barcodes, were used during amplification. To calculate the abundance for the fungal qPCR, the Femto Fungal DNA Quantification Kit from Zymo was used as a standard control.
Microbial taxonomy identification
ITS Amplicon produced 797,766 reads from 29 of the 30 woods; Leopardwood did not yield any ITS reads. Using DADA245, the reads were clustered and 274 amplicon sequence variants (ASVs) were identified. The closest taxonomy groups were identified by mapping ASVs to the UNITE database46.
Microbial metabolomics and chemical composition analysis
Unwetted samples of each type of wood were shaved into ~ 100 mg of powder using sterile scalpels on the surface. For each sample, 20 mg wood shavings were transferred to an epitube, then 500 μL of 50/50 methanol/water was added, and the sample was vortexed. The mixture was left overnight at room temperature, and on the following day, samples were centrifuged and supernatant was transferred to a fresh epitube. The supernatants were evaporated to dryness and reconstituted in 100 µL LCMS buffer (5% acetonitrile/water + 0.1% formic acid). Ethanol extracts from surface swabs were evaporated to dryness and reconstituted in 200 µL of LCMS buffer. High resolution mass spectrometry analysis was performed according to previously reported procedures23. Analysis of LC–MS/MS data from the microbial swab extracts and the wood shavings was performed with Compound Discoverer 3.0 (Thermo Fisher), which identified metabolites as unique spectral features based on a combination of molecular weight and retention time. The predicted compound hits from Compound Discoverer were filtered to include only those compounds confirmed by both intact mass and MS/MS spectral matching via the mzCloud database. Compounds were identified by their molecular weight and quantified using the compound integrated area.
Statistical analysis
Nonparametric Spearman rank correlations were first used to explore associations between microbial growth and individual compounds identified and quantified in the material shavings. Over 5,000 identified compounds were first ranked by their Spearman correlation coefficients and p-values using Stata version 15 (StataCorp SE, College Station, TX, USA). The top ~ 30 compounds that showed the strongest correlations with microbial/fungal growth outcomes (positive or negative) were then visually inspected, and those with the clearest monotonic relationships were chosen for further analysis.
Additionally, a dissimilarity analysis was conducted using ANOSIM with the entire suite of 5,000 + compounds from the 30 wood species by using PAST (PAleontological Statistics) version 374 to determine if chemical signatures of multiple compounds (instead of just single compounds) were also correlated with microbial growth. In our visible microbial growth dataset, the 30 wood materials were clustered into three groups based on a histogram of visible coverage level (i.e., heavy growth, light growth, and no growth). The ANOSIM statistic, which compares the mean of ranked dissimilarities between groups to the mean of ranked dissimilaristies within groups, was used to determine whether distances between samples of the same growth level were significantly lower than distances between samples of different growth levels.
Single compound inhibitory effects: pilot experiment
Following the analysis of the 30 wood samples, a single compound found in the material composition analysis that was strongly and monotonically correlated with fungal growth was then tested in a pilot chemical dosing experiment to evaluate the potential inhibitory effect of the compound. A new batch of samples of ponderosa pine wood (one of the tested woods shown to be most susceptible to fungal growth) was purchased and cut into 5 cm × 7.5 cm coupons and sterilized by UV. The coupons were naturally inoculated again by leaving them unprotected in a laboratory setting for ~ 30 days (same as before). Pure liquid chemical of a single putatively identified compound (C6 H15 NO) was purchased and mixed with both tap water and distilled water at varying concentrations (by volume), including 0.0001%, 0.001%, 0.01%, 0.1%, and 1%, and controls with 0%. Next, wood coupons were wetted by submerging them into each of the prepared varying concentration mixtures (triplicate coupons at each concentration), covered with aluminum foil, and placed inside a biosafety hood to soak overnight (~ 12 h). The coupons, including a control coupon wetted with sterile water and with none of the dosing compound, were then incubated at room temperature inside the same static airtight chamber at high RH conditions for several weeks (same as before). Microbial growth was evaluated visually on a weekly basis during a ~ 6-week incubation period using the same image processing procedures as described previously.
Supplementary information
Acknowledgements
This work was funded by the Alfred P. Sloan Foundation’s program on the Microbiology of the Built Environment.
Author contributions
J.A.G., B.S., D.Z., S.T.K., P.M.T., and C.H. conceived of the study. D.Z., N.G., and V.J.W. ran experiments and collected data. D.Z., C.C., N.G., V.J.W., and D.A.R. analyzed data. D.Z. and B.S. wrote the original draft. All authors edited and approved the paper.
Data availability
The datasets generated during the current study are available from the corresponding author on reasonable request.
Competing interests
The authors declare no competing interests.
Footnotes
Publisher's note
Springer Nature remains neutral with regard to jurisdictional claims in published maps and institutional affiliations.
Supplementary information
is available for this paper at 10.1038/s41598-020-71560-3.
References
- 1.Kelley ST, Gilbert JA. Studying the microbiology of the indoor environment. Genome Biol. 2013;14:202. doi: 10.1186/gb-2013-14-2-202. [DOI] [PMC free article] [PubMed] [Google Scholar]
- 2.Kembel SW, et al. Architectural design influences the diversity and structure of the built environment microbiome. ISME J. 2012;6:1469–1479. doi: 10.1038/ismej.2011.211. [DOI] [PMC free article] [PubMed] [Google Scholar]
- 3.Rintala H, Pitkäranta M, Toivola M, Paulin L, Nevalainen A. Diversity and seasonal dynamics of bacterial community in indoor environment. BMC Microbiol. 2008;8:56–56. doi: 10.1186/1471-2180-8-56. [DOI] [PMC free article] [PubMed] [Google Scholar]
- 4.Tringe S, et al. The airborne metagenome in an indoor urban environment. PLoS ONE. 2008 doi: 10.1371/journal.pone.0001862. [DOI] [PMC free article] [PubMed] [Google Scholar]
- 5.Chase J, et al. Geography and location are the primary drivers of office microbiome composition. mSystems. 2016;1:e00022. doi: 10.1128/mSystems.00022-16. [DOI] [PMC free article] [PubMed] [Google Scholar]
- 6.Stephens B, et al. Microbial exchange via fomites and implications for human health. Curr. Pollut. Rep. 2019 doi: 10.1007/s40726-019-00123-6. [DOI] [PMC free article] [PubMed] [Google Scholar]
- 7.LBNL. Nature and causes of building dampness. Indoor Air Quality Scientific Findings Resource Bank. https://iaqscience.lbl.gov/dampness-nature (2020).
- 8.Hyvärinen A, Meklin T, Vepsäläinen A, Nevalainen A. Fungi and actinobacteria in moisture-damaged building materials—concentrations and diversity. Int. Biodeterior. Biodegrad. 2002;49:27–37. [Google Scholar]
- 9.Viitanen H, et al. Moisture and bio-deterioration risk of building materials and structures. J. Build. Phys. 2010;33:201–224. [Google Scholar]
- 10.Fischer G, Dott W. Relevance of airborne fungi and their secondary metabolites for environmental, occupational and indoor hygiene. Arch. Microbiol. 2003;179:75–82. doi: 10.1007/s00203-002-0495-2. [DOI] [PubMed] [Google Scholar]
- 11.Miller JD, McMullin DR. Fungal secondary metabolites as harmful indoor air contaminants: 10 years on. Appl. Microbiol. Biotechnol. 2014;98:9953–9966. doi: 10.1007/s00253-014-6178-5. [DOI] [PubMed] [Google Scholar]
- 12.Kazemian N, Pakpour S, Milani AS, Klironomos J. Environmental factors influencing fungal growth on gypsum boards and their structural biodeterioration: a university campus case study. PLoS ONE. 2019;14:e0220556. doi: 10.1371/journal.pone.0220556. [DOI] [PMC free article] [PubMed] [Google Scholar]
- 13.Fisk WJ, Lei-Gomez Q, Mendell MJ. Meta-analyses of the associations of respiratory health effects with dampness and mold in homes. Indoor Air. 2007;17:284–296. doi: 10.1111/j.1600-0668.2007.00475.x. [DOI] [PubMed] [Google Scholar]
- 14.Mendell MJ, Mirer AG, Cheung K, Tong M, Douwes J. Respiratory and allergic health effects of dampness, mold, and dampness-related agents: a review of the epidemiologic evidence. Environ. Health Perspect. 2011;119:748–756. doi: 10.1289/ehp.1002410. [DOI] [PMC free article] [PubMed] [Google Scholar]
- 15.Quansah R, Jaakkola MS, Hugg TT, Heikkinen SAM, Jaakkola JJK. Residential dampness and molds and the risk of developing asthma: a systematic review and meta-analysis. PLoS ONE. 2012;7:e47526. doi: 10.1371/journal.pone.0047526. [DOI] [PMC free article] [PubMed] [Google Scholar]
- 16.Kennedy K, Grimes C. Indoor water and dampness and the health effects on children: a review. Curr. Allergy Asthma Rep. 2013;13:672–680. doi: 10.1007/s11882-013-0393-5. [DOI] [PubMed] [Google Scholar]
- 17.Viitanen H. Factors affecting the development of biodeterioration in wooden constructions. Mater. Struct. 1994;27:483–493. [Google Scholar]
- 18.Pasanen A-L, et al. Fungal growth and survival in building materials under fluctuating moisture and temperature conditions. Int. Biodeterior. Biodegrad. 2000;46:117–127. [Google Scholar]
- 19.Sedlbauer K. Prediction of Mould Fungus Formation on the Surface of and Inside Building Components. Stuttgart: University of Stuttgart, Fraunhofer Institute for Building Physics; 2001. [Google Scholar]
- 20.Nielsen KF, Holm G, Uttrup LP, Nielsen PA. Mould growth on building materials under low water activities. Influence of humidity and temperature on fungal growth and secondary metabolism. Int. Biodeterior. Biodegrad. 2004;54:325–336. [Google Scholar]
- 21.Johansson P, Ekstrand-Tobin A, Svensson T, Bok G. Laboratory study to determine the critical moisture level for mould growth on building materials. Int. Biodeterior. Biodegrad. 2012;73:23–32. [Google Scholar]
- 22.Johansson P, Svensson T, Ekstrand-Tobin A. Validation of critical moisture conditions for mould growth on building materials. Build. Environ. 2013;62:201–209. [Google Scholar]
- 23.Lax S, et al. Microbial and metabolic succession on common building materials under high humidity conditions. Nat. Commun. 2019;10:1767. doi: 10.1038/s41467-019-09764-z. [DOI] [PMC free article] [PubMed] [Google Scholar]
- 24.Schmidt O. Wood and Tree Fungi: Biology, Damage, Protection, and Use. Berlin: Springer; 2006. [Google Scholar]
- 25.Dedesko S, Siegel JA. Moisture parameters and fungal communities associated with gypsum drywall in buildings. Microbiome. 2015;3:1–15. doi: 10.1186/s40168-015-0137-y. [DOI] [PMC free article] [PubMed] [Google Scholar]
- 26.Laks PE, Richter DL, Larkin GM. Fungal susceptibility of interior commercial building panels. For. Prod. J. Madison. 2002;52:41–44. [Google Scholar]
- 27.Hyvärinen A, Meklin T, Vepsäläinen A, Nevalainen A. Fungi and actinobacteria in moisture-damaged building materials—concentrations and diversity. Int. Biodeterior. Biodegradation. 2002;49(1):27–37. doi: 10.1016/S0964-8305(01)00103-2. [DOI] [Google Scholar]
- 28.Hoang CP, Kinney KA, Corsi RL, Szaniszlo PJ. Resistance of green building materials to fungal growth. Int. Biodeterior. Biodegrad. 2010;64:104–113. [Google Scholar]
- 29.Mensah-Attipoe J, Reponen T, Salmela A, Veijalainen A-M, Pasanen P. Susceptibility of green and conventional building materials to microbial growth. Indoor Air. 2015;25:273–284. doi: 10.1111/ina.12140. [DOI] [PubMed] [Google Scholar]
- 30.Coombs K, Vesper S, Green BJ, Yermakov M, Reponen T. Fungal microbiomes associated with green and non-green building materials—PubAg. Int. Biodeterior. Biodegrad. 2017;125:251–257. doi: 10.1016/j.ibiod.2017.07.018. [DOI] [PMC free article] [PubMed] [Google Scholar]
- 31.Flannigan B, Samson RA, Miller JD, Samson RA, Miller JD. Microorganisms in Home and Indoor Work Environments : Diversity, Health Impacts, Investigation and Control. Boca Raton: CRC Press; 2002. [Google Scholar]
- 32.Hosseinaei O, Wang S, Taylor AM, Kim J-W. Effect of hemicellulose extraction on water absorption and mold susceptibility of wood–plastic composites. Int. Biodeterior. Biodegrad. 2012;71:29–35. [Google Scholar]
- 33.Valette N, Perrot T, Sormani R, Gelhaye E, Morel-Rouhier M. Antifungal activities of wood extractives. Fungal Biol. Rev. 2017;31:113–123. [Google Scholar]
- 34.Doussot F, De Jéso B, Quideau S, Pardon P. Extractives content in cooperage oak wood during natural seasoning and toasting; influence of tree species, geographic location, and single-tree effects. J. Agric. Food Chem. 2002;50:5955–5961. doi: 10.1021/jf020494e. [DOI] [PubMed] [Google Scholar]
- 35.Prida A, Puech J-L. Influence of geographical origin and botanical species on the content of extractives in American, French, and East European Oak Woods. J. Agric. Food Chem. 2006;54:8115–8126. doi: 10.1021/jf0616098. [DOI] [PubMed] [Google Scholar]
- 36.Kebbi-Benkeder Z, Colin F, Dumarçay S, Gérardin P. Quantification and characterization of knotwood extractives of 12 European softwood and hardwood species. Ann. For. Sci. 2015;72:277–284. [Google Scholar]
- 37.Gradeci K, Labonnote N, Time B, Köhler J. Mould growth criteria and design avoidance approaches in wood-based materials—a systematic review. Constr. Build. Mater. 2017;150:77–88. [Google Scholar]
- 38.Hennon, P. E., McClellan, M. H. & Palkovic, P. Comparing deterioration and ecosystem function of decay-resistant and decaysusceptible species of dead trees. In USDA For. Serv. Gen Tech Rep PSW-GTR-181 2002 10.
- 39.Lie SK, Vestøl GI, Høibø O, Gobakken LR. Surface mould growth on wooden claddings—effects of transient wetting, relative humidity, temperature and material properties. Wood Mater. Sci. Eng. 2019;14:129–141. [Google Scholar]
- 40.Xu K, Feng J, Zhong T, Zheng Z, Chen T. Effects of volatile chemical components of wood species on mould growth susceptibility and termite attack resistance of wood plastic composites. Int. Biodeterior. Biodegrad. 2015;100:106–115. [Google Scholar]
- 41.Kirker GT, Bishell AB, Lebow PK. Laboratory evaluations of durability of southern pine pressure treated with extractives from durable wood species. J. Econ. Entomol. 2016;109:259–266. doi: 10.1093/jee/tov286. [DOI] [PubMed] [Google Scholar]
- 42.Pometti CL, et al. Durability of five native Argentine wood species of the genera Prosopis and Acacia decayed by rot fungi and its relationship with extractive content. Biodegradation. 2010;21:753–760. doi: 10.1007/s10532-010-9340-5. [DOI] [PubMed] [Google Scholar]
- 43.Thulasidas PK, Bhat KM. Chemical extractive compounds determining the brown-rot decay resistance of teak wood. Holz Als Roh Werkst. 2007;65:121–124. [Google Scholar]
- 44.Johnston WH, Karchesy JJ, Constantine GH, Craig AM. Antimicrobial activity of some Pacific Northwest woods against anaerobic bacteria and yeast. Phytother. Res. 2001;15:586–588. doi: 10.1002/ptr.765. [DOI] [PubMed] [Google Scholar]
- 45.Callahan BJ, et al. DADA2: High resolution sample inference from Illumina amplicon data. Nat. Methods. 2016;13:581–583. doi: 10.1038/nmeth.3869. [DOI] [PMC free article] [PubMed] [Google Scholar]
- 46.Nilsson RH, et al. The UNITE database for molecular identification of fungi: handling dark taxa and parallel taxonomic classifications. Nucleic Acids Res. 2019;47:D259–D264. doi: 10.1093/nar/gky1022. [DOI] [PMC free article] [PubMed] [Google Scholar]
- 47.Andersen B, Dosen I, Lewinska AM, Nielsen KF. Pre-contamination of new gypsum wallboard with potentially harmful fungal species. Indoor Air. 2017;27:6–12. doi: 10.1111/ina.12298. [DOI] [PubMed] [Google Scholar]
- 48.Nevalainen A, Täubel M, Hyvärinen A. Indoor fungi: companions and contaminants. Indoor Air. 2015;25:125–156. doi: 10.1111/ina.12182. [DOI] [PubMed] [Google Scholar]
- 49.Andersen B, Frisvad JC, Søndergaard I, Rasmussen IS, Larsen LS. Associations between fungal species and water-damaged building materials. Appl. Environ. Microbiol. 2011;77:4180–4188. doi: 10.1128/AEM.02513-10. [DOI] [PMC free article] [PubMed] [Google Scholar]
- 50.Adams RI, Miletto M, Taylor JW, Bruns TD. The diversity and distribution of fungi on residential surfaces. PLoS ONE. 2013;8:e78866. doi: 10.1371/journal.pone.0078866. [DOI] [PMC free article] [PubMed] [Google Scholar]
- 51.Holzheimer RG, Dralle H. Management of mycoses in surgical patients—review of the literature. Eur. J. Med. Res. 2002;7:200–226. [PubMed] [Google Scholar]
- 52.de Pauw BE. What are fungal infections? Mediterr. J. Hematol. Infect. Dis. 2011;3:e2011001. doi: 10.4084/MJHID.2011.001. [DOI] [PMC free article] [PubMed] [Google Scholar]
- 53.Bodey G, et al. Fungal infections in cancer patients: an international autopsy survey. Eur. J. Clin. Microbiol. Infect. Dis. Off. Publ. Eur. Soc. Clin. Microbiol. 1992;11:99–109. doi: 10.1007/BF01967060. [DOI] [PubMed] [Google Scholar]
- 54.Kosmidis C, Denning DW. The clinical spectrum of pulmonary aspergillosis. Thorax. 2015;70:270–277. doi: 10.1136/thoraxjnl-2014-206291. [DOI] [PubMed] [Google Scholar]
- 55.Hedayati MT, Mayahi S, Denning DW. A study on Aspergillus species in houses of asthmatic patients from Sari City, Iran and a brief review of the health effects of exposure to indoor Aspergillus. Environ. Monit. Assess. 2010;168:481–487. doi: 10.1007/s10661-009-1128-x. [DOI] [PubMed] [Google Scholar]
- 56.Engelhart S, et al. Occurrence of toxigenic Aspergillus versicolor isolates and sterigmatocystin in carpet dust from damp indoor environments. Appl. Environ. Microbiol. 2002;68:3886–3890. doi: 10.1128/AEM.68.8.3886-3890.2002. [DOI] [PMC free article] [PubMed] [Google Scholar]
- 57.Dagenais TRT, Keller NP. Pathogenesis of Aspergillus fumigatus in invasive aspergillosis. Clin. Microbiol. Rev. 2009;22:447–465. doi: 10.1128/CMR.00055-08. [DOI] [PMC free article] [PubMed] [Google Scholar]
- 58.Lin SJ, Schranz J, Teutsch SM. Aspergillosis case-fatality rate: systematic review of the literature. Clin. Infect. Dis. Off. Publ. Infect. Dis. Soc. Am. 2001;32:358–366. doi: 10.1086/318483. [DOI] [PubMed] [Google Scholar]
- 59.Joshi A, Singh R, Shah MS, Umesh S, Khattry N. Subcutaneous mycosis and fungemia by Aureobasidium pullulans: a rare pathogenic fungus in a post allogeneic BM transplant patient. Bone Marrow Transplant. 2010;45:203–204. doi: 10.1038/bmt.2009.111. [DOI] [PubMed] [Google Scholar]
- 60.Pikazis D, Xynos ID, Xila V, Velegraki A, Aroni K. Extended fungal skin infection due to Aureobasidium pullulans. Clin. Exp. Dermatol. 2009;34:e892–894. doi: 10.1111/j.1365-2230.2009.03663.x. [DOI] [PubMed] [Google Scholar]
- 61.Sandoval-Denis M, et al. New species of Cladosporium associated with human and animal infections. Persoonia Mol. Phylogeny Evol. Fungi. 2016;36:281–298. doi: 10.3767/003158516X691951. [DOI] [PMC free article] [PubMed] [Google Scholar]
- 62.Sandoval-Denis M, et al. Cladosporium species recovered from clinical samples in the United States. J. Clin. Microbiol. 2015;53:2990–3000. doi: 10.1128/JCM.01482-15. [DOI] [PMC free article] [PubMed] [Google Scholar]
- 63.Lombard L, van der Merwe NA, Groenewald JZ, Crous PW. Generic concepts in Nectriaceae. Stud. Mycol. 2015;80:189–245. doi: 10.1016/j.simyco.2014.12.002. [DOI] [PMC free article] [PubMed] [Google Scholar]
- 64.Abdel-Hamid AM, Solbiati JO, Cann IKO. Insights into lignin degradation and its potential industrial applications. Adv. Appl. Microbiol. 2013;82:1–28. doi: 10.1016/B978-0-12-407679-2.00001-6. [DOI] [PubMed] [Google Scholar]
- 65.Han M-L, et al. Taxonomy and phylogeny of the brown-rot fungi: fomitopsis and its related genera. Fungal Divers. 2016;80:343–373. [Google Scholar]
- 66.Leonhardt S, et al. Molecular fungal community and its decomposition activity in sapwood and heartwood of 13 temperate European tree species. PLoS ONE. 2019;14:e0212120. doi: 10.1371/journal.pone.0212120. [DOI] [PMC free article] [PubMed] [Google Scholar]
- 67.Almási É, et al. Comparative genomics reveals unique wood-decay strategies and fruiting body development in the Schizophyllaceae. New Phytol. 2019;224:902–915. doi: 10.1111/nph.16032. [DOI] [PubMed] [Google Scholar]
- 68.Clausen, C. A. Biodeterioration of wood. Wood Handb. Wood Eng. Mater. Chapter 14 Centen. Ed Gen. Tech. Rep. FPL GTR-190 Madison WI US Dept Agric. For. Serv. For. Prod. Lab. 2010 P 141–1416190, 14.1–14.16 (2010).
- 69.Wood Finder|The Wood Database. https://www.wood-database.com/wood-finder/.
- 70.Alans Factory. Building materials—a closer look at different types of wood. https://www.alansfactoryoutlet.com/building-materials-a-closer-look-at-different-types-of-wood.
- 71.Qiagen. DNeasy PowerSoil Kit Handbook (2017).
- 72.ITS Illumina Amplicon Protocol: earth microbiome project. https://press.igsb.anl.gov/earthmicrobiome/protocols-and-standards/its/.
- 73.Caporaso JG, et al. Global patterns of 16S rRNA diversity at a depth of millions of sequences per sample. Proc. Natl. Acad. Sci. 2011;108:4516–4522. doi: 10.1073/pnas.1000080107. [DOI] [PMC free article] [PubMed] [Google Scholar]
- 74.Hammer, O., Harper, D. A. T. & Ryan, P. D. PAST: Paleontological Statistics Software Package for Education and Data Analysis, vol. 9.
Associated Data
This section collects any data citations, data availability statements, or supplementary materials included in this article.
Supplementary Materials
Data Availability Statement
The datasets generated during the current study are available from the corresponding author on reasonable request.


