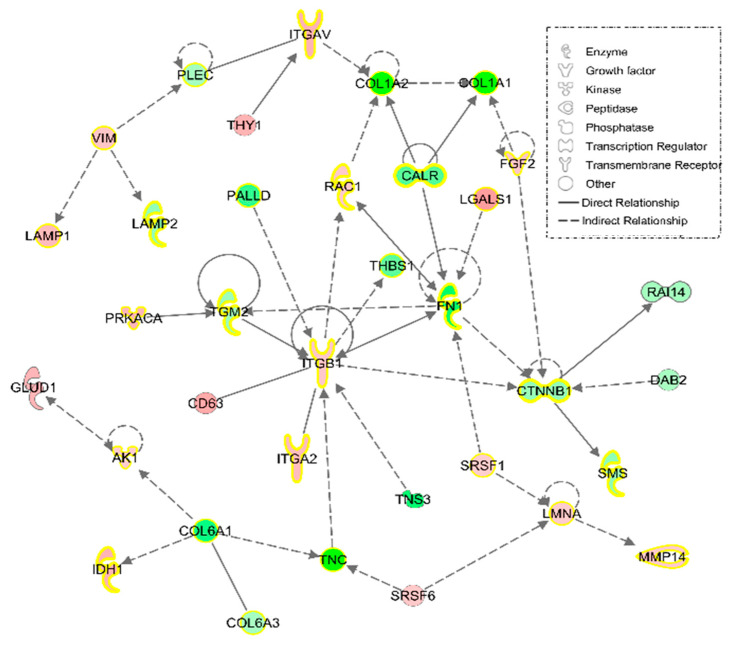
Figure 3.
‘Cell morphology, cellular movement, connective tissue development and function,’ the most representative IPA Network, with 35 proteins differentially expressed in FM fibroblasts. The different intensities of red and green represent overexpression or underexpression state of theses protein in FM fibroblast. Yellow highlighted proteins are those participating in ‘Connective tissue disorders.’

