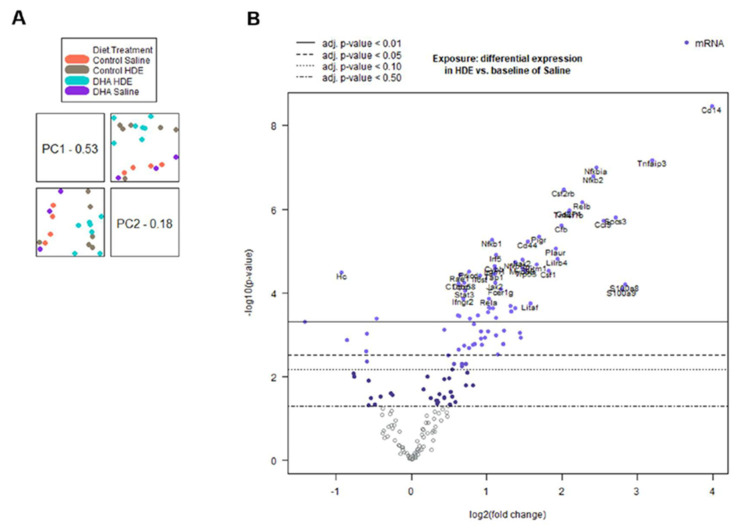
Figure 5.
Principal component analysis and volcano plot of all 20 normalized samples. (A) Principal component analysis (PCA) and PCA scores displaying an overall strong clustering of related biological sample replicates for all 20 samples. (B) Volcano plot of expressed genes for the interaction between HDE and saline exposure among all 20 samples. p-value for volcano plot displayed as adjusted p-value.

