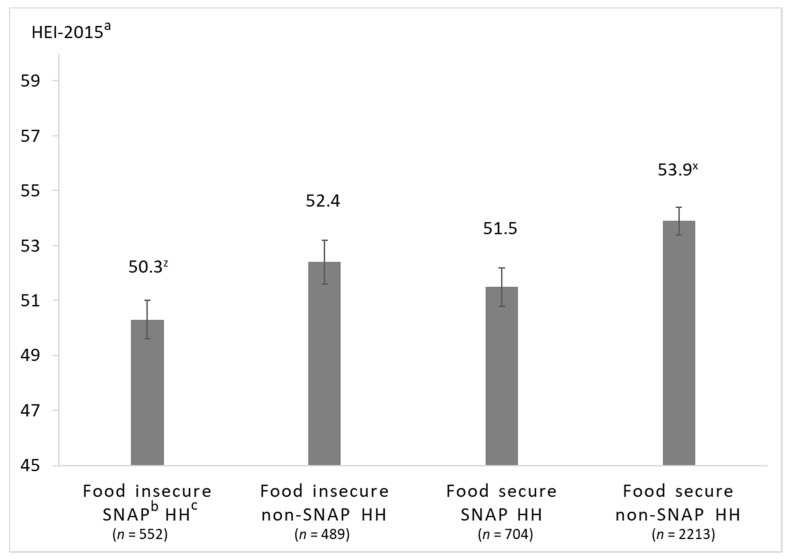
Figure 3.
Multivariable-adjusted least square means of total HEI-2015 score of household grocery purchases among households participating in the National Household Food Acquisition and Purchase Survey 2012–2013, (n = 3958), stratified by food security status and SNAP-participation. a Healthy Eating Index 2015; b Supplemental Nutrition Assistance Program; c household. Adjusted for age of the primary respondent, family income-to-poverty ratio, any smoker in the household, and education level of the primary respondent. Between-group differences were determined by post hoc tests using Tukey’s method, testing all pairwise comparisons. Scores with different superscripted letters (e.g., x and z) indicate significant post hoc differences between groups (p < 0.05).

