

Abstract
Epithelioid glioblastoma (eGBM) is a newly defined and rare GBM variant in the current WHO 2016 classification. BRAF V600E mutation is overrepresented in these tumors and there is known some morphological overlap with anaplastic epithelioid PXA (ePXA). In order to further elucidate this diagnostic category, we molecularly characterized 64 pediatric and adult examples initially diagnosed as “eGBM.” Tumors were analyzed using array based methylation and direct sequencing of the BRAF and TERT genes. Our results demonstrated considerable molecular and clinical heterogeneity among eGBM cohort. Methylation patterns, copy number alterations, and mutational analysis data, in combination with clinical findings disclosed three different, well established tumor subtypes: (i) PXA‐like tumors with favorable prognosis, predominantly in children and young adults (38), (ii) IDHwt GBM‐like tumors with poor prognosis, mainly occurring in older adults, albeit with more frequent BRAF mutations (17), and (iii) RTK1 pediatric GBM‐like neoplasms of intermediate prognosis in children and young adults, associated with chromothripsis and frequent PDGFRA amplifications (9). We conclude that the histopathologically defined eGBM do not represent a single diagnostic entity, but rather at least three molecularly and biologically distinct categories. Therefore, additional molecular testing through genome‐wide molecular profiling is recommended to further stratify these rare cases.
Keywords: cytogenetic prognostic, epithelioid, glioblastoma, methylation, pleomorphic xanthoastrocytoma, subgroup, survival
Introduction
Glioblastoma (GBM) is the most frequent and devastating tumor of the human brain. The 2016 WHO classification added a provisional variant termed “epithelioid glioblastoma” (eGBM), predominantly composed of solid aggregates of epithelioid, melanoma‐like cells with abundant cytoplasm, eccentrically placed nuclei, conspicuous nucleoli and variable “rhabdoid” features 1, 2, 3, 8, 13, 14, 15, 16, 20. It has also been noted that a subset of anaplastic pleomorphic xanthoastrocytomas (aPXA) has similar cytology (ePXA) and the histopathological distinction between these subtypes is often difficult 1, 8, 9, 13, 15, 26. Occasional eGBM arising in a pre‐existing PXA have also been reported 26, with molecular overlap between eGBM and ePXA also being documented 1. In particular, BRAF V600E mutation is frequently detected in both, suggesting that eGBM and ePXA are either the same entity or closely related 1, 6, 8, 9, 13, 14, 15, 16, 22, 27. However, the existence of eGBM as a unique variant, its distinct nosologic position and its relationships with ePXA have not been fully clarified.
In the current study, we analyzed a representative cohort of tumors initially diagnosed as eGBM. We aimed to further stratify this cohort assessed through genome‐wide molecular profiling and to establish if these tumors share common genetic alterations. Instead, we identified three molecular variants based on genomic and epigenetic signatures, associated with distinct clinical outcomes.
Material and Methods
Case selection
Sixty‐four tumors diagnosed initially as epithelioid glioblastoma (eGBM) were received from the Burdenko Neurosurgical Institute, Moscow, Russia; Memorial Sloan Kettering Cancer Center, New York, USA; University of Colorado Health Sciences Center, Denver, CO; and University of California, San Francisco, USA. A small subset of these cases has previously been published 1, 8, 9, 12. All patients had no previous tumor history and their disease presented as the first manifestation of a CNS tumor. All cases were routinely formalin fixed and paraffin‐embedded. Primary diagnosis based on histopathological examination and immunohistochemical (IHC) analyses were made at each local center. A centralized evaluation of all H&E slides was performed in the Department of Neuropathology, University Heidelberg.
Histological diagnosis was based on the current WHO criteria for eGBM 14—an astrocytic glioma with brisk mitotic activity, microvascular proliferation and necrosis, composed in great part of sheets of epithelioid or melanoma‐like cells with loose cohesion, abundant cytoplasm, and eccentric nuclei, sometimes with fibrillar or globular cytoplasmic inclusions (i.e., rhabdoid cytology). A small subset of eGBM cases (n = 19) also included small foci resembling PXA morphology (for details see “Results”). All eGBM exhibited normal INI/SMARCB1 expression, setting these tumors apart from a variant with malignant transformation showing histologic and molecular features resembling atypical teratoid/rhabdoid tumor 14. DNA sequence alterations in IDH1, IDH2, BRAF, and genes encoding histone 3 variants, H3F3A, HIST1H3A, HIST1H3B, HIST1H3C, HIST2H3C, were screened by direct sequencing in all samples 25. In addition, mutational analysis for the promoter region of the TERT gene was performed as previously described 10.
Epigenetic analysis
DNA was extracted from tumors and analyzed using the Illumina HumanMethylation 450 BeadChip (450k) array as previously described 7, 11, 12, 25. All DNA methylation analyses were performed in R version 3.3.0 (R Development Core Team). Raw signal intensities were obtained from IDAT‐files using the minfi Bioconductor package version 1.18.2. Each sample was individually normalized by performing a background correction (shifting of the 5% percentile of negative control probe intensities to 0) and a dye‐bias correction (scaling of the mean of normalization control probe intensities to 10 000) for both color channels. No further normalization or transformation steps were performed, and standard beta‐values were used for downstream methylation analyses. The following criteria were applied to filter out probes prone to yield inaccurate methylation levels: Removal of probes targeting the X and Y chromosomes (n = 11 551), removal of probes that overlap common SNPs (dbSNP132 Common) within the CpG or the following base (n = 7998), and removal of probes not mapping uniquely to the human reference genome (hg19) (n = 3965). To enable comparability with the Illumina Infinium HumanMethylationEPIC array, we also removed probes not represented on this array (n = 32 260). In total, 428,799 probes were kept for analysis. In order to study the relationship between eGBM and other entities, we performed unsupervised clustering of these tumors together with cohorts of defined glial tumors including IDH‐wild type (IDHwt) GBM (adult and pediatric), diffuse midline glioma, H3 K27M‐mutant, and conventional PXA (grade II and grade III).
For unsupervised hierarchical clustering, we selected the 5000 most variably methylated probes across the dataset (s.d.>0.242). Distance between samples was calculated by using 1‐Pearson correlation coefficient as the distance measure. Average linkage was used to generate dendrograms. The same distance matrix was used to perform the t‐SNE analysis (t‐Distributed Stochastic Neighbor Embedding Rtsne package version 0.11 12. The following non‐default parameters were used: theta = 0, is_distance = T, pca = F, max_iter = 10000. Methylation probes in the heatmap representation were reordered by hierarchical clustering using Euclidean distance and average linkage. Copy number profiles were generated using the “conumee” package for R (https://www.bioconductor.org/packages/release/bioc/html/conumee.html) 25. To evaluate the methylation status of the MGMT promoter region, we evaluated beta values of probes cg12434587 and cg12981137 using the MGMT_STP27 logistic regression model 11. In order to confirm 450k results in all tumors with detected amplifications and homozygous deletions, FISH analyses were performed using commercially available probes to human oncogenes EGFR, MYCN, PDGFRA, CDK4, MDM2 and also CDKN2A locus, as described previously 11.
Statistics
The distribution of overall survival (OS) was calculated according to the Kaplan‐Meier method. OS was calculated from the date of histological diagnosis until death of patient from disease or last contact for patients who were still alive. For multivariate analysis, Cox proportional hazards regression models were used. Estimated hazard ratios are provided with 95% confidence intervals and a P‐value from the Wald test. Tests with a P‐value below 0.05 were considered significant.
Results
Clinicopathological data
The median age for the 64 histologically diagnosed eGBM was 25 years (range 3–67 years). The series contained tumors from 33 pediatric patients (younger than 18 years). Male patients predominated—45 (70%) versus 19 (30%) female. Of the tumors, 62 were located in the cerebral hemispheres, while only 2 tumors resided in the cerebellum. Follow‐up data were available for 47 patients. All these patients were treated with surgery (gross total and subtotal removal) followed with radiotherapy and chemotherapy with temozolomide (TMZ). Of these, 37 (79%) patients experienced tumors recurrence (median progression‐free survival (PFS) of 11 months; range 3–38 months). During the follow‐up period, 28 (60%) patients died (median overall survival [OS] of 23 months; range 5–72 months). Local re‐growth was the predominant pattern in recurrences seen in 29 patients; however, 8 patients developed widespread cerebrospinal GBM dissemination.
Central review (A.K.) confirmed an eGBM histopathological patterns (sheets of epithelioid or melanoma‐like cells with loose cohesion, abundant cytoplasm, and eccentric nuclei), in all 64 samples examined. Patterns of brisk mitotic activity, microvascular proliferation and necrosis, with and without palisades were also found in all these tumors. However, focal areas resembling of “anaplastic PXA” appearance were also identified in 19 tumors (focal lack of cytological uniformity with collection of spindled cells forming fascicles, single large bizarre cells, and vacuolated tumor cells, accompanied with perivascular lymphocytic cuffing). However, a lower grade “classic” PXA component containing eosinophilic granular bodies was not detected in these tumors even at least focally. The mean MIB1 labeling index was 48% (range 34%–63%) and did not differ between eGBM with and without PXA‐like component (51% vs. 46%; P = 0.36). CD34 was expressed in tumor vessels only.
Molecular analysis revealed that 36 (56%) cases harbored the BRAF V600E mutation. In addition, 24 (38%) of tumors disclosed pTERT mutations (predominantly C228T variant—23 tumors). Combined BRAF/TERT mutations were found in 15 samples (23%). There were no associations between eGBM with and without focal PXA‐like component and BRAF mutation—51% and 61%, respectively (P = 0.12). However, pTERT mutations were more frequent in the “pure” eGBM – 42% vs. 26% for eGBM with PXA‐like component (P < 0.01). No mutations of IDH1/2 or histone 3 variant genes (H3F3A, HIST1H3A, HIST1H3B, HIST1H3C, HIST2H3C) were detected.
Epigenetic and cytogenetic alterations in eGBM detected with 450k analysis
In order to clarify the distinct biological nature of tumors diagnosed histologically as eGBM, we performed combined unsupervised clustering with a comparable cohort (“comparison cohort”) of various pediatric and adult glial tumors exhibiting clearly established histopathological patterns, and “prototypic” molecular signatures. Our comparison cohort included adult IDHwt GBM (128); pediatric GBM (112), and PXAs grade II (78) and III (44) (Supporting Information Table S2). None of the tumors from this comparison cohort disclosed epithelioid patterns mentioned above and typical for eGBM.
Unsupervised clustering revealed that the 64 GBM with “epithelioid” histology did not form a separate cluster but dissociated among molecular signatures from the tumors of our comparison cohort. However, eGBM were grouped distinctly with three tumor sets from the comparison cohort (Figure 1A): 38 grouped with “prototypic” PXA, 17 grouped together with IDHwt GBM and 9 tumors were clustered together with pediatric GBM with RTK1 signature. These results were also confirmed by t‐SNE analysis (Figure 1B).
Figure 1.
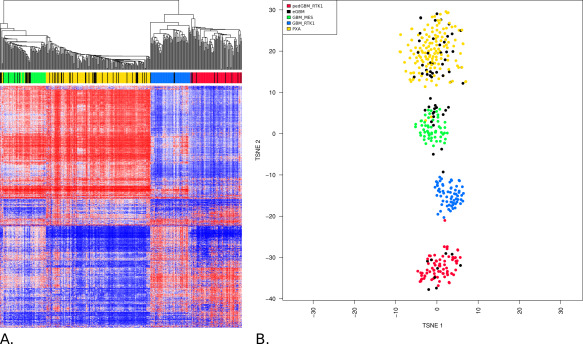
A. Unsupervised hierarchical clustering analysis of eGBM samples (based on the 5000 most variably methylated probes) together with epigenetic profiles generated for various CNS tumors. eGBM (black points) did not form any separate cluster but they were clustered either with “canonical” PXA grade II and III (yellow points), IDHwt GBM (blue and green points) or with pediatric RTK1 GBM (red points). B. Grouping of tumor methylation profiles according to t‐SNE confirms distribution of eGBM among either PXA, adult IDHwt GBM or pediatric RTK1 GBM.
Among the 38 tumors clustered with PXA, only 13 (34%) contained PXA‐like foci. These PXA‐associated “eGBM” showed no oncogene amplifications and a low frequency of 10q loss, although pTERT mutations were common, while CDKN2A homozygous deletions occurred in 23/38 (61%) and BRAF V600E mutations in 30/38 (79%) (Figure 2A,B; Table 1). It should be especially noted that “canonical” PXAs with different malignancy grade did not form separate clusters and all “eGBM” samples were evenly distributed among the grade II and III PXAs.
Figure 2.
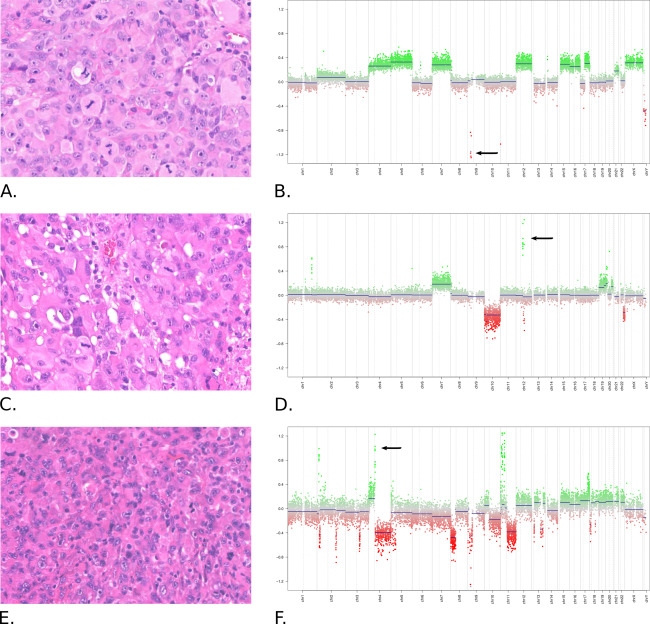
Histopathological (A, C, E) and cytogenetic (B, D, F) patterns of eGBM. All tumors showed similar histopathological “epithelioid” patterns—collections of large melanoma‐like tumor cells with abundant cytoplasm eccentric nuclei. However, these tumors disclosed distinct cytogenetic and epigenetic profiles. A, B. eGBM from “PXA cluster” shows no amplifications, numerous chromosomal gains and CDKN2A homozygous deletion (arrow). C, D. eGBM from “adult IDHwt cluster” discloses amplification of CDK4/MDM2 (arrow), gain of 7 and monosomy 10. E, F. eGBM from “pediatric GBM RTK1 cluster” with amplification of PDGFRA (arrow) and patterns of chromothripsis.
Table 1.
Clinical and molecular variables in eGBM adjusted for various related CNS tumor clusters.
| Variable | Clustered with PXA (n = 38) | Clustered with adult IDHwt GBM (n = 17) | Clustered with pediatric RTK1 GBM (n = 9) |
|---|---|---|---|
| Median age | 17 | 50 | 18 |
| Children* | 55% | 0 | 56% |
| Gender M vs. F | 58%/42% | 94%/6% | 56%/44% |
| PXA‐like foci | 34% | 24% | 22% |
| Median OS | 34 months | 11 months | 18 months |
| Mean MIB1 LI | 47% | 53% | 48% |
| Amplifications | 0 | 25% | 89% |
| CDKN2A homo del | 61% | 53% | 33% |
| 7 gain | 53% | 88% | 30% |
| 10q loss | 28% | 88% | 70% |
| BRAF V600E mut | 79% | 35% | 0 |
| pTERT mut | 30% | 83% | 0 |
| MGMT methyl | 21% | 47% | 33% |
| Chromothripsis | 0 | 0 | 100% |
*Childhood defined as <18 years of age.
Abbreviations: M = male; F = female; OS = overall survival; LI = labeling index; Homo del = homyzygous deletion; Mut = mutation; Methyl = promoter region methylation.
Seventeen “eGBM” (among them 4 with PXA‐like foci) clustered together with IDHwt GBM and this set of epithelioid glial tumors contained adult patients only. Cytogenetic profiles disclosed frequent amplifications of MDM2/MDM4 oncogenes (4/17; 25%) together with additional cytogenetic/molecular patterns that are prototypic of IDHwt GBM as well (e.g., CDKN2A/B homozygous deletions, loss of 10q, gain of 7, frequent mutations of pTERT) (Figure 2C,D; Table 1). However, significant proportion of these IDHwt GBM also disclosed BRAF V600E mutations (6/17; 35%).
Nine “eGBM” mapped to so‐called “pediatric GBM of RTK1 type”: 7 with “pure” eGBM histology and 2 having PXA‐like foci. This group was composed of tumors diagnosed predominantly in children and young adults. Cytogenetic profiles of these eGBM almost homogeneously showed an enrichment for PDGFRA amplification (8/9; 88%), sometimes in combination with MYCN amplification, whereas CDKN2A homozygous deletions were less common (Figure 2E,F; Table 1). Patterns of chromothripsis (numerous inter‐ and intrachromosomal DNA breakpoints) with frequent involvement of various chromosomes were detected in all these tumors. In contrast, pTERT and BRAF mutations were uniformly absent (Table 1).
Survival analysis
Correlation of clinical and/or molecular parameters with patient survival for 47 eGBM revealed few significant associations (Table 2). Univariate OS analysis for clinical and molecular parameters across the whole cohort revealed that older age, presence of any oncogene amplification, 10q deletion and tumors from either the RTK1 pediatric GBM or those adult IDHwt GBM clusters were significantly associated with poor survival. In contrast tumors with BRAF V600E mutation or those clustering together with prototypic PXA disclosed favorable outcomes (Figure 3). However, the presence of a histologically defined focal PXA‐like component alone was not significant for prognosis. Multivariate analysis (including either all variables tested or prognostically significant ones only) did not identify any significant prognostic parameter. This may perhaps be due to the small number of the cases available.
Table 2.
Results of univariate survival analysis for patients with eGBM.
| Variable | Uni HR | P |
|---|---|---|
| Age: > 18 years vs. < 18 years | 6.84 | < 0.01 |
| Gender: male vs. female | 0.64 | 0.42 |
| Tumor resection: GTR vs. STR | 0.58 | 0.26 |
| Presence of PXA‐like foci: yes or no | 0.47 | 0.12 |
| CDKN2A homozygous deletion: yes vs. no | 0.01 | 0.94 |
| Amplifications: yes vs. no | 5.31 | 0.02 |
| BRAF mutation: no vs. yes | 9.54 | < 0.01 |
| 7 gain: yes vs. no | 1.81 | 0.11 |
| 10q loss: yes vs. no | 9.24 | < 0.01 |
| Chromothripsis | 0.14 | 0.71 |
| pTERT mutation: yes vs. no | 1.78 | 0.13 |
| MGMT: methylated vs. unmethylated | 0.01 | 0.96 |
| Cluster PXA vs. IDHwt GBM vs. RTK1 GBM | 28.1 | < 0.01 |
Bold values are statistically significant variables.
Figure 3.
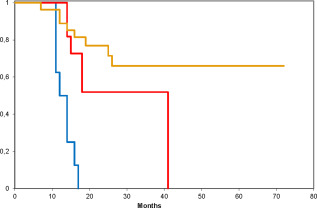
Overall survival for the molecular subtypes of eGBM grouped as 3 separate cohorts. Red line—eGBM clustered with pediatric RTK1 GBM, blue line—eGBM clustered with adult IDHwt GBM, and yellow line—tumors clustered with canonical PXA. All inter‐groups differences are statistically significant (log rank test; P < 0.0001).
Discussion
Epithelioid GBM is a newly defined provisional GBM variant which has been introduced in the current version of the WHO CNS tumor classification 14. Given its rarity, incidence data are not available yet. The biological behavior of eGBM is aggressive and generally similar to other GBM variants; however, occasional long term survivors have been reported 1, 3, 8, 9, 20. eGBM rarely show the prototypic genomic aberrations of IDHwt GBM, such as EGFR amplifications and PTEN mutations, or the typical numerical aberrations of chromosomes 7, 10 and 12. Instead, these tumors exhibit a high frequency of BRAF V600E mutations 1, 8, 9, 20. Moreover, some malignant PXA with epithelioid morphology (ePXA) show considerable clinical, histopathological, and molecular overlap with eGBM, resulting in difficulties when attempting to separate these entities 1. In the current study, we have investigated a large cohort of histologically diagnosed eGBM using genome‐wide DNA methylation profiling by EPIC chip analysis. We compared methylation profiles and detected copy number alterations of these tumors similar to those previously defined as “prototypic” adult and pediatric GBM or PXA with various malignancy grades 10, 11, 12, 24.
The failure of eGBM to cluster as a separate cohort stressed clearly molecular heterogeneity of these otherwise morphologically similar tumors. We previously developed a concept for grouping of various CNS neoplasms based on their methylation profiles which has been successfully applied to identify distinct tumor entities among medulloblastoma, ependymoma, pediatric glioblastoma, peripheral nerve sheath tumors, PNET and meningioma 11, 12, 17, 18, 21, 23, 24, 25, thus supporting the power and reproducibility of this approach. In fact, the observation that eGBM upon unsupervised clustering merge with the methylation groups of canonical PXA, IDHwt GBM and pediatric RTK1 GBM argues against the existence of separate tumor variant. Thus, the finding that eGBM molecularly share high overlap or are indistinguishable from canonical PXA or GBM reduces the biological significance of their epithelioid appearance to a simple morphological pattern, albeit one that may help narrow the differential diagnosis. This pattern represents a visually detectable feature which, so far, does not associate with or cause any differences in tumor biology and clinical behavior when considered in isolation.
In our series, 58% of eGBM disclosed epigenetic patterns similar to canonical PXA without epithelioid histopathology. The molecular patterns within the PXA methylation group do not differentiate between the PXA WHO grade II and the anaplastic PXA WHO grade III, in line with the relative stability of the epigenetic signature and cytogenetic patterns during tumor progression as previously demonstrated for ependymomas 18. Moreover, distinct cytogenetic features of this tumor subgroup with an absence of oncogene amplifications, rarity of 10q losses, and frequent CDKN2A deletions (in combination with frequent BRAF mutation) also match PXA better than GBM. The patients' clinical course, with a median overall survival time of nearly 3 years, also favors anaplastic PXA over GBM 1, 27. Nevertheless, not unexpected due to their high‐grade glioma diagnosis, these tumors exhibited a relatively high recurrence rate. Although being molecularly compatible with PXA, these patients have been treated initially with a GBM protocol according to their initial histological diagnosis. The rather unfavorable PFS may question the efficacy of GBM TMZ‐based treatment protocols for these tumors. A further distinction from adult GBM is the low frequency of MGMT promoter methylation in this PXA‐associated “eGBM” subgroup, possibly responsible for the low efficacy of TMZ‐based therapy 11, 17. Interestingly, these tumors exhibited relatively frequent mutations of pTERT sometimes in combination with BRAF mutations. Such pTERT mutations are rare in canonical PXA, although anaplastic PXA have not often been tested for this alteration 10. To date, the coexistence of BRAF and pTERT mutations has been described in extraneural tumors (melanoma, thyroid cancer) and also in eGBM, but not in other glioma subtypes 15.
Tumors from the second molecular eGBM subgroup (27%) disclosed an obvious cytogenetic similarity to ordinary IDHwt GBM (especially the mesenchymal variant), with epigenetic profiles of these entities clustering in close proximity, thus stressing their molecular overlap 14, 17, 25. The clinical course of patients with these GBM‐associated tumors was highly aggressive, with almost all patients dying within the first two years. Nonetheless, approximately 40% of these eGBM also revealed BRAF V600E mutation, suggesting that this aberration could play a role in their tumorigenesis.
The third clearly distinct eGBM subset (15%) was characterized by a high frequency of PDGFRA amplifications and patterns of intense genome rearrangements (chromothripsis), but a scarcity of other molecular aberrations, including an absence of BRAF and pTERT mutations. These tumors exhibited a rather wide range of clinical outcomes, including a few patients with overall survivals exceeding 2 years. Our attempts to coordinate the epigenetic signatures of this eGBM molecular subset revealed their close relation to “pediatric GBM with RTK1 signature” (enriched with PDGFRA amplification), which were identified recently as a molecular variant of H3/IDHwt high grade gliomas in childhood 12. Herein, we find that these tumors may be encountered in young adults as well. PDGFRA oncogene amplification has been identified as a frequent feature of GBM characterized by gene expression profiling with a “proneuronal” pattern 4, 17, 19. This molecular signature includes expression of genes involved in neurogenesis, which were associated with resistance to therapy 4, 17, 19.
The current parameters for anaplastic PXA correct diagnosis are prone to manifest in very wide range, and, in turn, some histopathological features resembling PXA could be recognized in other malignant gliomas 1, 14, 27. Our current findings that many “eGBM” most closely resemble PXA at the epigenetic and cytogenetic levels correspond well with the challenges encountered by neuropathologists in the differential diagnosis between poorly differentiated, highly anaplastic PXA and GBM. As such, an application of molecular profiling could improve a diagnostic accuracy of these tumors, especially within the limited samples.
One feature common to eGBM and anaplastic PXA is the high incidence of BRAF mutations. On the other hand, epithelioid anaplastic PXA shares this feature with “canonical” PXA 6, 22, 27, although BRAF mutations in prototypic IDHwt GBM are otherwise rare 11, 22, 25. However, this molecular pattern is not useful for further molecular subdivision within eGBM, because a cohort of eGBM with frequent BRAF mutation and a molecular signature similar to IDHwt GBM was currently identified. Perhaps, it may constitute a specific GBM variant, although thus far, the clinical outcomes for these patients appear similar to their counterparts with IDHwt GBMs lacking BRAF mutation 1, 3, 8, 14. However, a more thorough examination of treatment efficacy of specific BRAF V600E inhibitors in BRAF mutant eGBM with IDHwt molecular signature is also clearly warranted in future clinical trials 5, 6, 17.
In conclusion, this study demonstrates considerable molecular and clinical heterogeneity within the eGBM category, as detected by global DNA methylation and CNV analyses. We consider it likely that the “epithelioid” GBM phenotype represents a histologic pattern rather than a variant or entity defining feature. As such, molecular subtyping of such cases could potentially convert these otherwise morphologically similar cases into diagnoses such as “anaplastic PXA with epithelioid features,” “IDHwt GBM with epithelioid features,” “RTK1 pediatric GBM type with epithelioid features”, and so on. Furthermore, molecular stratification through genome‐wide molecular profiling will be essential in the future for determining optimal patient management and placement within appropriate clinical trials.
Supporting information
Additional supporting information may be found online in the Supporting Information section at the end of the article.
Table S1. Clinical and molecular characteristics of epitheliod glioblastoma subset.
Table S2. Clinical and molecular characteristics of pleomorphic xanthoastrocytoma comparative subset.
References
- 1. Alexandrescu S, Korshunov A, Lai SH, Dabiri S, Patil S, Li R et al (2016) Epithelioid glioblastomas and anaplastic epithelioid pleomorphic xanthoastrocytomas ‐ same entity or first cousins? Brain Pathol 26:215–223. doi: 10.1111/bpa.12295. [DOI] [PMC free article] [PubMed] [Google Scholar]
- 2. Babu R, Hatef J, McLendon RE, Cummings TJ, Sampson JH, Friedman AH et al (2013) Clinicopathological characteristics and treatment of rhabdoid glioblastoma. J Neurosurg 119:412–419. doi10.3171/2013.3.JNS121773. [DOI] [PubMed] [Google Scholar]
- 3. Broniscer A, Tatevossian RG, Sabin ND, Klimo P, Dalton J, Lee R et al (2014) Clinical, radiological, histological and molecular characteristics of paediatric epithelioid glioblastoma. Neuropathol Appl Neurobiol 40:327–336. doi10.1111/nan.12093 [DOI] [PMC free article] [PubMed] [Google Scholar]
- 4. Buczkowicz P, Hawkins C (2015) Pathology, molecular genetics, and epigenetics of diffuse intrinsic pontine glioma. Front Oncol 5:147. doi: 10.3389/fonc.2015.00147 [DOI] [PMC free article] [PubMed] [Google Scholar]
- 5. Chamberlain MC (2013) Salvage therapy with BRAF inhibitors for recurrent pleomorphic xanthoastrocytoma: a retrospective case series. J Neurooncol 114:237–240. doi: 10.1007/s11060-013-1176-5. [DOI] [PubMed] [Google Scholar]
- 6. Dias‐Santagata D, Lam Q, Vernovsky K, Vena N, Lennerz JK, Borger DR et al (2011) BRAF V600E mutations are common in pleomorphic xanthoastrocytoma: diagnostic and therapeutic implications. PLoS One 6:e17948. doi: 10.1371/journal.pone.0017948. [DOI] [PMC free article] [PubMed] [Google Scholar]
- 7. Hovestadt V, Remke M, Kool M, Pietsch T, Northcott PA, Fischer R et al (2013) Robust molecular subgrouping and copy‐number profiling of medulloblastoma from small amounts of archival tumour material using high‐density DNA methylation arrays. Acta Neuropathol 125:913–916. doi: 10.1007/s00401-013-1126-5. [DOI] [PMC free article] [PubMed] [Google Scholar]
- 8. Kleinschmidt‐DeMasters BK, Aisner DL, Birks DK, Foreman NK (2013) Epithelioid GBMs show a high percentage of BRAF V600E mutation. Am J Surg Pathol 37:685–698. doi: 10.1097/PAS.0b013e31827f9c5e. [DOI] [PMC free article] [PubMed] [Google Scholar]
- 9. Kleinschmidt‐DeMasters BK, Aisner DL, Foreman NK (2015) BRAF VE1 immunoreactivity patterns in epithelioid glioblastomas positive for BRAF V600E mutation. Am J Surg Pathol 39:528–540. doi: 10.1097/PAS.0000000000000363. [DOI] [PMC free article] [PubMed] [Google Scholar]
- 10. Koelsche C, Sahm F, Capper D, Reuss D, Sturm D, Jones DTW et al (2013) Distribution of TERT promoter mutations in pediatric and adult tumors of the nervous system. Acta Neuropathol 126:907–915. doi: 10.1007/s00401-013-1195-5. [DOI] [PubMed] [Google Scholar]
- 11. Korshunov A, Ryzhova M, Hovestadt V, Bender S, Sturm D, Capper D et al (2015) Integrated analysis of pediatric glioblastoma reveals a subset of biologically favorable tumors with associated molecular prognostic markers. Acta Neuropathol 129:669–678. doi: 10.1007/s00401-015-1405-4. [DOI] [PubMed] [Google Scholar]
- 12. Korshunov A, Schrimpf D, Ryzhova M, Sturm D, Chavez L, Hovestadt V et al (2017) H3‐/IDH‐wild type pediatric glioblastoma is comprised of molecularly and prognostically distinct subtypes with associated oncogenic drivers. Acta Neuropathol 134:507–516. doi: 10.1007/s00401-017-1710-1. [DOI] [PubMed] [Google Scholar]
- 13. Kuroda J‐I, Nobusawa S, Nakamura H, Yokoo H, Ueda R, Makino K et al (2016) A case of an epithelioid glioblastoma with the BRAF V600E mutation colocalized with BRAF intact low‐grade diffuse astrocytoma. Neuropathology 36:181–186. doi: 10.1111/neup.12258. [DOI] [PubMed] [Google Scholar]
- 14. Louis DN, Ohgaki H, Wiestler OD, Cavenee WK (2016) World Health Organization Histological Classification of Tumours of the Central Nervous System, pp. 50–51; 94–99. International Agency for Research on Cancer: France. [Google Scholar]
- 15. Matsumura N, Nakajima N, Yamazaki T, Nagano T, Kagoshima K, Nobusawa S et al (2017) Concurrent TERT promoter and BRAF V600E mutation in epithelioid glioblastoma and concomitant low‐grade astrocytoma. Neuropathology 37:58–63. doi: 10.1111/neup.12318. [DOI] [PubMed] [Google Scholar]
- 16. Nobusawa S, Hirato J, Kurihara H, Ogawa A, Okura N, Nagaishi M et al (2014) Intratumoral heterogeneity of genomic imbalance in a case of epithelioid glioblastoma with BRAF V600E mutation. Brain Pathol 24:239–246. doi: 10.1111/bpa.12114. [DOI] [PMC free article] [PubMed] [Google Scholar]
- 17. Northcott PA, Pfister SM, Jones DT (2015) Next‐generation (epi)genetic drivers of childhood brain tumours and the outlook for targeted therapies. Lancet Oncol 16:e293–e302. doi: 10.1016/S1470-2045(14)71206-9. [DOI] [PubMed] [Google Scholar]
- 18. Pajtler KW, Witt H, Sill M, Jones DTW, Hovestadt Volker, Kratochwil F et al (2015) Molecular classification of ependymal tumors across All CNS compartments, histopathological grades, and age groups. Cancer Cell 27:728–743. doi: 10.1016/j.ccell.2015.04.002. [DOI] [PMC free article] [PubMed] [Google Scholar]
- 19. Puget S, Philippe C, Bax DA, Job B, Varlet P, Junier M‐P et al (2012) Mesenchymal transition and PDGFRA amplification/mutation are key distinct oncogenic events in pediatric diffuse intrinsic pontine gliomas. PLoS One 7:e30313. doi: 10.1371/journal.pone.0030313. [DOI] [PMC free article] [PubMed] [Google Scholar]
- 20. Rodriguez FJ, Scheithauer BW, Giannini C, Bryant SC, Jenkins RB (2008) Epithelial and pseudoepithelial differentiation in glioblastoma and gliosarcoma: a comparative morphologic and molecular genetic study. Cancer 113:2779–2789. doi: 10.1002/cncr.23899. [DOI] [PMC free article] [PubMed] [Google Scholar]
- 21. Röhrich M, Koelsche C, Schrimpf D, Capper D, Sahm F, Kratz A et al (2016) Methylation‐based classification of benign and malignant peripheral nerve sheath tumors. Acta Neuropathol 131:877–887. doi: 10.1007/s00401-016-1540-6. [DOI] [PubMed] [Google Scholar]
- 22. Schindler G, Capper D, Meyer J, Janzarik W, Omran H, Herold‐Mende C et al (2011) Analysis of BRAF V600E mutation in 1,320 nervous system tumors reveals high mutation frequencies in pleomorphic xanthoastrocytoma, ganglioglioma and extra‐cerebellar pilocytic astrocytoma. Acta Neuropathol 121:397–405. doi: 10.1007/s00401-011-0802-6. [DOI] [PubMed] [Google Scholar]
- 23. Sahm F, Schrimpf D, Stichel D, Jones DTW, Hielscher T, Schefzyk S et al (2017) DNA methylation‐based classification and grading system for meningioma: a multicentre, retrospective analysis. Lancet Oncol 18:682–694. doi: 10.1016/S1470-2045(17)30155-9. [DOI] [PubMed] [Google Scholar]
- 24. Sturm D, Orr BA, Toprak UH, Hovestadt V, Jones DTW, Capper D et al (2016) New brain tumor entities emerge from molecular classification of CNS‐PNETs. Cell 164:1060–1072. doi: 10.1016/j.cell.2016.01.015. [DOI] [PMC free article] [PubMed] [Google Scholar]
- 25. Sturm D, Witt H, Hovestadt V, Khuong‐Quang D‐A, Jones DTW, Konermann C et al (2012) Hotspot mutations in H3F3A and IDH1 define distinct epigenetic and biological subgroups of glioblastoma. Cancer Cell 22:425–437. doi: 10.1016/j.ccr.2012.08.024. [DOI] [PubMed] [Google Scholar]
- 26. Tanaka S, Nakada M, Nobusawa S, Suzuki SO, Sabit H, Miyashita K et al (2014) Epithelioid glioblastoma arising from pleomorphic xanthoastrocytoma with the BRAF V600E mutation. Brain Tumor Pathol 31:172–176. doi: 10.1007/s10014-014-0192-2. [DOI] [PubMed] [Google Scholar]
- 27. Vaubel RA, Caron AA, Yamada S et al (2017) Recurrent copy number alterations in low‐grade and anaplastic pleomorphic xanthoastrocytoma with and without BRAF V600E mutation. Brain Pathol [Epub ahead of print; doi:10.1111/ bpa.12495] [DOI] [PMC free article] [PubMed] [Google Scholar]
Associated Data
This section collects any data citations, data availability statements, or supplementary materials included in this article.
Supplementary Materials
Additional supporting information may be found online in the Supporting Information section at the end of the article.
Table S1. Clinical and molecular characteristics of epitheliod glioblastoma subset.
Table S2. Clinical and molecular characteristics of pleomorphic xanthoastrocytoma comparative subset.