

Abstract
Skeletal muscle atrophy is associated with disease, aging, and disuse. Hindlimb unloading (HU) in animals provides an experimental model to study muscle atrophy. A comprehensive time course for how HU affects biomarkers of protein synthesis and degradation acutely and chronically and the associated resistance to an anabolic stimulus following disuse remain undocumented. Sixteen-week-old C57BL/6 mice underwent 0, 1, 12, 24, 72, 168, or 336 h of HU. Following 336 h of HU, mice were reloaded for 1, 24, or 72 h. Another group of mice underwent 120 h of HU, were fasted or refed, and were then compared with similar condition control animals (CTL). Protein content and phosphorylation of biomarkers of protein synthesis, degradation, and autophagy were assessed in the soleus muscle. Gastrocnemius, soleus, and plantaris muscles atrophied within 120 h of HU. Protein synthesis trended toward decrease following 24 h of HU. p70S6K phosphorylation and protein synthesis increased with reloading. Following HU, changes in MAFbx and DEPTOR expression and DEPTOR phosphorylation were consistent with development of a catabolic state. DEPTOR expression recovered following reloading. Animals that underwent 120 h of HU exhibited attenuation of refeeding-induced p70S6K phosphorylation compared with CTL counterparts. Following 120 h of HU, protein synthesis, eukaryotic translation initiation factor 4E-binding protein 1 (4E-BP1) phosphorylation, and DEPTOR, MAFbx, and Sestrin1 expression indicated a catabolic state. Following 120 h of HU, autophagy markers, including p62 expression, REDD1 expression, LC3 ratio, and Unc-51-like autophagy-activating kinase 1 (ULK1) phosphorylation, indicated impaired autophagy. HU promotes a deleterious balance between protein synthesis and degradation. The time course herein provides scientists information about when the associated biomarkers become affected.
NEW & NOTEWORTHY Hindlimb unloading causes significant skeletal muscle atrophy by adversely affecting the balance between protein synthesis and breakdown. This study demonstrates a more complete time course for changes in biomarkers associated with protein synthesis and breakdown and investigates the associated anabolic resistance to an anabolic stimulus following hindlimb unloading. These data in concert with information from other studies provide a basis for designing future experiments to optimally interrogate a desired cellular biomarker or pathway.
Keywords: anabolic resistance, disuse atrophy, hindlimb suspension, hindlimb unloading, skeletal muscle
INTRODUCTION
Skeletal muscle is unique in that it adapts or shows plasticity toward diverse stimuli. For instance, when humans participate in resistance or endurance exercise training, skeletal muscle can undergo growth or hypertrophy (38, 44). More concerning, however, is skeletal muscle loss, or atrophy, which occurs with microgravity (18), disuse (43), cancer (8), and aging (55). Not surprisingly, the skeletal muscle loss associated with aging is also associated with decline in function (30). Therefore, it is paramount to understand the mechanisms that mediate skeletal muscle atrophy to attempt to mitigate functional declines associated with aging or disuse.
Methods commonly used to promote and interrogate skeletal muscle atrophy include bedrest in humans (33) and hindlimb unloading in animals (50). Hindlimb unloading unfavorably alters the rate of protein synthesis as well as proteolysis, or protein breakdown, to induce muscle wasting (5, 19). In this regard, several studies have demonstrated decreased skeletal muscle protein synthesis (35, 50) and increased proteolysis (4) during hindlimb unloading. When the magnitude of the increase in protein synthesis is dampened and/or proteolysis becomes exaggerated compared with control under a given stimuli, it is referred to as anabolic resistance (10). For instance, nutrient consumption or resistance exercise promotes increased protein synthesis; however, this response is blunted with aging. Indeed, anabolic resistance is a major contributor to skeletal muscle atrophy (29). Although the gross measurements of protein synthesis and proteolysis are insightful, understanding the molecular mechanisms that regulate these processes provides novel targets for possible therapeutic intervention.
DEP domain-containing mTOR-interacting protein (DEPTOR; also known as DEPDC5) is a component of and acts to repress both mechanistic target of rapamycin complex 1 and 2 (mTORC1 and mTORC2, respectively) (46) and, therefore, is a unique biomarker associated with skeletal muscle atrophy. Dissociation of DEPTOR from either mTOR complex leads to enhanced mTOR kinase activity and enhanced phosphorylation of downstream substrates (42). For example, in C2C12 myoblasts, DEPTOR knockdown leads to increased phosphorylation of both ribosomal protein S6 kinase-β1 (p70S6K1), a mTORC1 substrate, and proline-rich Akt substrate of 40 kDa (PRAS40), a mTORC2 substrate, in association with upregulated protein synthesis, cell proliferation, and differentiation (24). Moreover, the loss of muscle mass and suppression of muscle protein synthesis following 3 days of hindlimb immobilization is blunted in the gastrocnemius of DEPTOR knockdown compared with control mice (24).
Muscle RING finger 1 (MuRF1) and muscle atrophy F-box (MAFbx) are unique E3 ubiquitin ligases that are upregulated during atrophic conditions, and when these genes are disrupted, mice are resistant to atrophy (6). Similarly, the Sestrin protein family (31), specifically Sestrin1 (57) and Sestrin2 (27), inhibits mechanistic target of rapamycin in complex 1 (mTORC1) activation, thereby decreasing protein synthesis. Changes in mRNA or protein expression in autophagy biomarkers, including nucleoporin 62 [p62; also known as sequestosome 1 (SQSTM1)], Unc-51-like autophagy-activating kinase 1 (ULK1), and light chain 3B (LC3B), can also be indicative of skeletal muscle atrophy, as their regulation becomes aberrant under atrophic conditions (45). Furthermore, although indirectly related to autophagy, regulated in development and DNA damage-1 (REDD1) is also a repressor of mTORC1 and contributes to skeletal muscle atrophy. Developing a time course for the aforementioned markers would allow scientists to study a given marker at the most appropriate time.
Although many mechanisms contributing to skeletal muscle atrophy have been identified (5, 7, 19), an encompassing time course characterizing protein synthesis and degradation and alterations in the associated molecular markers do not exist. A number of studies have investigated the effect of hindlimb unloading (HU) on protein synthesis and/or degradation, but most investigations assessed a limited number of time points, e.g., 3, 7, 14, and 28 days, or have additional stimuli (4, 34, 36, 53). As a result, a study delineating both the acute and chronic effects of HU on the molecular mechanisms controlling muscle mass is necessary. Furthermore, given the robust anabolic effect of nutrient consumption on protein synthesis and degradation, the anabolic response to nutrient consumption can be used to assess the development of anabolic resistance following a period of hindlimb suspension. The current investigation seeks to establish a time course for the magnitude of change in atrophy and the associated molecular markers following varying periods of hindlimb unloading and recovery and to establish how a period of hindlimb unloading affects anabolic resistance.
METHODS
Animals
The animal facilities and experimental protocols were reviewed and approved by the Institutional Animal Care and Use Committee of The Pennsylvania State University College of Medicine. Sixteen-week-old male, C57BL/6 mice (∼30 g) were obtained from Charles River Laboratories (Wilmington, MA) and maintained on a reverse 12:12-h light-dark cycle (lights were turned on at 2200 and turned off at 1000) for ≥7 days in a temperature-controlled (23°C) environment before experimentation with a standard diet (Rodent Chow 8604; Envigo Teklad, Madison, WI) and ad libitum water that were not monitored except when fasting and refeeding. Notably, the effect of altering the circadian rhythm of the animals was not explored in this investigation but warrants future investigation.
Experimental Design
Time course experiment.
Following 1 wk of acclimation, mice (sample size denoted in the figure captions and in results) underwent hindlimb unloading (HU), as previously described (50). Animals were anesthetized with 2% isoflurane to attach tail harnesses. Nonirritant adhesive was applied around the tail and attached to porous athletic tape. The athletic tape was attached to the base of the tail on each lateral side (∼2.54 cm of contact on the tail) and extended ∼15 cm, and each end of the tape was connected and joined to a paper clip. The animal recovered from anesthesia and wore the harness for 24 h while ambulating normally. Zero-hour time point animals were euthanized thereafter; however, starting at the 0-h time point, the paper clip of the harness was attached to an overhead swivel apparatus that was connected to a steel bar bisecting the top of the cage. Once attached, the animals’ hindlimbs were suspended so that they could not contact the floor of the cage, resulting in disuse of the hindlimbs and an ∼30° head-down tilt. The swivel system allowed nearly complete movement around the cage with the forelimbs but prevented the animal from resting its hindlimbs on the wall. The system did not inhibit the mice from eating, drinking, or grooming.
Mice were suspended for 0, 1, 12, 24, 72 (3 days), 168 (7 days), and 336 h (14 days), or mice were suspended for 336 h before being released from their harness and allowed to reload (R) for 1, 24, or 72 h through normal ambulation. Animals ate and drank ad libitum until tissue collection. When each respective time point arrived, mice were weighed and administered puromycin dihydrochloride (AG Scientific, San Diego, CA) in saline (0.040 µmol puromycin/g body wt) via intraperitoneal injection and given 30 min for puromycin incorporation to allow estimation of the rate of protein synthesis via the SUnSET method (47). At 0, 1, 12, 24, 72, 168, and 336 h of hindlimb suspension, animals were anesthetized while they were unloaded to ameliorate undesired consequences of reloading the hindlimb and removed from the hindlimb unloading apparatus; tissues were then collected under anesthesia, and the animals were humanely euthanized. Similarly, at 1R, 24R, and 72R, mice were anesthetized, tissues collected under anesthesia, and the mice were humanely euthanized. Importantly, tissue collection began at the beginning of the dark cycle. During tissue collection, the gastrocnemius, plantaris, and soleus from each hindlimb were carefully excised, cleaned of blood, fat, and connective tissue, weighed, snap-frozen in liquid nitrogen, and stored at −80°C until follow-up analyses.
Fasted and refeed experiment.
Following 1 wk of acclimation, mice (sample size denoted in the figure caption) underwent hindlimb unloading (HU) for 120 h (5 days); 120 h was chosen to add an additional time point to the time course and because the majority of molecular alterations found in the time course experiment occurred by 72 h. HU was conducted as previously described; however, control (CTL) mice were housed in the same cage with HU mice but separated from the unloaded mice by a perforated sheet of plexiglass. As previously described (49), mice were fasted overnight for 16 h, and then half of the mice were allowed to refeed ad libitum for 30 min. At the end of the refeeding period, protein synthesis was assessed via the SUnSET method, as described above. Mice were anesthetized, tissues were collected, and the mice were euthanized in an manner identical to the time course experiment.
Tissue Processing for Western Blotting
The soleus muscle was homogenized in 10 µL/mg of tissue in buffer containing 50 mmol/l HEPES (pH 7.4), 0.1% Triton X-100, 4 mmol/L EGTA (pH 8.0), 10 mmol/L EDTA (pH 8.0), 50 mmol/L Na4P2O7, 100 mmol/L β-glycerophosphate, 25 mmol/L NaF, 5 mmol/L NaVO4, and 10 μL/mL protease inhibitor cocktail (cat. no. P8340; Sigma-Aldrich). Samples were centrifuged at 10,000 g for 10 min at 4°C, the supernatant was transferred to a new tube, and protein was quantified by a Bradford Assay. Protein amount was standardized across samples, mixed with an equal volume of 2× SDS sample buffer, and loaded onto gels equally. Immunoblot targets were resolved by SDS-PAGE on either Criterion TGX precast gels (Bio-Rad, Hercules, CA) or 10% polyacrylamide gels, as previously described (2, 21). Proteins in the gels were transferred to PVDF membranes for 2 h at 0.25 A. The membrane was stained using a Pierce Reversible Protein Stain Kit (cat. no. 24585; Thermo Scientific, Waltham, MA) and then destained according to the manufacturer’s instructions. The membranes were then blocked in 5% nonfat dry milk in Tris-buffered saline with Tween-20 (TBST) and incubated overnight with primary antibody in TBST at 4°C. Primary and secondary antibodies used are presented in Supplemental Table S1 (available online at https://doi.org/10.6084/m9.figshare.12230963). Following overnight incubation, the membrane was washed in TBST, and the appropriate secondary antibody in TBST was placed on the membrane and incubated at room temperature for 1 h. The membrane was washed in TBST thereafter, and the antigen-antibody interaction was visualized with Clarity Western ECL Substrate (cat. no. 1705060; Bio-Rad). Blots were quantified using ImageJ Software (National Institutes of Health, Bethesda, MD). For quantification, relative protein phosphorylation was calculated by dividing protein phosphorylation by the abundance of the respective protein, or, when phosphorylation was not measured, protein abundance was normalized to total protein as determined by staining the blot with Pierce Protein Stain and assessing the staining density of the whole lane.
Statistical Analyses
Statistics were run using SPSS version 26.0 (IBM, Armonk, NY) or Graphpad Prism version 8.3 (GraphPad Software, San Diego, CA). Shapiro-Wilk testing was used to determine normality for all dependent variables. Levene’s test for equality of variances was determined to ensure equal variances.
For the time course experiment, two ANOVA tests were conducted for each dependent variable. An ANOVA test was conducted, encompassing time points between 0 h and 336 h of HU, and another ANOVA test was conducted, encompassing time points between 336 h and 72R [72 h of reloading (R)]. If a significant ANOVA was observed, then a Tukey post hoc test was performed to determine which time points were significantly different from 0 h or 336 h for each respective analysis. Molecular markers are normalized to the 0-h timepoint.
For the fasted and refeed experiment, t tests were conducted to determine body weight and muscle mass differences, and a mixed factorial ANOVA test was conducted, whereby the between-subject factors were condition [control (CTL), hindlimb unloading (HU)] and refeed (fasted, refeed). If a significant interaction was observed, then a Tukey post hoc test was conducted to determine which group was significantly different. Molecular markers are normalized to HU fasted. All data are presented as means ± SD, and α-level was set at P < 0.050.
Normality was not violated for t tests and was seldom violated for ANOVA tests; however, data were not transformed due to the robustness of the ANOVA test, and the majority of the groups within an analysis did not violate this assumption. Levene’s test was violated for the following molecular markers for the test course experiment: relative p70S6K and MAFbx; and for the fasted and refeed experiment: relative p70S6K, relative eukaryotic translation initiation factor 4E-binding protein 1 (4E-BP1), MAFbx, relative ULK1, and REDD1. However, these data were not transformed due to the robustness of the ANOVA test.
Outliers were removed by using the ROUT method with a Q value set to 0.5% and when the value was also ± 2 SD from the mean. Outliers are noted individually in the figure captions.
RESULTS
Time Course Experiment
To elucidate the time course of hindlimb unloading (HU), statistical comparisons were made by analyzing the variance from 0 to 336 h of HU. To assess the impact of reloading, comparisons were made from 336 h of HU to 72R (72 h of reloading). For clarity, unless otherwise stated, the P value listed is following a Tukey post hoc test. Body mass exhibited a gradual decline during HU and became significantly less than the control animals by 72 h (P < 0.050). However, following 336 h of HU, hindlimb reloading did not affect body mass (ANOVA P = 0.693; Fig. 1A). Similar to body mass, the mass of the gastrocnemius (Fig. 1B), plantaris (Fig. 1C), and soleus (Fig. 1D) muscles gradually declined over the 336 h of HU, becoming statistically significant by 72 h for gastrocnemius and 168 h for the other two muscles (P < 0.050). Interestingly, reloading for up to 72 h had no effect on either gastrocnemius or soleus mass, whereas plantaris muscle mass was greater following 1 and 72 h of hindlimb reloading (P < 0.050; Fig. 1C). In a secondary analysis comparing time points 0, 1R, 24R, and 72R using an ANOVA, all reloading time points for each analyzed muscle were significantly different from 0 h, suggesting that no muscle recovered completely to basal mass with 72 h of reloading.
Fig. 1.

Time course for body and muscle mass changes following hindlimb unloading (HU) and subsequent hindlimb reloading (R) after 336 h of HU. Body mass (A), gastrocnemius muscle mass (B), plantaris muscle mass (C), and soleus muscle mass (D) were assessed. *P < 0.05 compared with 0 h; #P < 0.05 compared with 336 h. Open bars, HU timepoints; gray bars, reloading timepoints; hatched bars, 336 h, given that this time point was part of both the HU and reloading statistics. One outlier was excluded from the 72R group in A, and the sample size was 6–8/group. Data are represented as means ± SD.
Notably, muscle masses were also normalized to tibia length (Supplemental Fig. S1 (available online at https://doi.org/10.6084/m9.figshare.12227252). Tibia length (Supplemental Fig. S1A) was used as the standardizing measure, given that this metric did not change with HU (ANOVA P > 0.050), unlike body weight (Fig. 1A). Relative gastrocnemius muscle mass was lower following 72 h of HU and was unaffected by reloading (Supplemental Fig. S1B). Relative plantaris muscle mass tended to be lower following 168 h of HU (P = 0.068) and was lower following 336 h of HU (P < 0.050). Furthermore, relative plantaris muscle mass tended to increase following 1 h of hindlimb reloading (P = 0.055) and increased following 72 h of reloading (P < 0.050; Supplemental Fig. S1C). Relative soleus muscle mass was lower following 72, 168, and 336 h of HU (P < 0.050; Supplemental Fig. S1D). Importantly, when muscle masses were normalized to tibia length, results nearly identical to absolute muscle masses were produced. Indeed, when each muscle’s absolute mass was correlated to each muscle’s relative muscle mass, the coefficients of determination for gastrocnemius (R2 = 0.978), plantaris (R2 = 0.977), and soleus (R2 = 0.995) are extremely high, suggesting that the measures are highly indicative of one another. The sample size was 6–8/group in Fig. 1, A–D and Supplemental Fig. S1, A–D.
To delineate the effect of HU and reloading on muscle protein synthesis, the incorporation of puromycin into protein in the soleus muscle, i.e., the SunSET method (47), was utilized. As shown in Fig. 2A, protein synthesis exhibited a gradual decline during the initial 24 h of HU, followed by a restoration to the control value by 336 h (ANOVA P = 0.042); however, no individual time point was significantly different when compared with 0 h (P > 0.050). Of note is that protein synthesis trended to be attenuated by 24 h of HU (P = 0.099; designation not shown). Compared with 336 h of HU, puromycin incorporation was greater after 72 h of reloading (P < 0.050; Fig. 2A). As an index of changes in mTORC1 activity, alterations in the phosphorylation of two direct substrates of the kinase, p70S6K1 and 4E-BP1, were assessed. The pattern of changes in relative p70S6K phosphorylation on T389 [p-p70S6K(T389)/p70S6K total] was similar to HU-induced alterations in protein synthesis, and the changes were significant as assessed by ANOVA (P = 0.032); however, post hoc comparisons revealed no individual time point that was significantly different when compared with 0 h (P > 0.050). Notably, relative p70S6K phosphorylation was greater after 24 and 72 h of reloading compared with 336 h of HU (P < 0.050; Fig. 2B). In contrast, relative 4E-BP1 phosphorylation on S65 [p-4E-BP1 (S65)/4E-BP1 total] was unaltered by either HU (ANOVA P = 0.153) or 72 h of hindlimb reloading, although there was a trend toward increased phosphorylation during the recovery period (ANOVA P = 0.058; Fig. 2C). The sample size was 7–8/group in Fig. 2, A and B, 5–6/group in Fig. 2C.
Fig. 2.

Time course for changes in molecular markers associated with protein synthesis activation. Puromycin incorporation relative to the total amount of protein (A), relative p70S6K phosphorylation on T389 (B), and relative 4E-BP1 phosphorylation on S65 (C) were measured. #P < 0.05 compared with 336 h. Open bars, HU time points; gray bars, reloading time points; hatched bars, 336 h, given that this time point was part of both the HU and reloading statistics. One outlier was excluded from the 0 group in B. The sample size was 7–8/group in A and B and 5–6/group in C. Data are represented as means ± SD.
In the soleus muscle, compared with 0 h of HU, total DEPTOR protein abundance was higher following 72 and 168 h of HU but returned to the control value at 336 h (P < 0.050; Fig. 3A). DEPTOR abundance was not acutely affected by reloading but was significantly different from the 336-h HU control after 72 h of reloading (P < 0.050). To determine whether changes in DEPTOR abundance were associated with alterations in its phosphorylation, the proportion of DEPTOR in hyperphosphorylated forms was assessed by changes in electrophoretic mobility. As shown in Fig. 3B, DEPTOR phosphorylation was acutely but transiently suppressed during HU (12 h; P < 0.050) and was unaltered by 72 h of hindlimb reloading (ANOVA, P = 0.249). The abundance of another protein that acts to modulate mTORC1 signaling, Sestrin1, was unaltered by 336 h of HU (ANOVA P = 0.441) but was upregulated (ANOVA P < 0.001) after 24 and 72 h of hindlimb reloading (P < 0.050; Fig. 3D). MAFbx protein abundance was higher following 24 h compared with 0 h of HU (P < 0.050). MAFbx abundance was unaltered by 72 h of hindlimb reloading (ANOVA P = 0.942; Fig. 3E). The sample size was 7–8/group in Fig. 3, A, B, and D, and 4/group in Fig. 3E.
Fig. 3.

Time course for changes in molecular markers associated with mechanistic target of rapamycin complex 1 (mTORC1) inhibition. Relative DEP domain-containing mTOR-interacting protein (DEPTOR) abundance (A), DEPTOR phosphorylation as assessed by top bands, excluding the fastest migrating form, relative to total DEPTOR (B), representative DEPTOR Western blot (C), relative Sestrin1 (D), and relative muscle atrophy F-box (MAFbx; E) abundance were assessed. *P < 0.05 compared with 0 h; #P < 0.05 compared with 336 h. Open bars, HU time points; gray bars, reloading timepoints; hatched bars, 336 h, given that this time point was part of both the HU and reloading statistics. One outlier was excluded from the 24R group in A. The sample size was 7–8/group in A, B, and D and 4/group in E. Data are represented as means ± SD.
Refeeding
Given that the majority of the significant differences within the time course experiment occurred between 72 and 168 h of hindlimb unloading (HU), the subsequent refeeding study was conducted midway between the two timepoints, i.e., 120 h of HU. Using 120 h of HU also adds another time point to this investigation to allow for a more refined resolution of temporal changes in muscle mass and molecular changes. Notably, food consumption did not differ between the two groups (CTL: 0.470 ± 0.128 g; HU; 0.546 ± 0.248 g; P = 0.453). The change in body mass was not different between CTL and HU (P = 0.122) (Fig. 4A); nonetheless, gastrocnemius (P < 0.001; Fig. 4B), plantaris (P = 0.002; Fig. 4C), and soleus (P = 0.025; Fig. 4D) absolute muscle masses were lower following 120 h of HU compared with control animals. The sample size was 14 for HU and 16 for CTL in Fig. 4A and 16/group in Fig. 4, B–D.
Fig. 4.
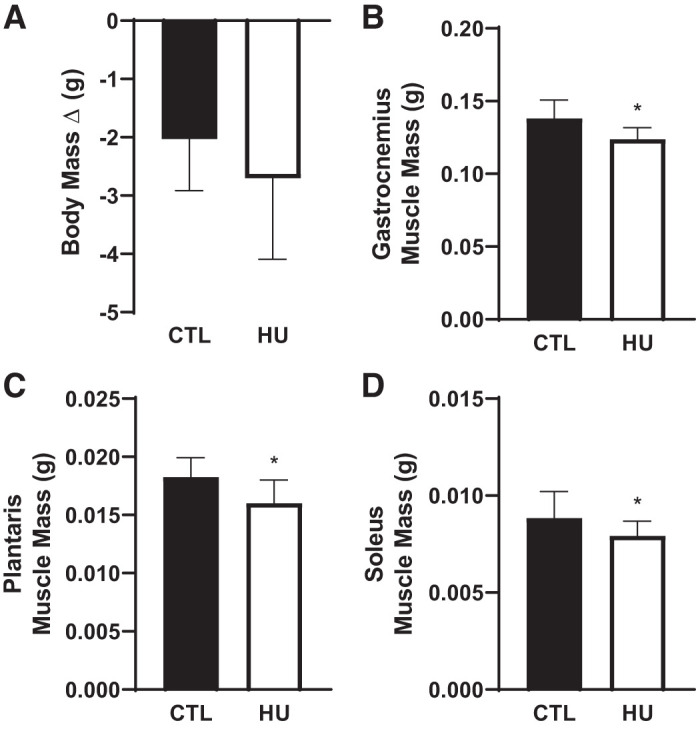
Body and muscle mass changes following 120 h of hindlimb unloading (HU) compared with control (CTL). Body mass (A), gastrocnemius muscle mass (B), plantaris muscle mass (C), and soleus muscle mass (D) were assessed. *P < 0.05 compared with CTL. Black bars, CTL; open bars, HU. The sample size was 14 for HU and 16 for CTL in A and 16/group in B, C, and D. Data are represented as means ± SD.
Protein synthesis was lower in HU animals (P < 0.001) and elevated following refeeding (P = 0.048; Fig. 5A). Relative p70S6K phosphorylation exhibited an interaction (P = 0.020), whereby CTL refeed was higher than CTL fasted, HU fasted, and HU refeed (P < 0.050; Fig. 5B). Importantly, although refeeding upregulated p70S6K1 phosphorylation in control mice, it had no effect in HU animals. ANOVA revealed a significant difference in relative 4E-BP1 phosphorylation between HU and control mice (P = 0.006) and an upregulation following refeeding (P < 0.001; Fig. 5C). However, there was no interaction in relative 4E-BP1 phosphorylation, suggesting that there was no difference between HU and control animals in their response to refeeding. The sample size was 7–9/group in Fig. 5, A and C, and 6–8/group in Fig. 5B.
Fig. 5.

Effect of fasting and refeeding after 120 h of hindlimb unloading (HU) on molecular markers associated with protein synthesis activation. Puromycin incorporation relative to total protein (A), relative p70S6K phosphorylation on T389 (B), and relative eukaryotic translation initiation factor 4E-binding protein 1 (4E-BP1) phosphorylation on S65 (C) were measured. Accompanying statistics are below each graph, and differing letters denote significant differences. Black bars, CTL; open bars, HU. The sample size was 7–9/group in A and C and 6–8/group in B. Data are represented as means ± SD.
The protein abundance of REDD1 (P = 0.001; Fig. 6A), Sestrin1 (P = 0.040; Fig. 6B), and DEPTOR (P = 0.012; Fig. 6C) was elevated following 120 h of HU compared with CTL, but the abundance of all three proteins was unaffected by 30 min of refeeding. In contrast, DEPTOR phosphorylation was unaffected by HU but was elevated after refeeding (P < 0.001; Fig. 6D). The sample size was 6–7/group in Fig. 6A, 8/group in Fig. 6B, and 7–8/group in Fig. 6, C and D.
Fig. 6.

Effect of fasting and refeeding after 120 h of hindlimb unloading (HU) on molecular markers associated with mechanistic target of rapamycin complex 1 (mTORC1) inhibition. Relative regulated in development and DNA damage-1 (REDD1; A), Sestrin1 (B), relative DEP domain-containing mTOR-interacting protein (DEPTOR; C) abundance, DEPTOR phosphorylation as assessed by top bands relative to total DEPTOR (D), and representative images of DEPTOR Western blots (E) were assessed. Accompanying statistics are below each graph. Black bars, CTL; open bars, HU. The sample size was 6–7/group in A, 8/group in B, and 7–8/group in C and D. Data are represented as means ± SD.
MAFbx protein abundance was higher following 120 h of HU compared with CTL (P < 0.001; Fig. 7A) but unaffected by feeding status. In contrast, relative ULK1 phosphorylation on S757 (p-ULK1 (S757)/ULK1 total) was lower in HU animals (P = 0.002) and elevated following refeeding (P = 0.025; Fig. 7B). p62 protein abundance was higher in HU compared with CTL animals (P < 0.001; Fig. 7C) with no refeeding effect, and the LC3II/LC3I ratio was both higher in HU animals (P = 0.001) and attenuated after refeeding (P = 0.012; Fig. 7D). The sample size was 8/group in Fig. 7, A–C, and 7–8/group in Fig. 7D.
Fig. 7.

Effect of fasting and refeeding after 120 h of hindlimb unloading (HU) on molecular markers associated with protein degradation and autophagy. Relative muscle atrophy F-box (MAFbx) abundance (A), relative phosphorylation of Unc-51-like autophagy-activating kinase 1 (ULK1) on S757 (B), relative p62 abundance (C), and the ratio of LC3-II to LC3-I (D) were measured. Accompanying statistics are below each figure. Black bars, CTL; open bars, HU. One outlier was excluded from the CTL, the fasted group in D. The sample size was 8/group in A–C and 7–8/group in D. Data are represented as means ± SD.
DISCUSSION
Hindlimb unloading (HU) in rodents is a useful experimental model to study skeletal muscle atrophy. Indeed, in the present study, both body and muscle mass exhibited a gradual decline upon HU. Although nonsignificant, all three hindlimb muscles assessed in the present study exhibited atrophy within 24 h of HU. For the gastrocnemius muscle, loss of mass became statistically significant with 72 h of HU, whereas for soleus and plantaris muscles a significant difference was not observed until 120 h of HU. These findings agree with those of a recent study that reported that the medial gastrocnemius atrophied with 72 h of HU but the soleus and plantaris muscles did not (4). In contrast, other studies showed that the soleus muscle atrophied within 72 h of HU (35, 48, 53). The explanation for the differences among studies is unclear, but in the present study, the lack of a difference at 72 h (P = 0.09) may be related to a lack of statistical power.
A loss in muscle mass can be caused by unfavorable alterations in protein synthesis and/or protein degradation (5). Previous investigations demonstrated an attenuation in protein synthesis as soon as 72 h after HU was initiated (4, 35, 52). In the present study, protein synthesis, as measured by puromycin incorporation into protein, tended (P = 0.099) to be attenuated by 24 h of HU and was significantly reduced by 120 h of HU. Interestingly, in the present study, protein synthesis began to return to baseline toward the end of the time course experiment. In contrast, using 24-h deuterium incorporation, a more robust measure of measuring protein synthesis, Shimkus et al. (50) observed attenuated protein synthesis even after 28 days of HU.
The attenuation of protein synthesis that manifests during HU may in part be related to the development of anabolic resistance. For example, the stimulation of muscle protein synthesis caused by infusion of amino acids is blunted in the immobilized compared with the contralateral nonimmobilized leg in humans subjected to 14 days of unilateral knee fixation (20). Similarly, the stimulatory effect of orally administered leucine on muscle protein synthesis is suppressed in the immobilized compared with the contralateral nonimmobilized leg in rats subjected to unilateral hindlimb casting (25). In the present study, the reduced sensitivity of p70S6K phosphorylation to refeeding-induced upregulation is consistent with the development of anabolic resistance during HU. However, although the pattern of changes in 4E-BP1 phosphorylation is consistent with HU-induced anabolic resistance, the differences among conditions were not statistically significant. The lack of a statistically significant effect is in part due to the large variation in the data for the HU-refed group of mice. The basis for the larger variance in this measurement compared with others is unknown. However, the finding that protein synthesis is numerically higher in control mice, but not in HU mice, after refeeding is also consistent with HU-induced anabolic resistance. Overall, the results support the conclusion that, similar to other models of disuse, HU promotes development of anabolic resistance in skeletal muscle.
REDD1, DEPTOR, and Sestrin1 are stress-induced proteins that act to suppress mTORC1 activity. For example, all three proteins are upregulated in response to DNA damage (17, 28, 54) and have been shown to suppress mTORC1 (14, 42, 56). Importantly, the present study provides a time course for alterations in REDD1, DEPTOR, and Sestrin1 protein abundance as well as DEPTOR phosphorylation during acute and chronic disuse and recovery. Notably, cast immobilization-induced development of anabolic resistance in rat skeletal muscle is associated with upregulated expression of REDD1 in the soleus (25). Similarly, in mice, not only REDD1 abundance but also the abundance of DEPTOR and Sestrin1 are increased in the soleus in a cast-immobilized limb compared with the noncasted contralateral limb in association with resistance to activation of mTORC1 by refeeding (49). In agreement with Shimkus et al. (49), the present study found that the abundance of all three proteins was higher in the soleus of mice undergoing HU compared with control animals. The contribution that each protein plays in the development of mTORC1 resistance to anabolic stimulation is unknown. However, both the sepsis- (51) and fasting-induced (23) decrease in muscle protein synthesis and mTORC1 activity are blunted in REDD1-knockout (REDD1–/–) compared with control mice. Moreover, mTORC1 activity is significantly higher in the muscle of REDD1–/– compared with wild-type mice after a bout of electrically stimulated muscle contraction (22). Although these studies do not eliminate a possible role for DEPTOR or Sestrin1 in HU-induced development of anabolic resistance, they strongly support a causative role for REDD1 in the effect.
In the present study, the abundance of the E3 ligase, MAFbx, was elevated within 24 h of HU, remained elevated for 120 h, and thereafter returned to control levels, consistent with an acute but transient upregulation of protein degradation. These data oppose those reported by Baehr et al. (4), who found MAFbx abundance to be lower than baseline at 3 and 7 days following HU; however, with 14 days of unloading, MAFbx increased above baseline. Similarly, MAFbx mRNA is elevated with 3 days of HU (39) as well as with 6 wk of HU in the gastrocnemius muscle (1). Interestingly, in older animals (29 mo), MAFbx is elevated following 3 days of HU and remains elevated following 14 days of HU (4). Of note is that the present study did not find MAFbx to be responsive to refeeding or reloading, suggesting that MAFbx may not be responsive to acute anabolic stimuli.
A previous study reported little change in biomarkers of autophagy after 14 days of HU in adult mice (3). In contrast, other studies reported that p62 mRNA is elevated following 72 h of HU in both the soleus (11) and gastrocnemius (12) muscles. Likewise, p62 protein content is elevated in soleus muscle following 14 days of HU (16) and is also elevated in the gastrocnemius and tibialis anterior muscles following 28 days of HU (32). The study by Egawa et al. (16) also demonstrated an approximately ninefold increase in the LC3II/LC3I ratio in soleus muscle following 14 days of HU. Two other investigations in human vastus lateralis muscle found considerable but nonsignificant increases in the LC3 ratio following 24 days of bedrest (9) and 14 days of leg immobilization (40). In agreement with these previous studies, in the present study, both p62 abundance and the LC3II/LC3I ratio were elevated following 120 h of HU. Moreover, phosphorylation of ULK1 on S757 was lower after 120 h of HU compared with the control. ULK1 is phosphorylated on S757 by mTORC1, and phosphorylation at this site promotes dissociation of AMP-activated protein kinase (AMPK) from ULK1, leading to reduced phosphorylation of ULK1 on S555 and inactivation of ULK1 (15, 26). Thus, reduced phosphorylation of S757 would be expected to lead to activation of ULK1 through AMPK-mediated phosphorylation of S555. Although ULK1 (S555) phosphorylation was not assessed in the present study, a previous one by Tyganov et al. (53) found an increase in ULK1 (S555) phosphorylation with 1 and 3 days of HU. Overall, the results of the present study combined with those from previous ones suggest that autophagy is upregulated by HU. In contrast, the refeeding-induced changes in LC3 ratio and ULK1 (S757) phosphorylation observed in the present study suggest that autophagy may be suppressed within 30 min of refeeding.
A previous study showed that protein synthesis is restored within 72 h after a 336-h period of unloading (3). The results of the present study agree with those of Baehr et al. (3) and extend them to show that protein synthesis was unchanged with either 1 or 24 h of reloading. However, the present study also showed that reloading-induced activation of mTORC1 activity occurs sooner than recovery of protein synthesis, i.e., within 24 h. The basis for the temporal delay in restoration of protein synthesis relative to mTORC1 activation is likely due to the reduction in total RNA that occurs during HU (3). Thus, in the soleus, total RNA content is significantly suppressed by 336 h of HU and is unchanged 24 h after reloading. However, 72 h after reloading, soleus RNA content is restored to the control value. Given that 85% of total RNA comprises ribosomal RNA (41), these results suggest that restoration of protein synthesis after reloading is delayed until the number of ribosomes is returned to control levels. Notably, mTORC1 promotes ribosome biogenesis (13, 37); thus, the relatively rapid activation of mTORC1 during reloading may play an important role in increasing the number of ribosomes and, therefore, the capacity for protein synthesis after reloading.
Conclusions
The aim of this study was to put forth a timeline to help scientists discern molecular phenomena associated with disuse atrophy. The present study refines existing knowledge by examining both chronic HU (i.e., days to weeks) and also acute HU (i.e., hours to days). In this regard, these data combined with several other reports cited throughout this article provide further understanding of atrophy and the associated molecular variables. Furthermore, we sought to elaborate on the concept of anabolic resistance by refeeding animals that underwent 120 h of HU. The findings herein reinforce the notion that not only is protein synthesis affected by HU but so is protein degradation. In general, markers of anabolism are blunted, and markers of catabolism are enhanced following a period of HU. Future studies should aim to further comprehend markers of protein synthesis and breakdown that display anabolic resistance following disuse.
GRANTS
This work was supported by the National Aeronautics and Space Administration under Grant No. NNX15AK06H issued through the PA Space Grant Consortium (to K. L. Shimkus). This work was also supported by National Institute of Diabetes and Digestive and Kidney Diseases Grant R01-DK-15658 (to S.R. Kimball).
DISCLOSURES
No conflicts of interest, financial or otherwise, are declared by the authors.
AUTHOR CONTRIBUTIONS
K.L.S. and S.R.K. conceived and designed research; K.L.S., J.E.W., D.X., A.L.W., and E.M.K. performed experiments; P.A.R., K.L.S., and S.R.K. analyzed data; P.A.R., K.L.S., and S.R.K. interpreted results of experiments; P.A.R., K.L.S., and S.R.K. prepared figures; P.A.R. and S.R.K. drafted manuscript; P.A.R., K.L.S., J.E.W., D.X., A.L.W., E.M.K., L.S.J., and S.R.K. edited and revised manuscript; P.A.R., K.L.S., J.E.W., D.X., A.L.W., E.M.K., L.S.J., and S.R.K. approved final version of manuscript.
ACKNOWLEDGMENTS
We thank Dr. Ronald P. Wilson for helpful discussions during the design of the HU studies and Drs. David L. Waning, Brain A. Hain, Michael D. Dennis, and Siddharth Sunilkumar as well as William P. Miller and Sadie K. Dierschke for insightful feedback.
Present address of K.L.S.: University of Wyoming, Laramie, Wyoming.
Present address of D.X.: Rutgers, State University of New Jersey, New Brunswick, New Jersey.
REFERENCES
- 1.Al-Nassan S, Fujita N, Kondo H, Murakami S, Fujino H. Chronic exercise training down-regulates TNF-α and Atrogin-1/MAFbx in mouse gastrocnemius muscle atrophy induced by hindlimb unloading. Acta Histochem Cytochem 45: 343–349, 2012. doi: 10.1267/ahc.12023. [DOI] [PMC free article] [PubMed] [Google Scholar]
- 2.Anthony JC, Reiter AK, Anthony TG, Crozier SJ, Lang CH, MacLean DA, Kimball SR, Jefferson LS. Orally administered leucine enhances protein synthesis in skeletal muscle of diabetic rats in the absence of increases in 4E-BP1 or S6K1 phosphorylation. Diabetes 51: 928–936, 2002. doi: 10.2337/diabetes.51.4.928. [DOI] [PubMed] [Google Scholar]
- 3.Baehr LM, West DW, Marcotte G, Marshall AG, De Sousa LG, Baar K, Bodine SC. Age-related deficits in skeletal muscle recovery following disuse are associated with neuromuscular junction instability and ER stress, not impaired protein synthesis. Aging (Albany NY) 8: 127–146, 2016. doi: 10.18632/aging.100879. [DOI] [PMC free article] [PubMed] [Google Scholar]
- 4.Baehr LM, West DWD, Marshall AG, Marcotte GR, Baar K, Bodine SC. Muscle-specific and age-related changes in protein synthesis and protein degradation in response to hindlimb unloading in rats. J Appl Physiol (1985) 122: 1336–1350, 2017. doi: 10.1152/japplphysiol.00703.2016. [DOI] [PMC free article] [PubMed] [Google Scholar]
- 5.Bodine SC. Disuse-induced muscle wasting. Int J Biochem Cell Biol 45: 2200–2208, 2013. doi: 10.1016/j.biocel.2013.06.011. [DOI] [PMC free article] [PubMed] [Google Scholar]
- 6.Bodine SC, Baehr LM. Skeletal muscle atrophy and the E3 ubiquitin ligases MuRF1 and MAFbx/atrogin-1. Am J Physiol Endocrinol Metab 307: E469–E484, 2014. doi: 10.1152/ajpendo.00204.2014. [DOI] [PMC free article] [PubMed] [Google Scholar]
- 7.Bonaldo P, Sandri M. Cellular and molecular mechanisms of muscle atrophy. Dis Model Mech 6: 25–39, 2013. doi: 10.1242/dmm.010389. [DOI] [PMC free article] [PubMed] [Google Scholar]
- 8.Bowen TS, Schuler G, Adams V. Skeletal muscle wasting in cachexia and sarcopenia: molecular pathophysiology and impact of exercise training. J Cachexia Sarcopenia Muscle 6: 197–207, 2015. doi: 10.1002/jcsm.12043. [DOI] [PMC free article] [PubMed] [Google Scholar]
- 9.Brocca L, Cannavino J, Coletto L, Biolo G, Sandri M, Bottinelli R, Pellegrino MA. The time course of the adaptations of human muscle proteome to bed rest and the underlying mechanisms. J Physiol 590: 5211–5230, 2012. doi: 10.1113/jphysiol.2012.240267. [DOI] [PMC free article] [PubMed] [Google Scholar]
- 10.Burd NA, Gorissen SH, van Loon LJ. Anabolic resistance of muscle protein synthesis with aging. Exerc Sport Sci Rev 41: 169–173, 2013. doi: 10.1097/JES.0b013e318292f3d5. [DOI] [PubMed] [Google Scholar]
- 11.Cannavino J, Brocca L, Sandri M, Bottinelli R, Pellegrino MA. PGC1-α over-expression prevents metabolic alterations and soleus muscle atrophy in hindlimb unloaded mice. J Physiol 592: 4575–4589, 2014. doi: 10.1113/jphysiol.2014.275545. [DOI] [PMC free article] [PubMed] [Google Scholar]
- 12.Cannavino J, Brocca L, Sandri M, Grassi B, Bottinelli R, Pellegrino MA. The role of alterations in mitochondrial dynamics and PGC-1α over-expression in fast muscle atrophy following hindlimb unloading. J Physiol 593: 1981–1995, 2015. doi: 10.1113/jphysiol.2014.286740. [DOI] [PMC free article] [PubMed] [Google Scholar]
- 13.Chaillou T, Kirby TJ, McCarthy JJ. Ribosome biogenesis: emerging evidence for a central role in the regulation of skeletal muscle mass. J Cell Physiol 229: 1584–1594, 2014. doi: 10.1002/jcp.24604. [DOI] [PMC free article] [PubMed] [Google Scholar]
- 14.Dennis MD, Coleman CS, Berg A, Jefferson LS, Kimball SR. REDD1 enhances protein phosphatase 2A-mediated dephosphorylation of Akt to repress mTORC1 signaling. Sci Signal 7: ra68, 2014. doi: 10.1126/scisignal.2005103. [DOI] [PMC free article] [PubMed] [Google Scholar]
- 15.Egan D, Kim J, Shaw RJ, Guan KL. The autophagy initiating kinase ULK1 is regulated via opposing phosphorylation by AMPK and mTOR. Autophagy 7: 643–644, 2011. doi: 10.4161/auto.7.6.15123. [DOI] [PMC free article] [PubMed] [Google Scholar]
- 16.Egawa T, Goto A, Ohno Y, Yokoyama S, Ikuta A, Suzuki M, Sugiura T, Ohira Y, Yoshioka T, Hayashi T, Goto K. Involvement of AMPK in regulating slow-twitch muscle atrophy during hindlimb unloading in mice. Am J Physiol Endocrinol Metab 309: E651–E662, 2015. doi: 10.1152/ajpendo.00165.2015. [DOI] [PubMed] [Google Scholar]
- 17.Ellisen LW, Ramsayer KD, Johannessen CM, Yang A, Beppu H, Minda K, Oliner JD, McKeon F, Haber DA. REDD1, a developmentally regulated transcriptional target of p63 and p53, links p63 to regulation of reactive oxygen species. Mol Cell 10: 995–1005, 2002. doi: 10.1016/S1097-2765(02)00706-2. [DOI] [PubMed] [Google Scholar]
- 18.Fitts RH, Riley DR, Widrick JJ. Functional and structural adaptations of skeletal muscle to microgravity. J Exp Biol 204: 3201–3208, 2001. [DOI] [PubMed] [Google Scholar]
- 19.Gao Y, Arfat Y, Wang H, Goswami N. Muscle atrophy induced by mechanical unloading: mechanisms and potential countermeasures. Front Physiol 9: 235, 2018. doi: 10.3389/fphys.2018.00235. [DOI] [PMC free article] [PubMed] [Google Scholar]
- 20.Glover EI, Phillips SM, Oates BR, Tang JE, Tarnopolsky MA, Selby A, Smith K, Rennie MJ. Immobilization induces anabolic resistance in human myofibrillar protein synthesis with low and high dose amino acid infusion. J Physiol 586: 6049–6061, 2008. doi: 10.1113/jphysiol.2008.160333. [DOI] [PMC free article] [PubMed] [Google Scholar]
- 21.Gordon BS, Kazi AA, Coleman CS, Dennis MD, Chau V, Jefferson LS, Kimball SR. RhoA modulates signaling through the mechanistic target of rapamycin complex 1 (mTORC1) in mammalian cells. Cell Signal 26: 461–467, 2014. doi: 10.1016/j.cellsig.2013.11.035. [DOI] [PMC free article] [PubMed] [Google Scholar]
- 22.Gordon BS, Steiner JL, Lang CH, Jefferson LS, Kimball SR. Reduced REDD1 expression contributes to activation of mTORC1 following electrically induced muscle contraction. Am J Physiol Endocrinol Metab 307: E703–E711, 2014. doi: 10.1152/ajpendo.00250.2014. [DOI] [PMC free article] [PubMed] [Google Scholar]
- 23.Gordon BS, Williamson DL, Lang CH, Jefferson LS, Kimball SR. Nutrient-induced stimulation of protein synthesis in mouse skeletal muscle is limited by the mTORC1 repressor REDD1. J Nutr 145: 708–713, 2015. doi: 10.3945/jn.114.207621. [DOI] [PMC free article] [PubMed] [Google Scholar]
- 24.Kazi AA, Hong-Brown L, Lang SM, Lang CH. Deptor knockdown enhances mTOR Activity and protein synthesis in myocytes and ameliorates disuse muscle atrophy. Mol Med 17: 925–936, 2011. doi: 10.2119/molmed.2011.00070. [DOI] [PMC free article] [PubMed] [Google Scholar]
- 25.Kelleher AR, Kimball SR, Dennis MD, Schilder RJ, Jefferson LS. The mTORC1 signaling repressors REDD1/2 are rapidly induced and activation of p70S6K1 by leucine is defective in skeletal muscle of an immobilized rat hindlimb. Am J Physiol Endocrinol Metab 304: E229–E236, 2013. doi: 10.1152/ajpendo.00409.2012. [DOI] [PMC free article] [PubMed] [Google Scholar]
- 26.Kim J, Kundu M, Viollet B, Guan KL. AMPK and mTOR regulate autophagy through direct phosphorylation of Ulk1. Nat Cell Biol 13: 132–141, 2011. doi: 10.1038/ncb2152. [DOI] [PMC free article] [PubMed] [Google Scholar]
- 27.Kimball SR, Gordon BS, Moyer JE, Dennis MD, Jefferson LS. Leucine induced dephosphorylation of Sestrin2 promotes mTORC1 activation. Cell Signal 28: 896–906, 2016. doi: 10.1016/j.cellsig.2016.03.008. [DOI] [PMC free article] [PubMed] [Google Scholar]
- 28.Kuo T, Lew MJ, Mayba O, Harris CA, Speed TP, Wang JC. Genome-wide analysis of glucocorticoid receptor-binding sites in myotubes identifies gene networks modulating insulin signaling. Proc Natl Acad Sci USA 109: 11160–11165, 2012. doi: 10.1073/pnas.1111334109. [DOI] [PMC free article] [PubMed] [Google Scholar]
- 29.Lang SM, Kazi AA, Hong-Brown L, Lang CH. Delayed recovery of skeletal muscle mass following hindlimb immobilization in mTOR heterozygous mice. PLoS One 7: e38910, 2012. doi: 10.1371/journal.pone.0038910. [DOI] [PMC free article] [PubMed] [Google Scholar]
- 30.Larsson L, Degens H, Li M, Salviati L, Lee YI, Thompson W, Kirkland JL, Sandri M. Sarcopenia: Aging-Related Loss of Muscle Mass and Function. Physiol Rev 99: 427–511, 2019. doi: 10.1152/physrev.00061.2017. [DOI] [PMC free article] [PubMed] [Google Scholar]
- 31.Lee JH, Budanov AV, Karin M. Sestrins orchestrate cellular metabolism to attenuate aging. Cell Metab 18: 792–801, 2013. doi: 10.1016/j.cmet.2013.08.018. [DOI] [PMC free article] [PubMed] [Google Scholar]
- 32.Liu J, Peng Y, Cui Z, Wu Z, Qian A, Shang P, Qu L, Li Y, Liu J, Long J. Depressed mitochondrial biogenesis and dynamic remodeling in mouse tibialis anterior and gastrocnemius induced by 4-week hindlimb unloading. IUBMB Life 64: 901–910, 2012. doi: 10.1002/iub.1087. [DOI] [PubMed] [Google Scholar]
- 33.Mahmassani ZS, Reidy PT, McKenzie AI, Stubben C, Howard MT, Drummond MJ. Age-dependent skeletal muscle transcriptome response to bed rest-induced atrophy. J Appl Physiol (1985) 126: 894–902, 2019. doi: 10.1152/japplphysiol.00811.2018. [DOI] [PMC free article] [PubMed] [Google Scholar]
- 34.Miller BF, Baehr LM, Musci RV, Reid JJ, Peelor FF III, Hamilton KL, Bodine SC. Muscle-specific changes in protein synthesis with aging and reloading after disuse atrophy. J Cachexia Sarcopenia Muscle 10: 1195–1209, 2019. doi: 10.1002/jcsm.12470. [DOI] [PMC free article] [PubMed] [Google Scholar]
- 35.Mirzoev T, Tyganov S, Vilchinskaya N, Lomonosova Y, Shenkman B. Key markers of mTORC1-dependent and mTORC1-independent signaling pathways regulating protein synthesis in rat soleus muscle during early stages of hindlimb unloading. Cell Physiol Biochem 39: 1011–1020, 2016. doi: 10.1159/000447808. [DOI] [PubMed] [Google Scholar]
- 36.Mirzoev TM, Tyganov SA, Petrova IO, Shenkman BS. Acute recovery from disuse atrophy: the role of stretch-activated ion channels in the activation of anabolic signaling in skeletal muscle. Am J Physiol Endocrinol Metab 316: E86–E95, 2019. doi: 10.1152/ajpendo.00261.2018. [DOI] [PubMed] [Google Scholar]
- 37.Mobley CB, Haun CT, Roberson PA, Mumford PW, Kephart WC, Romero MA, Osburn SC, Vann CG, Young KC, Beck DT, Martin JS, Lockwood CM, Roberts MD. Biomarkers associated with low, moderate, and high vastus lateralis muscle hypertrophy following 12 weeks of resistance training. PLoS One 13: e0195203, 2018. doi: 10.1371/journal.pone.0195203. [DOI] [PMC free article] [PubMed] [Google Scholar]
- 38.Mobley CB, Haun CT, Roberson PA, Mumford PW, Romero MA, Kephart WC, Anderson RG, Vann CG, Osburn SC, Pledge CD, Martin JS, Young KC, Goodlett MD, Pascoe DD, Lockwood CM, Roberts MD. Effects of whey, soy or leucine supplementation with 12 weeks of resistance training on strength, body composition, and skeletal muscle and adipose tissue histological attributes in college-aged males. Nutrients 9: 972, 2017. doi: 10.3390/nu9090972. [DOI] [PMC free article] [PubMed] [Google Scholar]
- 39.Mochalova EP, Belova SP, Mirzoev TM, Shenkman BS, Nemirovskaya TL. Atrogin-1/MAFbx mRNA expression is regulated by histone deacetylase 1 in rat soleus muscle under hindlimb unloading. Sci Rep 9: 10263, 2019. doi: 10.1038/s41598-019-46753-0. [DOI] [PMC free article] [PubMed] [Google Scholar]
- 40.Møller AB, Vendelbo MH, Schjerling P, Couppé C, Møller N, Kjær M, Hansen M, Jessen N. Immobilization decreases FOXO3a phosphorylation and increases autophagy-related gene and protein expression in human skeletal muscle. Front Physiol 10: 736, 2019. doi: 10.3389/fphys.2019.00736. [DOI] [PMC free article] [PubMed] [Google Scholar]
- 41.Nader GA, McLoughlin TJ, Esser KA. mTOR function in skeletal muscle hypertrophy: increased ribosomal RNA via cell cycle regulators. Am J Physiol Cell Physiol 289: C1457–C1465, 2005. doi: 10.1152/ajpcell.00165.2005. [DOI] [PubMed] [Google Scholar]
- 42.Peterson TR, Laplante M, Thoreen CC, Sancak Y, Kang SA, Kuehl WM, Gray NS, Sabatini DM. DEPTOR is an mTOR inhibitor frequently overexpressed in multiple myeloma cells and required for their survival. Cell 137: 873–886, 2009. doi: 10.1016/j.cell.2009.03.046. [DOI] [PMC free article] [PubMed] [Google Scholar]
- 43.Powers SK, Lynch GS, Murphy KT, Reid MB, Zijdewind I. Disease-Induced Skeletal Muscle Atrophy and Fatigue. Med Sci Sports Exerc 48: 2307–2319, 2016. doi: 10.1249/MSS.0000000000000975. [DOI] [PMC free article] [PubMed] [Google Scholar]
- 44.Roberson PA, Romero MA, Mumford PW, Osburn SC, Haun CT, Vann CG, Kluess HA, Roberts MD. Protein supplementation throughout 10 weeks of progressive run training is not beneficial for time trial improvement. Front Nutr 5: 97, 2018. doi: 10.3389/fnut.2018.00097. [DOI] [PMC free article] [PubMed] [Google Scholar]
- 45.Sandri M. Protein breakdown in muscle wasting: role of autophagy-lysosome and ubiquitin-proteasome. Int J Biochem Cell Biol 45: 2121–2129, 2013. doi: 10.1016/j.biocel.2013.04.023. [DOI] [PMC free article] [PubMed] [Google Scholar]
- 46.Saxton RA, Sabatini DM. mTOR signaling in growth, metabolism, and disease. Cell 168: 960–976, 2017. [Erratum in: Cell 169: 361–371, 2017.] doi: 10.1016/j.cell.2017.02.004. [DOI] [PMC free article] [PubMed] [Google Scholar]
- 47.Schmidt EK, Clavarino G, Ceppi M, Pierre P. SUnSET, a nonradioactive method to monitor protein synthesis. Nat Methods 6: 275–277, 2009. doi: 10.1038/nmeth.1314. [DOI] [PubMed] [Google Scholar]
- 48.Shenkman BS, Belova SP, Lomonosova YN, Kostrominova TY, Nemirovskaya TL. Calpain-dependent regulation of the skeletal muscle atrophy following unloading. Arch Biochem Biophys 584: 36–41, 2015. doi: 10.1016/j.abb.2015.07.011. [DOI] [PubMed] [Google Scholar]
- 49.Shimkus KL, Jefferson LS, Gordon BS, Kimball SR. Repressors of mTORC1 act to blunt the anabolic response to feeding in the soleus muscle of a cast-immobilized mouse hindlimb. Physiol Rep 6: e13891, 2018. doi: 10.14814/phy2.13891. [DOI] [PMC free article] [PubMed] [Google Scholar]
- 50.Shimkus KL, Shirazi-Fard Y, Wiggs MP, Ullah ST, Pohlenz C, Gatlin DM III, Carroll CC, Hogan HA, Fluckey JD. Responses of skeletal muscle size and anabolism are reproducible with multiple periods of unloading/reloading. J Appl Physiol (1985) 125: 1456–1467, 2018. doi: 10.1152/japplphysiol.00736.2017. [DOI] [PubMed] [Google Scholar]
- 51.Steiner JL, Crowell KT, Kimball SR, Lang CH. Disruption of REDD1 gene ameliorates sepsis-induced decrease in mTORC1 signaling but has divergent effects on proteolytic signaling in skeletal muscle. Am J Physiol Endocrinol Metab 309: E981–E994, 2015. doi: 10.1152/ajpendo.00264.2015. [DOI] [PMC free article] [PubMed] [Google Scholar]
- 52.Tyganov S, Mirzoev T, Shenkman B. An anabolic signaling response of rat soleus muscle to eccentric contractions following hindlimb unloading: a potential role of stretch-activated ion channels. Int J Mol Sci 20: 1165, 2019. doi: 10.3390/ijms20051165. [DOI] [PMC free article] [PubMed] [Google Scholar]
- 53.Tyganov SA, Mochalova EP, Belova SP, Sharlo KA, Rozhkov SV, Vilchinskaya NA, Paramonova II, Mirzoev TM, Shenkman BS. Effects of plantar mechanical stimulation on anabolic and catabolic signaling in rat postural muscle under short-term simulated gravitational unloading. Front Physiol 10: 1252, 2019. doi: 10.3389/fphys.2019.01252. [DOI] [PMC free article] [PubMed] [Google Scholar]
- 54.Velasco-Miguel S, Buckbinder L, Jean P, Gelbert L, Talbott R, Laidlaw J, Seizinger B, Kley N. PA26, a novel target of the p53 tumor suppressor and member of the GADD family of DNA damage and growth arrest inducible genes. Oncogene 18: 127–137, 1999. doi: 10.1038/sj.onc.1202274. [DOI] [PubMed] [Google Scholar]
- 55.Wilkinson DJ, Piasecki M, Atherton PJ. The age-related loss of skeletal muscle mass and function: Measurement and physiology of muscle fibre atrophy and muscle fibre loss in humans. Ageing Res Rev 47: 123–132, 2018. doi: 10.1016/j.arr.2018.07.005. [DOI] [PMC free article] [PubMed] [Google Scholar]
- 56.Wolfson RL, Sabatini DM. The dawn of the age of amino acid sensors for the mTORC1 pathway. Cell Metab 26: 301–309, 2017. doi: 10.1016/j.cmet.2017.07.001. [DOI] [PMC free article] [PubMed] [Google Scholar]
- 57.Xu D, Shimkus KL, Lacko HA, Kutzler L, Jefferson LS, Kimball SR. Evidence for a role for Sestrin1 in mediating leucine-induced activation of mTORC1 in skeletal muscle. Am J Physiol Endocrinol Metab 316: E817–E828, 2019. doi: 10.1152/ajpendo.00522.2018. [DOI] [PMC free article] [PubMed] [Google Scholar]