

Abstract
Human cytochrome P450 (P450) CYP2B6 undergoes nitric oxide (NO)-dependent proteasomal degradation in response to the NO donor dipropylenetriamine NONOate (DPTA) and biologic NO in HeLa and HuH7 cell lines. CYP2B6 is also downregulated by NO in primary human hepatocytes. We hypothesized that NO or derivative reactive nitrogen species may generate adducts of tyrosine and/or cysteine residues, causing CYP2B6 downregulation, and selected Tyr and Cys residues for mutation based on predicted solvent accessibility. CYP2B6V5-Y317A, -Y380A, and -Y190A mutant proteins expressed in HuH7 cells were less sensitive than wild-type (WT) enzyme to degradation evoked by DPTA, suggesting that these tyrosines are targets for NO-dependent downregulation. The Y317A or Y380A mutants did not show increases in high molecular mass (HMM) species after treatment with DPTA or bortezomib + DPTA, in contrast to the WT enzyme. Carbon monoxide–releasing molecule 2 treatment caused rapid suppression of 2B6 enzyme activity, significant HMM species generation, and ubiquitination of CYP2B6 protein but did not stimulate CYP2B6 degradation. The CYP2B6 inhibitor 4-(4-chlorophenyl)imidazole blocked NO-dependent CYP2B6 degradation, suggesting that NO access to the active site is important. Molecular dynamics simulations predicted that tyrosine nitrations of CYP2B6 would cause significant destabilizing perturbations of secondary structure and remove correlated motions likely required for enzyme function. We propose that cumulative nitrations of Y190, Y317, and Y380 by reactive nitrogen species cause destabilization of CYP2B6, which may act synergistically with heme nitrosylation to target the enzyme for degradation.
SIGNIFICANCE STATEMENT
This work provides novel insight into the mechanisms by which nitric oxide, which is produced in hepatocytes in response to inflammation, triggers the ubiquitin-dependent proteasomal degradation of the cytochrome P450 (P450) enzyme CYP2B6. Our data demonstrate that both nitration of specific tyrosine residues and interaction of nitric oxide (NO) with the P450 heme are necessary for NO to trigger ubiquitination and protein degradation.
Introduction
The enzyme activities and expression levels of many P450 enzymes are downregulated during infection and inflammation, leading to decreased drug clearance, elevation of plasma drug levels, and drug toxicity (Morgan, 2009). Mechanisms involved in impairment of P450-catalyzed drug metabolism during infection and inflammation include enzyme activity inhibition and/or protein degradation in response to nitric oxide (NO). High levels of endogenous NO are generated by inducible nitric oxide synthase (NOS) 2 during an infection or inflammation. NO has various biologic functions, such as vasodilation, activation of soluble guanylate cyclase (Denninger and Marletta, 1999), and modulation of protein function by changing enzyme activity or protein turnover. Several reports show that NO stimulates degradation of diverse proteins, such as iron regulatory protein 2 (Kim and Ponka, 2000), insulin receptor substrate−1 and −2 proteins (Sugita et al., 2005; Tanioka et al., 2011), liver kinase B1 (Liu et al., 2015), and phosphodiesterase 5 (Wang et al., 2015).
There are three proposed mechanisms by which NO and P450s interact: 1) all P450s contain a heme-iron center that is nitrosylated by NO in a coordination complex (Ebel et al., 1975; Wink et al., 1993; Minamiyama et al., 1997), resulting in enzyme inhibition; 2) cysteine nitrosation (Lee et al., 2008); and 3) tyrosine nitration, in which peroxynitrite reacts with the hydroxyl group of tyrosine. Peroxynitrite is capable of nitrating tyrosine residues of rat CYP2B1 (Roberts et al., 1998) and human CYP2B6, CYP2E1, and CYP3A4 (Lin et al., 2007, 2012) in vitro. Inactivation of CYP2B1 by peroxynitrite can be prevented by mutation of tyrosine residue 190 to alanine, although the Y190A mutant exhibited 60% of catalytic activity compared with wild-type (WT) CYP2B6 (Lin et al., 2003). CYP3A4 and CYP2E1 are inactivated via both heme modification and tyrosine nitration (Lin et al., 2007).
In addition to inhibition of P450 enzymes, NO can also stimulate their degradation, but the mechanisms are not well-understood. Enzymes such as CYP3A4, CYP3A5, and CYP2C11 (Sewer and Morgan, 1997; Aitken et al., 2008; Lee et al., 2017) are refractory to this phenomenon, whereas CYP2B1, CYP2B6, CYP3A1, CYP2C22, CYP2J2, and CYP51A1 are sensitive (Aitken et al., 2008; Lee et al., 2008, 2009, 2014, 2017; Park et al., 2017, 2018). Moreover, the proteolytic pathways involved appear to be enzyme-dependent. We demonstrated that induction of NOS2 by bacterial lipopolysaccharide or interleukin-1β causes the NO-dependent proteasomal degradation of the drug-metabolizing P450s, CYP2B1 (Ferrari et al., 2001; Lee et al., 2008) and CYP3A1 (Lee et al., 2009), in rat hepatocytes and that proteasomal degradation of CYP2B1 is ubiquitin-dependent (Lee et al., 2008). CYP2B1 was shown to undergo S-nitrosation by S-nitrosoglutathione in vitro (Lee et al., 2008), but it has not yet been determined whether this modification, or indeed tyrosine nitration or heme nitrosylation, are responsible for the degradation of the protein. Human CYP2B6 also undergoes NO-dependent downregulation in human hepatocytes (Aitken et al., 2008) via polyubiquitination and proteasomal degradation (Lee et al., 2017). On the other hand, CYP2C22 degradation is unaffected by proteasome inhibition (Lee et al., 2014).
Here, we studied in detail how NO can stimulate CYP2B6 degradation in cells. We mutated possible NO target residues of CYP2B6 protein (tyrosine or cysteine) and measured enzyme activity, sensitivity to NO-stimulated degradation, and formation of high molecular mass (HMM) species and ubiquitinated CYP2B6. Our data show that certain tyrosine residues are critical in the NO-elicited polyubiquitination and degradation of 2B6 protein by NO.
Materials and Methods
Materials and Reagents.
Carbon monoxide–releasing molecule 2 (CORM2) was purchased from Tocris, Minneapolis, MN. Dipropylenetriamine NONOate and peroxynitrite were purchased from Cayman Chemicals, Ann Arbor, MI. Nω-nitro-L-arginine methyl ester hydrochloride, cycloheximide, and doxycycline were from Sigma-Aldrich, St. Louis, MO.
Mouse monoclonal antibodies to the V5 peptide (cat. no. V8012) and glyceraldehyde-3-phosphate dehydrogenase (GAPDH) (cat. no. MAB374) were purchased from Sigma-Aldrich and Millipore (Billerica, MA), respectively. Affinity-purified anti-actin antibody (cat. no. A2066) was purchased from Sigma-Aldrich. IRDye 680RD Goat anti-Rabbit IgG and IRDye 800CW Goat anti-Mouse IgG were from LI-COR Biosciences, Lincoln, NE. Anti-V5-tag mAb-Magnetic Beads were obtained from MBL International, Woburn, MA.
Site-Directed Mutagenesis of CYP2B6V5.
Site-directed mutagenesis was carried out by using Q5 Hot Start High-Fidelity DNA Polymerase (New England Biolabs, Ipswich, MA). Briefly, the primers for single amino acid changes were designed using the New England Biolabs primer-designing tool (http://nebasechanger.neb.com/) and were synthesized and 5′-phosphorylated by Eurofins (Louisville, KY). After PCR amplification of parental WT pLX304-2B6V5 vector with mutant primers, the PCR products were purified with a PCR purification kit (Qiagene), ligated at 16°C overnight with T4-DNA ligase (Promega, Madison, WI), heated at 85°C for 15 seconds, digested with Dpn1 to remove parental plasmids, and then transformed into Stbl2 competent Escherichia coli cells (Invitrogen, Carlsbad, CA). Mutations were confirmed by DNA sequencing.
Expression of CYP2B6V5 and Its Mutants in HuH7 Cells or HeLa–Human NOS2 Cell Line.
The human NOS2 gene was cloned into pLIX_403 (tetracycline inducible lentivirus vector; a gift from David Root; plasmid #41395; Addgene) and named pLIX–human NOS2 (hNOS2) (Lee et al., 2017). Cell lines expressing V5-tagged wild-type and mutant CYP2B6 enzymes were produced via lentiviral transduction. Lentiviruses were produced in human embryonic kidney 293T cells by transfecting them with pLX304-2B6V5, psPAX2, and pMD2.G plasmids previously described (Lee et al., 2017). HeLa cells transduced with pLIX-hNOS2 or HuH7 cells were cultured in Dulbecco’s modified Eagle’s medium containing 10% FBS and penicillin-streptomycin and infected with virus particles. Virus-infected cells were selected by 5–10 μg/ml of blasticidin treatment in 10% FBS/penicillin-streptomycin/Dulbecco’s modified Eagle’s medium and maintained under the same conditions.
Immunoblotting.
Cells were harvested in cell lysis buffer containing 50 mM Tris-Cl (pH 7.5), 0.1% SDS, 1% NP-40, 0.1 mM EDTA, and a protease inhibitor cocktail (P83400; Sigma), and immunoblotting was carried out as previously described (Lee et al., 2017). The total cell lysates were centrifuged at 12,000g for 5 minutes, and the supernatants were collected. After SDS-PAGE, proteins were blotted to nitrocellulose paper, and then CYP2B6V5 proteins were measured by incubating the membranes with anti-V5 (1:10,000) at 4°C overnight. GAPDH (1:10,000) and/or actin (1:5000) antibodies were included in the incubations as loading controls. For infrared fluorescence detection, blots were incubated with IRDye 680RD Goat anti-Rabbit IgG and IRDye 800CW Goat anti-Mouse IgG (1:10,000 dilution) for 1 hour, and the blots were analyzed with an Odyssey Fc Imaging System (LI-COR Biosciences) to detect fluorescence signals. Fluorescence intensity was measured using Image Studio software (LI-COR Biosciences). Note that some blots are presented with their aspect ratio altered (width increased relative to height) to reduce the space taken up by the figures.
To combine data from multiple experiments, we first calculated the ratio of the V5 signal to that of the control gene (GAPDH) for each sample. This was then divided by the mean of the ratios for all the samples on the blot as described previously (Lee et al., 2017). The resulting values were used to calculate group means for each experiment. The group means for the individual experiments were used to calculate the mean and S.D. for the combined data, and the results were then scaled to a control group mean value of 100.
CYP2B6 Activity.
Cell-based CYP2B6 activities were measured on 24-well plates using 7-ethoxy-4-trifluoromethylcoumarin (EFC) as a substrate (Donato et al., 2004). After removing culture media, 250 μl of assay buffer containing 50 μM EFC was added to the cultures, and the medium was collected after a 10-minute incubation for measurement of the fluorescence of 7-hydroxy-4-trifluoromethylcoumarin (excitation, 395 nm; emission, 500 nm).
Preparation of Postnuclear Fractions.
HuH7 cell lines were harvested with hypotonic buffer (10 mM HEPES, 1.5 mM MgCl2, 10 mM KCl, 0.5 mM dithiothreitol, pH7.4), broken by passing the cells through a 27G needle, and then sonicated 10 seconds on ice. The cell lysates were centrifuged at 600g for 5 minutes to remove unbroken cells and nuclei. The supernatant was named the postnuclear fraction.
Immunoprecipitations.
For immunoprecipitation of CYP2B6V5 from total cell lysates (prepared as above, containing 0.1% SDS and % NP-40), 75 μl of anti-V5 mAb-coupled magnetic beads were added to the entire lysate from a six-well plate (approximately 250 μl) and incubated overnight at 4°C with continuous mixing. After extensive washing of the bead mixture with cell lysis buffer, CYP2B6V5 protein was released by SDS-loading buffer and subjected to SDS-PAGE.
For the experiment involving immunoprecipitation from peroxynitrite-treated postnuclear fractions, 500 μl of postnuclear supernatant containing 1 mg/ml protein was treated with peroxynitrite as specified in the figure legend, which was followed by dilution with an equal volume of cell lysis buffer containing 50 mM Tris-Cl (pH 7.5), 0.1% SDS, 1% NP-40, 0.1 mM EDTA, and a protease inhibitor cocktail (P83400; Sigma). Seventy-five microliters of anti-V5 mAb-coupled magnetic beads was added, and immunoprecipitation proceeded as described for total cell lysates.
Molecular Dynamics Simulations.
Computational resources were provided through the University of Connecticut Storrs High Performance Computing Facility. Molecular dynamics simulations were performed with models based on the coordinates of the amlodipine-bound CYP2B6 structure (PDB ID: 3UA5) using the GROMACS 2018 simulation package (Abraham et al., 2015) and the GROMOS 54a7 force field (Schmid et al., 2011). Residues or side chains not found in the amlodipine complex were added using the homology modeling program Modeler v. 9.19 and the complete amino acid sequence of the construct used for the X-ray crystal structure (Webb and Sali, 2016). The scripts used for model building are available for the basic model building tutorial from the Modeler website (https://salilab.org/modeller/tutorial/basic.html) and were modified to accept the CYP2B6 X-ray crystal structure coordinates and sequence information. The Modeler mutate model script, available at https://salilab.org/modeller/wiki/Mutate_model, was used to mutate tyrosine residues to alanine and to generate the native sequence Y226/K262 from the X-ray crystal structure sequence. The coordinates (Supplemental Data 1) and topology (Supplemental Data 2) of 3-nitrotyrosine (NIY) were obtained using the SwissParam parameter generation server (Zoete et al., 2011). For models containing NIY, the modified tyrosine residue was inserted by hand and minimized using PyMOL. Each model showed <0.17 Å RMSD from the original model of CYP2B6 and <0.28 Å RMSD when compared with the template structure using PyMOL. Models were also compared using a local copy of ModRefiner for 64-bit Linux [https://zhanglab.ccmb.med.umich.edu/ModRefiner/ModRefiner-l.zip; Y190NIY (Supplemental Data 3) – RMSD = 0.588; Y235NIY (Supplemental Data 4) – RMSD = 0.444; Y317NIY (Supplemental Data 5) – RMSD = 0.462; Y380NIY (Supplemental Data 6) – RMSD = 0.514; Y190A (Supplemental Data 7) – RMSD = 0.508; Y235A (Supplemental Data 8) – RMSD = 0.500; Y317A (Supplemental Data 9) – RMSD = 0.433; Y380A (Supplemental Data 10) – RMSD = 0.394]. Original models were generated in the more stable X-ray crystal structure background that included the Y226H/K262R double mutant. Topology files used in the energy minimization and molecular dynamics simulation were modified to reflect the cysteinyl ligation to the heme (Oda et al., 2005) using Python scripts created by Arthur Roberts, University of Georgia, College of Pharmacy that are available upon request. Systems were solvated in extended simple point charge water model, with Lennard-Jones parameters for the hydrogen atoms and chloride atoms added to neutralize charges; the final system sizes were ∼97,000 atoms. The systems were energy-minimized for 5000 steps by the method of steepest descent while the positions of the nonhydrogen (heavy) atoms of the protein were restrained with a force constant of 1000 kJ/mol per square nanometer to remove Van der Waals contact between overlapping waters and the amino acids of the protein. Subsequently, systems were restrained in the same manner as described for energy minimization, and 100 picoseconds of NVT equilibration (300 K) followed by 100 picoseconds of NPT equilibration (300 K, 1 atm) were run. Production simulations were performed in the NPT ensemble at 300 K and 1 atm using a Parrinello-Rahman barostat and a velocity-rescale thermostat (Bussi et al., 2007). Coupling time constants of 1 picosecond were used for both the temperature and pressure coupling. A switching function was applied to the Lenard-Jones forces at 10 Å, with a cutoff at 12 Å. Long-range electrostatics (>12 Å) were computed by using the particle mesh Ewald method with a Fourier spacing of 1 Å. The trajectories were computed using the leap-frog stochastic dynamics integrator with a time step of 2 femtoseconds. Waters were kept rigid using the SETTLE algorithm (Miyamoto and Kollman, 1992), and nonwater bonds involving hydrogen atoms were constrained with the LINear Constraint Solver algorithm (Hess et al., 1998). All other systems were simulated for 10 nanoseconds. Simulations were analyzed using a combination of GROMACS tools and the Bio3D R package (Skjærven et al., 2014).
Statistical Analysis.
Prism (version 8) was used to perform one-way or two-way ANOVA and Tukey’s or Dunnett’s test as appropriate for each experimental design, and details are given in the text or figure legends. Summary statistics are presented as means and 95% CI. Details of all the statistical comparisons are provided in Supplemental Data 11.
Results
CYP2B6V5-Y317A and -Y380A Mutants Are Resistant to NO-Dependent Degradation.
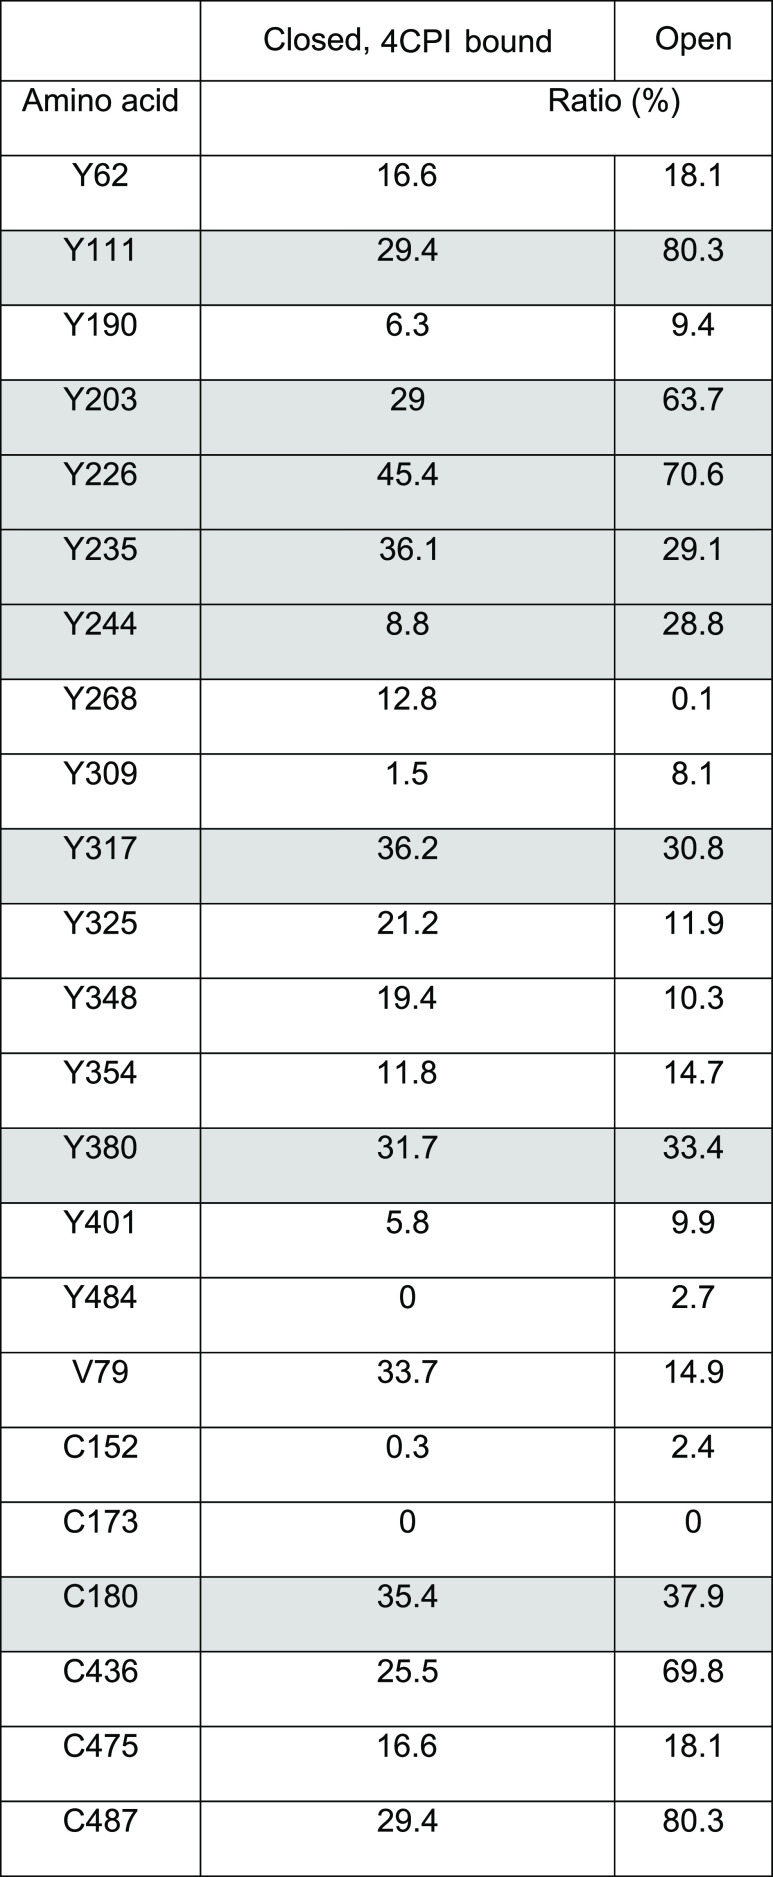
We hypothesized that tyrosine or cysteine residues exposed on the surface of the protein would be most susceptible to NO modification. As a first approach, we calculated the surface accessibility of these residues on CYP2B6 based on the closed structure of CYP2B6 [4CPI-bound CYP2B6 (3IBD; (Gay et al., 2010))] and the open structure of CYP2B4 (1P05) by using Getarea (http://curie.utmb.edu/getarea.html). Based on the scores shown in Table 1, we selected tyrosine Y111, Y203, Y226 Y235, Y244, Y317, Y380, and C180 residues for site-directed mutagenesis, in which alanine was substituted for tyrosine or serine for cysteine. The C436 residue was not chosen for mutation because of its role in heme binding and likely instability of the mutant. Residue C487 was not chosen because the PDB structure is a natural variant of CYP2B6 and our clone (WT) already had the more common arginine instead of cysteine at this position.
TABLE 1.
Surface accessibility of Tyr and Cys residues of CYP2B6
Surface accessibility (Ratio %) for the CYP2B6 closed structure was calculated from “Get Area (http://curie.utmb.edu/getarea.html)” using the Protein Data Bank structure 3IBD. The open structure of CYP2B4 (1PO5) was used to model the CYP2B6 open three-dimensional structure by using Modeler (http://salilab.org/modeller/), and then surface accessibility was calculated in the same manner. Residues shaded in gray were selected for the initial mutational analyses.
 |
We transduced the mutant constructs into HeLa or HuH7 cells by viral infection, and cell lines were generated by blasticidin selection. The basal level of expression of the WT and mutant enzymes varied substantially not only from each other but with passage number and among different transductions. Data are shown in Supplemental Fig. 1. Mutations of tyrosines 203, 224, 235, 317, and 380 had relatively small effects on protein expression, whereas expression of Y111A and Y244A was substantially lower (see also Fig. 1). All of the mutations except Y203A reduced the activities of the enzymes, which are best visualized in Supplemental Fig. 1C in which activity is normalized to protein levels. Specific activities ranged from 15% to 34% of control for Y111A to 121%–153% of control for Y203A.
Fig. 1.

Downregulation of CYP2B6V5 and its mutant proteins in HuH7 cells. HuH7 cell lines expressing WT and mutant CYP2B6V5 were treated with DPTA NONOate (500 mM) for 4 hours, and total cell lysates were used for immunoblotting with antibodies to the V5 tag, actin, and GAPDH. (A) Representative images showing DPTA-dependent CYP2B6V5 downregulation. Because the expression levels of the mutants varied among the cell lines, the images of Y111A, Y244A, and C180S were viewed at a higher gain and pasted below for better visualization. (B) Quantitation of data. The percent downregulation by DPTA was calculated as the effect size for each cell line, in which no downregulation = 0 and complete downregulation = 100. Values are the means and 95% CI of three independent experiments. Differences in response among the groups were tested by ordinary one-way ANOVA [F(8, 18) = 0.993, P < 0.0001]. Differences between the responses of mutant and WT enzymes were determined by Dunnett’s test, with significant differences shown.
Next, we treated the cell lines with dipropylenetriamine NONOate (DPTA) for 4 hours to determine which residues are critical for NO-stimulated CYP2B6 downregulation. As seen in Fig. 1, the Y317A and Y380A enzymes were resistant to NO-evoked downregulation of CYP2B6 protein. WT CYP2B6 was downregulated by 48%, whereas the responses of the Y317A and Y380A mutants were significantly reduced with effect sizes of 21.48 (95% CI 40.85–2.11) and 19.75 (95% CI 39.12–0.38), respectively. Mutation of residues Y203 and Y235 tended to slightly moderate the downregulation, whereas mutation of Y111, Y224, and Y244 residues did not change the downregulation by DPTA and the C180S mutant tended to be more sensitive to NO downregulation than the WT enzyme. In separate experiments, we also generated the Y190A cell line because of the reported Y190 nitration of rat 2B1 (Lin et al., 2003) and the -Y268A and -Y354A cell lines because of reported in vitro nitration of human CYP2B6 by peroxynitrite treatment (Lin et al., 2007). Among them, Y190A tended to reduce susceptibility to NO-dependent downregulation but not the Y268 and –Y354 mutations (Supplemental Fig. 2). These experiments also confirmed the reduced sensitivity of Y317A and Y380A mutants to downregulation (Supplemental Fig. 2). The effects of the mutations on basal expression and activity (Supplemental Fig. 1) did not appear to correlate with their responsiveness to NO (Fig. 1; Supplemental Fig. 2). These results suggest that tyrosine residues Y190, Y317, and Y380 are involved in NO-evoked CYP2B6 downregulation.
CYP2B6V5-Y317A, -Y190A, and -Y380A Mutants Are Less Susceptible to Degradation Elicited by Biologically Generated NO.
Next, we examined whether biologically generated NO can affect CYP2B6 downregulation. We generated a doxycycline-inducible hNOS2 HeLa cell line (Lee et al., 2017) and transduced it with the mutant and WT CYP2B6V5 genes. Cell lines were treated with doxycycline for 18 hours to induce hNOS2 expression, and we confirmed NO generation by measurement of NO2 + NO3 levels in media by Griess reagent (unpublished data). We also measured the downregulation of native CYP51A1 by NO (Park et al., 2017) as a positive control. All cell lines we tested showed CYP51A1 similar downregulation after doxycycline treatment (Fig. 2). In the presence of sustained NO production elicited by doxycycline induction of hNOS2, WT CYP2B6V5 was downregulated by 61%. Consistent with the above experiments using DPTA as an NO donor (Fig. 1; Supplemental Fig. 2), only the Y190A, Y317A, and Y380A mutant enzymes showed significant attenuation of NO-stimulated downregulation of CYP2B6 (Fig. 2). The effect sizes for the mutations were 38.64 (95% CI 58.40–18.88), 39.02 (95% CI 58.78–19.26), and 30.23 (95% CI 49.99–10.47) for Y190A, Y317A, and Y 380A, respectively. Again, the C180S mutation did not suppress the NO-evoked downregulation, suggesting that S-nitrosation on this residue is not responsible for downregulation of CYP2B6 by NO.
Fig. 2.

Downregulation of CYP2B6V5 and its mutant proteins in HeLa-hNOS2 cells. HeLa-hNOS2 cells were transduced with pLX304-2B6V5 or mutant lentiviruses, and CYP2B6V5-expressing cells were selected with puromycin (10 mg/ml)/blasticidin (5 mg/ml) to generate the HeLa-hNOS2-2B6V5 cell lines. After treatment with doxycycline (Dox) (10 mg/ml) for 18 hours, media were collected for NO2 + NO3 assay, and total cell lysates were used for immunoblotting with antibodies to the V5 tag, GAPDH, CYP51A1, and actin. (A) Representative image showing NO-stimulated CYP2B6V5 downregulation. Images of Y111A, Y244A, and C189S were viewed at a higher gain and cut and pasted on the original image for visualization. (B and C) Quantitation of data for CYP2B6 and CYP51A1, respectively. The percent downregulation by doxycycline was calculated for each cell line, in which no downregulation = 100 and complete downregulation = 0. Values are the means and 95% CI of four independent experiments. Differences in response among the groups were tested by ordinary one-way ANOVA [F(11, 36) = 12.97, P < 0.0001]. Differences between the responses of mutant and WT enzymes were determined by Dunnett’s test, with significant differences shown. CYP51A1 was used as a positive control and was not analyzed for significant differences. MW, molecular weight.
Attenuation of DPTA-Evoked HMM Species Formation on CYP2B6V5-Y317A and -Y380A Mutants.
We showed previously that NO-evoked CYP2B6 degradation proceeds via polyubiquitination and proteasomal degradation. Significant increases in HMM species and ubiquitinated CYP2B6 of CYP2B6 were observed with DPTA and proteasome inhibitor cotreatment (Lee et al., 2017). Therefore, we next examined HMM species formation of the mutant enzymes. We selected the Y203A, Y317A, and Y380A mutants as representatives of sensitive and resistant enzymes to NO-dependent downregulation. We found that WT CYP2B6 and the Y203A mutant were downregulated in a time-dependent manner by DPTA treatment (Fig. 3, A and B). Two-way repeated-measures ANOVA with time as a within-subjects factor and cell line as a between-subjects factor revealed a significant interaction of time and cell line on the downregulation [F(4, 12) = 12.74, P = 0.0003]. The Y317A enzyme showed similar downregulation as WT in the first 1 hour, but its downregulation was significantly attenuated by 24.66% (95% CI 43.69–5.64) after 2 hours and by 29.3% (95% CI 48.32–10.28) after 4 hours compared with WT (Fig. 3, A and B). The Y380A mutant demonstrated the same pattern, although differences were only significant at 4 hours (Supplemental Fig. 3C). Even though the Y317A enzyme was resistant to downregulation, it was more susceptible to inhibition by NO than the WT enzyme and the Y203 mutant (Fig. 3C).
Fig. 3.

Formation of HMM species on CYP2B6V5 and Y203A mutant but not Y317A mutant in HuH7 cells. HuH7-2B6V5 cell lines were treated with 500 μM DPTA for the indicated times, and total cell lysates were used for immunoblotting with antibodies to the V5 tag, actin, and GAPDH. (A) Representative Western blot showing time-dependent downregulation of CYP2B6 and mutants by DPTA. (B) Quantified data from three experiments. The left panel shows the time courses from each individual experiment, and the right panel shows means and 95% CI of the differences from 0 time. (C) The enzyme activities of CYP2B6 and mutants, measured by 7-hydroxy-4-trifluoromethylcoumarin formation from EFC. (D) Representative immunoblotting image showing HMM formation on WT 2B6 and Y203A mutant with respect to DPTA treatment. (E) Quantified HMM data from three experiments. The left panel shows the time courses from each individual experiment, and the right panel shows means and 95% CI of the differences from 0 time. For (B and E), data were analyzed by two-way repeated-measures ANOVA with time as a within-subjects factor (1, 2, 4 hours) and cell line as a between-subjects factor. P values for comparisons between groups showing a significant difference by Tukey test are shown. MW, molecular weight.
As seen in Fig. 3, D and E, WT-2B6 and the Y203A mutant showed similar time-dependent patterns of HMM formation with DPTA treatment, which were evident within 1 hour and slowly disappeared after 2 hours because of degradation of ubiquitinated species. Two-way repeated-measures ANOVA again revealed a significant interaction of time and cell line on HMM species formation [F(4, 12) = 12.40, P = 0.0003]. Although the intensity of HMM species formed by Y203A was lower than that of WT (effect size 1.76, 95% CI 0.52–3.01), Y317A did not show the increase of HMM at any time point (Fig. 3, D and E; effect sizes 3.96 and 1.56 at 1 and 2 hours, respectively; 95% CI 2.71–5.20 and 0.32–2.81). Y380A was similarly refractory (Supplemental Fig. 4, A and B).
Immunoprecipitation of CYP2B6V5 followed by Western blotting with ubiquitin antibodies confirmed time-dependent ubiquitination of the WT enzyme during DPTA treatment of the cells (Fig. 4) with a similar time course as the HMM species in Fig. 3. Note that the band patterns of ubiquitinated and HMM bands differ because multiubiquitinated P450s are labeled by multiple ubiquitin antibodies, whereas they are only labeled by a single V5 antibody. The NO-resistant Y380A mutant showed no time-dependent ubiquitination. The Y203A mutant was also ubiquitinated in a time course similar to the WT enzyme but with significantly lower intensity (Fig. 4), which is partially because of the lower expression of the Y203 protein.
Fig. 4.

Ubiquitination of CYP2B6V5 and Y203A mutant but not Y380A mutant in HuH7 cells. HuH7-2B6V5 cell lines were treated with 500 μM DPTA for the indicated times, and total cell lysates were prepared. (A) Total lysates (input) were subjected to Western blotting with anti-V5 to visualize the enzymes and HMM species. (B) The enzymes were precipitated from the total cell lysates with anti-V5 magnetic beads. The immunoprecipitates (I.P.) were blotted with anti-ubiquitin antibodies to reveal ubiquitinated CYP2B6. The lower panel shows the same blot as the upper panel displayed at a higher-gain setting. Data from one of three identical experiments are shown. MW, molecular weight; Ub, ubiquitin.
Next, we examined the effect of the proteasome inhibitor bortezomib on HMM formation with DPTA cotreatment (both reagents added at time 0). Two-way repeated-measures ANOVA revealed a significant interaction of treatment and cell line on HMM species formation [F(6, 18) = 31.36, P = 0.0001]. As seen in Fig. 5, 3 hours of DPTA treatment alone did not enhance the HMM signal of WT, Y203A, or Y317A enzymes (due to degradation of HMM species), and bortezomib treatment alone showed a slight increment of HMM species for all three proteins. WT-2B6 and the Y203A mutant showed significant increases of HMM species when cells were cotreated with DPTA and bortezomib compared with bortezomib alone (Fig. 5, A and C; effect sizes 10.71 and 6.58, respectively; 95% CI 8.80–12.62 and 4.67–8.49), whereas Y317A did not. The Y380A mutant also failed to exhibit DPTA-stimulated HMM formation (Supplemental Fig. 4C). Interestingly, the protein degradation of Y317A and Y380A appeared to be slightly stimulated with DPTA/bortezomib cotreatment compared with DPTA treatment alone (Fig. 5, A and B; Supplemental Fig. 4C). Taken together, our results show that Y317A and Y380A mutations were resistant to NO-dependent HMM species formation, ubiquitination, and proteasomal degradation.
Fig. 5.

Accumulation of HMM on CYP2B6V5 and tyrosine mutants in HuH7 cells. HuH7-2B6V5 cell lines were treated with medium (C), DPTA (D, 500 mM), bortezomib (B, 10 mM), or DPTA + bortezomib (D/B) at 0 hours. Cells were harvested at 3 hours, and total cell lysates were used for immunoblotting with antibodies to the V5 tag and GAPDH. (A) Representative immunoblotting image showing HMM accumulation on WT 2B6 and the Y203A mutant with respect to DPTA and bortezomib treatments. The top panel is a higher-gain imaging software rendering of the lower panel to show HMM. Both panels are black and white transformations of the colored infrared blots. (B) Quantification of CYP2B6 protein levels. Values are means and 95% CI. (C) Quantification of HMM species. Values are the means and 95% CI of three independent experiments, and levels relative to the respective controls are shown. Data were analyzed by two-way repeated-measures ANOVA with treatment group treated as a within-subjects factor to account for clustering and cell line treated as a between-subjects factor. P values for comparisons (Tukey test) between bortezomib and DPTA/bortezomib groups within each cell line are shown. Bort, bortezomib; Con, control; MW, molecular weight.
Equilibrium Molecular Dynamics.
To assess the potential impact of tyrosine nitration on the physical structure of CYP2B6, the behavior of the wild-type enzyme monitored by molecular dynamics simulation was compared with the behavior of CYP2B6 systems wherein tyrosines 190, 317, or 380 are replaced with 3-NIY; the focus was on those tyrosine residues whose mutation was found to attenuate downregulation by NO (Fig. 6). A system containing CYP2B6 with NIY at residue 235 was used to monitor behavior of the enzyme when a residue whose mutation did not attenuate downregulation by NO is modified. Simulations were run for 10 nanoseconds for wild-type CYP2B6 and systems containing Y190NIY, Y317NIY, and Y380NIY. The Y235NIY system destabilized within the first 5 picoseconds, so a model of CYP2B6 Y235NIY was built using the more stable X-ray crystal structure sequence (CYP2B6 Y226H/K262R, Supplemental Data 11). After preparing this system, the simulation was stable for 5 nanoseconds prior to failure. The distribution of root-mean-square deviation (RMSD) values for the five simulations indicates that the systems containing 3-nitrotyrosine generally display less change from the original structure than the wild-type enzyme (Supplemental Fig. 5B). Interestingly, the most stable system was Y380NIY. The wild-type, Y190NIY, and Y317NIY systems displayed significantly more backbone fluctuation across simulation than Y235NIY or Y380NIY, but after 5 nanoseconds, the protein structure was intact for all systems but Y235NIY (Supplemental Fig. 5B). In contrast, all alanine mutants showed lower backbone fluctuation and lower distribution of RMSD values than wild-type CYP2B6 (Supplemental Fig. 5, A and B). Furthermore, the Y235A system was stable for the entire 10-nanosecond simulation. The nitro group of NIY235 formed a stable hydrogen bond with the F107 backbone nitrogen; however, when NIY235 rotated, disrupting this interaction within the next 100 picoseconds, the G-Helix (residues ∼228–255) began to unwind, and the heme was lost. The K262R substitution likely contributes to stabilization of CYP2B6 via a hydrogen-bonding network at the C-terminal end of the G-Helix (Gay et al., 2010; Wilderman et al., 2012). The inclusion of this substitution in the simulation system likely masked destabilization of the G-Helix by the Y235NIY substitution.
Fig. 6.

The location of select tyrosines modified or mutated for these simulations is shown in views from above the heme (left) and the side (right). The heme is shown in sticks and colored red, and the selected tyrosines are shown as spheres and colored black.
Since protein motion in solution is related to ligand binding and enzyme function, dynamic crosscorrelation analyses were done to assess the stability of the systems relative to wild-type CYP2B6 and the respective alanine mutants. Dynamic crosscorrelation analysis reveals information about protein motions relative to other protein residues during a simulation. Dynamic crosscorrelation maps can capture changes due to nitration or mutation in protein behavior as a whole. Although only small changes were seen in Y190NIY, Y317NIY, and Y380NIY versus the wild-type system, protein motions overall were dampened in the Y235NIY system (Supplemental Fig. 5C). In contrast, protein motions were dampened in Y190A, Y317A, and Y380A relative to wild-type CYP2B6, but correlated motions of Y235A were of similar magnitude to the wild-type, Y190NIY, Y317NIY, and Y380NIY systems.
Correlated protein motions and enzyme function are dependent on the secondary and tertiary structure of the protein itself, so the secondary structure of CYP2B6 in each system was analyzed using the stand-alone of DSSP version 3.0 for the last nanoseconds of the simulation (Kabsch and Sander, 1983; Touw et al., 2015). The DSSP algorithm and program provide the most likely secondary structure for the given three-dimensional structure of a protein, and the analysis here represents changes in secondary structural elements with respect to time. As expected, the majority of each system is composed of α-helices and a small portion of β-sheets; however, significant differences between the wild-type system or systems in which tyrosine mutation attenuates NO-mediated downregulation (190, 317, and 380) and the system in which mutation does not significantly alter downregulation (235) are revealed (Supplemental Fig. 6). Nitration at each site caused changes in the secondary structure of residues 400–440. This stretch of amino acids stabilizes the heme-coordinating cysteine residue C436, and these residues are on the face of the protein that interacts with NADPH–cytochrome P450 reductase. In the Y235NIY system, additional changes are seen in the B-C loop (residues 100–120, a wall of the active site) and the residues ∼220–236, a cap on the active site (Figs. 7 and 8A left inset). Furthermore, the terminal loop in the Y235NIY system shifts >7 Å toward the I-helix (Fig. 8A right inset). This disruption in Y235NIY is detrimental to the integrity of the CYP2B6 active site, opening a channel to the solvent throughout the simulation (Fig. 8B). In contrast, disruptions in the β-sheet region near Y380 do not appear to have an effect on protein stability and processing, since these changes are seen in Y235NIY, Y380NIY, and Y380A (Fig. 8, C and D), and further minor disruptions to secondary structure are seen in the systems containing alanine mutants (Supplemental Fig. 7). These results indicate that tyrosine nitration leads to a modification of enzyme stability and dynamics that promote NO-mediated degradation.
Fig. 7.

Secondary structure of CYP2B6 WT vs. CYP2B6 Y235NIY during the last nanosecond of each simulation. Significant changes in secondary structure compared with wild-type (WT) CYP2B6 are marked with red circles. a-helix: blue; b-sheet: red; bend: green; p-helix: violet; 310-helix: gray; turn: yellow.
Fig. 8.

Secondary structure of CYP2B6 after tyrosine nitration. (A) Comparison of CYP2B6 WT (green) and Y235NIY (blue) displaying loss of the G’-helix (left inset, from black asterisk) and the altered location of the terminal loop (right inset, from magenta asterisk). (B) The changes in the F-, F’-, G’, and G-helices coupled with the altered terminal loop resulted in an open channel from the active site to the solvent throughout the entire simulation. (C) The β-sheets near residue 380 were also lost in Y235NIY (magenta) and Y380NIY (blue) compared with the wild-type system (green). (D) This loss of the β-sheets was not as dramatic in Y235A (magenta) when compared with the wild-type (green) but was still present in Y380A (blue).
Effect of Carbon Monoxide on CYP2B6V5 Degradation and HMM Generation.
Since NO and CO both form complexes with P450 heme, we hypothesized that if heme nitrosylation could affect CYP2B6 stability, CO binding might have a similar effect. CO binds tightly to ferrous P450 enzymes with resultant inhibition (Omura and Sato, 1964; Koley et al., 1994; Blumenthal, 2001; Guengerich et al., 2009). To address this hypothesis, we examined the effect of CORM2, a CO-releasing molecule on the formation of HMM species, enzyme activity, and degradation of protein. We used either 1 or 2 hours of CORM2 treatment because of its relatively short half-life (Motterlini et al., 2002) in media at 37°C. As seen in Fig. 9A, CORM2 treatment of 2 hours resulted in a rapid and severe decrease of enzyme activity comparable to that of DPTA. In contrast to DPTA, CORM2 did not affect CYP2B6 protein levels (Fig. 9A). Interestingly, CORM2 treatment resulted in enhancement of HMM species, and CORM2/DPTA cotreatment generated higher levels of HMM compared with CORM2 alone (Fig. 9B), whereas CORM2 and DPTA cotreatment resulted in similar levels of protein downregulation compared with DPTA alone (Fig. 9A). Importantly, degraded CORM2 had no effect (Supplemental Fig. 8), suggesting that the effect of CORM2 is due to CO release and not to the reactivity of the ruthenium component. Notably, the patterns of HMM species of CYP2B6 elicited by DPTA and CORM2 were different: CORM2 produced more HMM and ubiquitinated accumulation at higher molecular masses (>170 kDa) than did DPTA (compare Figs. 3D and 9B). These data suggest that binding of CO to heme was sufficient to suppress 2B6 enzyme activity but did not cause protein degradation. Next, we examined whether the HMM generated by CORM2 treatment corresponded to the polyubiquitinated form. HuH7-2B6V5 WT cells were transiently transfected with a pCMV-hemagglutinin (HA)-ubiquitin plasmid expressing HA-tagged ubiquitin and then treated with DPTA and CORM2 for 1 hour. Again, CORM2 induced HMM formation (Fig. 9C). After immunoprecipitation of CYP2B6V5 protein, the HA signal was significantly enhanced by DPTA or CORM2 treatment (Fig. 9D), suggesting that the HMM species generated by CORM2 treatment corresponded to the polyubiquitinated enzyme.
Fig. 9.

Effect of CORM2 on activity, protein levels, and HMM species formation in HuH7 cells. (A) HuH7-2B6V5 cell lines were treated with medium (Con), DPTA (D, 500 mM), CORM2 (1 mM), or DPTA/CORM2 for 2 hours. CYP2B6 activities were measured as described in the text, and total cell lysates were used for immunoblotting with antibodies to the V5 tag and GAPDH. Values are means and 95% CI, n = 4. (B) Representative immunoblotting image showing significant HMM species accumulation with CORM2 treatments from three independent experiments. (C) HuH7-2B6V5 cells were transiently transfected with pCMV-HA-ubiquitin, they were treated with DPTA or CORM2 for 1 hour, and cell lysates were subjected to immunoprecipitation with anti-V5 agarose. The lysates and immunoprecipitates were subjected to immunoblotting with anti-V5. (D) The immunoprecipitates were subjected to Western blotting with HA antibodies. Con, control; MW, molecular weight.
Next we examined HMM species formation by CORM2 compared with DPTA treatment on the Y317A and Y380A mutants (Fig. 10). Two-way repeated-measures ANOVA revealed a significant interaction of treatment and cell line on HMM species formation [F(6, 18) = 13.16, P < 0.0001]. As seen in Fig. 10, 1 hour of CORM2 treatment resulted in a 5-fold increase of HMM species on WT CYP2B6 (effect size 4.38, 95% CI 5.21–3.56), whereas DPTA treatment generated a 2-fold increase (effect size 1.15, 95% CI 1.97–0.33). However, HMM species of Y317A and Y380 mutants were still enhanced by CORM2 treatment (Fig. 10, effect sizes 1.99 and 1.11, respectively; 95% CI 2.81–1.17 and 1.93–0.29). The Y203A mutant also showed significant increase of HMM species with CORM2 treatment, which was similar to WT (Supplemental Fig. 9).
Fig. 10.

CORM2-stimulated HMM species formation in CYP2B6 mutant enzymes. HuH7 cells expressing WT-CYP2B6V5 or the Y317A and Y380A mutants were treated with DPTA (500 mM) or CORM2 (1 mM) for the indicated time, and total cell lysates were subjected to immunoblotting. (A) Representative immunoblotting image. (B) Quantified data from three independent experiments. Values are the means and 95% CI relative to controls. Quantification of HMM species. Values are the means and 95% CI of three independent experiments and levels relative to the respective controls are shown. Data were analyzed by two-way repeated-measures ANOVA with treatment group treated as a within-subjects factor to account for clustering and cell line treated as a between-subjects factor. P values (Tukey test) for groups exhibiting significant differences from WT are shown, ****P < 0.0001. Con, control; MW, molecular weight.
Effect of CYP2B6 Enzyme Inhibitor on NO-Stimulated Downregulation.
We reported previously that danazol, an inhibitor of CYP2J2, blocks the NO-stimulated degradation of that enzyme (Park et al., 2018). Therefore, we conducted exploratory experiments to determine whether downregulation of CYP2B6 by NO is also blocked by an inhibitor of the enzyme, 4CPI. As expected, 4CPI potently inhibited cellular CYP2B6 activity, with an IC50 of approximately 2 nM. Complete inhibition occurred at 300 nM (Fig. 11A). Notably, 4CPI also blocked the downregulation of CYP2B6 protein by DPTA, and the IC50 corresponded well with the concentration of 4CPI required to completely inhibit the enzyme (Fig. 11, B and C).
Fig. 11.

Effect of 4CPI on DPTA-induced 2B6 downregulation. HuH7-2B6V5 cells were treated with various concentrations of 4CPI or 4CPI and 500 mM DPTA for 4 hours. (A) After removing media, CYP assay buffer containing the substrate 7-EFC was added to the cells. After 10 minutes incubation, the assay buffer was harvested for the measurement of enzyme assay. (B) Total cell lysates were subjected to immunoblotting with rabbit anti-V5, anti-actin, and GAPDH. (C) Quantification of the blots. The panels each represent a single experiment. However, we have observed 4CPI inhibition of CYP2B6V5 downregulation in several different experimental designs. MW, molecular weight.
Recovery of Enzyme Activity.
Previously we showed that CYP2J2 activity was rapidly recovered by washing the cells after DPTA treatment, which we interpreted as being due to a possible reversible modification of CYP2J2 by NO (Park et al., 2018). Here, we treated cells with DPTA for various times, washed the cells twice with the culture media, and added assay buffer containing EFC to measure enzyme activity. In control cells, media were replaced with assay buffer without washing. Unlike CYP2J2, CYP2B6 activity was not recovered with washing (Supplemental Fig. 10). When cells were washed twice and then incubated for an additional 2 hours before measuring enzyme activity, the activity slightly recovered from around 20%–35% of control (Supplemental Fig. 11) whether cycloheximide was present or not. However, the enzyme activity was not fully recovered to the level of protein expression after 2 hours of washing and incubation (Supplemental Fig. 11).
Discussion
The data provide strong evidence that nitration of specific tyrosine residues is an important step in triggering NO-dependent degradation of CYP2B6. First, mutation of tyrosine to alanine at residues Y190, Y317, or Y380 conferred partial resistance to NO-dependent degradation (Figs. 1 and 2). Secondly, those mutants did not show enhancement of HMM species formation or ubiquitination with DPTA treatment (Figs. 3 and 4), nor did they show NO-dependent accumulation of HMM in the presence of a proteasome inhibitor (Fig. 5). Thirdly, washing and recovery from NO exposure did not result in significant attenuation or reversal of the decreases in CYP2B6 protein or activity (Supplemental Figs. 10 and 11), suggesting a practically irreversible process. Finally, molecular dynamics simulations predicted that modifications of any of these tyrosine residues would result in marked changes in protein secondary structure and destabilization. Such destabilization may be responsible for the lower basal expression of the mutants. These findings are consistent with a model in which NO-stimulated degradation is caused by an accumulation of nitrative modifications on the specified tyrosines. Our attempts to express the relevant double mutants have been unsuccessful.
In general, the tyrosine mutants had lower levels of expression and enzymatic activity than the WT enzyme, which complicates interpretation of the data. The fact that four tyrosine mutants (Y111A, Y224A, Y235A, and Y244A) with reduced catalytic activity were similarly downregulated by NO as the WT enzyme suggests that the reduced catalytic activity of the Y190A, Y317A, and Y380A mutants is not the reason for their reduced sensitivity to downregulation by NO. We recently demonstrated that catalytic inactivation of CYP2A6 by the mechanism-based inhibitor methoxypsoralen does not affect its susceptibility to downregulation, thereby demonstrating that downregulation by NO does not require catalytic activity of that enzyme (Cerrone et al., 2020). Although the lower expression levels of some mutants would be expected to affect their initial rates of NO-stimulated degradation, lower basal expression would not be expected to affect the first-order fractional degradation rate per se. Therefore, we calculated all of our results as a fraction (percentage) of the starting enzyme levels.
If tyrosine nitration is responsible for triggering ubiquitination and degradation of CYP2B6, one would expect to be able to detect accumulation of nitrotyrosine, especially in the presence of proteasome inhibitors. Using MS/MS, Hollenberg’s group identified several nitrated residues on P450 enzymes after in vitro peroxynitrite treatment (Lin et al., 2003, 2007, 2012). We were also able to detect nitration of peroxynitrite-treated CYP2B6V5 by immunoblotting after immunprecipitation (Supplemental Fig. 12). Both WT and tyrosine mutant enzymes were nitrated, confirming that the enzyme was nitrated on multiple residues. However, we could not detect tyrosine nitration from either peroxynitrite or DPTA-treated HeLa or HuH7 cells by immunologic or MS/MS studies (unpublished data). One of the reasons may be the rapid degradation, once nitrated, of CYP2B6 in the cells since the time courses of inhibition and downregulation of CYP2B6 protein and activity by DPTA were almost identical (Lee et al., 2017) (Supplemental Fig. 10). CYP2B6 degradation is only partially blocked by proteasome inhibition [e.g., Fig. 5, (Lee et al., 2017)], suggesting that other protease systems can take over under such conditions. The participation of multiple mechanisms could be the reason why the tyrosine mutants showed similar degradation as the WT enzyme in the first hour of treatment (not tyrosine nitration–dependent) and then were resistant at later times (Fig. 3A; Supplemental Fig. 3). One such mechanism occurring in the 1st hour could be formation of insoluble protein aggregates or crosslinked species that are not solubilized by SDS-PAGE buffers. The abundance of nitrotyrosine residues in the cellular proteome is very low, such that even with modern MS/MS technology they are very difficult to detect (Zhan et al., 2015). If nitrated CYP2B6 is a very low fraction of the total at any given time because of rapid degradation of the modified enzyme, it might be very difficult to identify the modified peptide by MS/MS, especially when multiple modified residues can contribute to the degradation. Finally, there is the possibility of cellular denitrase activity, which has been described (Deeb et al., 2013) although somewhat controversial.
In addition to Y190, Y317, and Y380, which we identified as critical for NO-dependent degradation, Hollenberg’s group identified Y354 (primary site), Y244, Y268, and Y380 of human CYP2B6 and Y317 (primary site), Y422, Y69, and Y380 in human CYP2E1 (Lin et al., 2007) as susceptible to in vitro nitration. We found that mutation of Y244, Y268, and Y354 did not attenuate downregulation by NO, thus they do not appear to be critical for NO-dependent 2B6 degradation. Lin et al. (2012) proposed that tyrosine residues of CYP3A4 nitrated in vitro are critical for interaction with P450 reductase (CPR). Residues Y190, Y317, and Y380 of CYP2B6 identified to be important for downregulation, although having reduced catalytic activities, are not in areas likely to be at the CPR-CYP2B6–binding interface based on the X-ray crystal structure of CYP2B6 [PDB ID: 3IBD; (Gay et al., 2010)] and chemical crosslinking experiments between CPR and CYP2B6 (Bumpus and Hollenberg, 2010). Thus, nitration of CYP2B6 tyrosines likely does not interfere with electron transfer from CPR to the CYP2B6 heme.
It was interesting that the C180S mutant tended to be more sensitive to NO downregulation than the WT enzyme. We were not able to detect stimulated S-nitrosylation in cells with either DPTA or S-nitrosoglutathione treatments (unpublished data). At the least, these results rule out modification of C180 as being responsible for degradation.
Treatment of cells with the CYP2B6 inhibitor 4CPI prevented NO-stimulated degradation of the enzyme, a phenomenon we reported recently for CYP2J2 and its inhibitor danazol (Park et al., 2018). This could be interpreted to suggest that tyrosine nitration of CYP2B6 is a heme-catalyzed reaction analogous to tyrosine nitration of prostacyclin synthase (CYP8A1) upon exposure to peroxynitrite (Zou et al., 2000). Bacterial CYP102 incubated with high concentrations of NO results in dissociation of the NO from the ferriheme complex and nitration of Y51 (Quaroni et al., 2004). In both of these enzymes the nitrated tyrosine lies close to the heme-binding pocket. Cytochrome c can also mediate nitration of tyrosines adjacent to its heme or indeed on other protein species (Castro et al., 2004). However, the residues we identified in the current study to be important for NO-mediated degradation; in other words, Y190, Y317, and Y380 are located on the surface of the protein (Fig. 6). Moreover Y111A, with the lowest specific activity of all the mutants we tested, was fully responsive to downregulation by NO (Figs. 1 and 2). These observations, together with the recent discovery that downregulation of CYP2A6 does not require a catalytically active enzyme (Cerrone et al., 2020), suggests that inhibition of CYP2B6 activity is not the reason why 4CPI inhibits its downregulation.
Ligand binding causes large conformational changes in P450 enzymes, which are particularly prominent in CYP2B enzymes (Scott et al., 2004). However, the surface accessibilities of Y190, Y317, and Y380 do not change substantially upon 4CPI binding (Table 1), suggesting that the inhibitor is unlikely to affect nitration of the enzyme by this mechanism.
The most likely explanation for our findings is that 4CPI inhibits binding of NO to the heme, which is required for downregulation. Early studies of NO-P450 interactions in primary rat hepatocytes provided evidence that NO causes dissociation of heme from some P450 enzymes (Kim et al., 1995). It is unclear whether this caused degradation of the enzyme because observed decreases in enzyme activity were completely reversed by dialysis with heme. In vitro, NO inhibits bacterial CYP51A almost irreversibly, which was postulated to be due to breakage of the heme-axial thiolate bond and possible nitrosation of the cysteine (Ouellet et al., 2009). This property is likely to be different for different P450 enzymes, since NO was reported to form a stable nitrosyl complex with the ferriheme of CYP1A2 (Nakano et al., 1996). Tyrosine nitration can be inhibited by substrate binding to other enzymes, including cyclooxygenase-1 (Deeb et al., 2010) and prostaglandin H2 synthase-1 (Deeb et al., 2006).
To further address the possibility that heme ligation is involved in the mechanism of NO-evoked degradation, we treated cells with CORM2, which releases the prototypic P450 inhibitor CO. CORM2 treatment powerfully inhibited the enzyme, but it did not cause degradation of CYP2B6. Unexpectedly, CORM2 treatment evoked formation of HMM species and ubiquitination of the enzyme (Figs. 9 and 10). Unlike DPTA treatment, the HMM species accumulated over time because they were not degraded. This was not due to depletion of cellular ATP by CORM2, since CORM2 did not inhibit the DPTA-stimulated degradation of the enzyme (Fig. 9A). Moreover, the Y317A and Y380A mutants showed HMM accumulation when exposed to CORM2 but not NO (Fig. 9), suggesting that heme nitrosylation by NO is not sufficient for formation of HMM or degradation.
As noted previously, the patterns of HMM and ubiquitinated CYP2B6 evoked by CORM2 were different than those caused by DPTA, suggesting that either 1) CORM2 causes a higher level of polyubiquitination than does DPTA or 2) that the composition of the HMM complexes could be fundamentally different. Notably, Zangar et al. (2002) described the formation of HMM and ubiquitinated species of CYP3A enzymes >170 kDa during in vitro incubations of microsomes from rats treated with substrate stabilizers of the enzymes and concluded that these species were formed by a mechanism different than the classic ubiquitination pathway.
An alternate explanation for our results is that tyrosine nitration negatively alters protein structure and conformational dynamics in solution. Protein structure and conformational dynamics are intimately tied to enzyme function, and altering enzyme dynamics modifies enzyme function and stability (Kohen, 2015; Guo and Zhou, 2016). CYP2B6 likely adopts an ensemble of conformations in solution, as proposed for CYP2B4 (Wilderman et al., 2012). Changes in the conformational equilibrium are prompted by tyrosine nitration and protein degradation. However, the addition of 4CPI to CYP2B6 cultures blocked NO-mediated degradation; 4CPI binding to CYP2B6 likely limits the destabilizing effects of tyrosine nitration by promoting the stable complex with 4CPI and limiting the number of possible conformations. Furthermore, nitration of tyrosines significantly impacts the CYP2B6 conformational equilibrium by disrupting secondary structural motifs.
In summary, our results point to a crucial role for tyrosine nitration in the NO-stimulated degradation of CYP2B6 as well as a likely role for heme binding of NO in stimulating degradation. We propose a unifying hypothesis in which accumulated nitrations at Y190, Y317, and Y380 together with heme nitrosylation and/or dissociation cause synergistic destabilization of the enzyme, resulting in its ubiquitination and degradation. In addition, we discovered a novel effect of CO on CYP2B6, in which exposure to CO in a cellular context leads to ubiquitination of the enzyme but not its degradation. More work is needed on the broad applicability of this observation to other P450 enzymes and to discover what may be the biologic consequences, if any.
Acknowledgments
We thank James R. Halpert, University of Connecticut, for support of the computational work and Bilikallahalli Muralidhara, Acceleron Pharma Inc., for advice on modeling surface accessibility of CYP2B enzymes.
Abbreviations
- CI
confidence interval
- CORM2
carbon monoxide–releasing molecule 2
- 4CPI
4-(4-chlorophenyl)imidazole
- CPR
P450 reductase
- DPTA
dipropylenetriamine NONOate
- EFC
7-ethoxy-4-trifluoromethylcoumarin
- GAPDH
glyceraldehyde-3-phosphate dehydrogenase
- HA
hemagglutinin
- HMM
high molecular mass
- hNOS2
human NOS2
- mAb
monoclonal antibody
- MS/MS
tandem mass spectrometry
- NIY
nitrotyrosine
- NO
nitric oxide
- NOS
NO synthase
- P450
cytochrome P450
- PCR
polymerase chain reaction
- PDB
Protein Data Base
- RMSD
root-mean-square deviation
- WT
wild type
Authorship Contributions
Participated in research design: Lee, Wilderman, Park, Murphy, Morgan.
Conducted experiments: Lee, Wilderman, Park.
Performed data analysis: Lee, Wilderman, Park, Murphy, Morgan.
Wrote or contributed to the writing of the manuscript: Lee, Wilderman, Park, Murphy, Morgan.
Footnotes
This work was supported by National Institutes of Health National Institute of General Medical Science and National Institute of Environmental Health Sciences [Grants R01-GM069971 and R01-ES003619] (to E.T.M. and J.R.H). Computational work was also supported by internal funding from the University of Connecticut.
 This article has supplemental material available at molpharm.aspetjournals.org.
References
- Abraham MJ, Murtola M, Schulz R, Páll S, Smith JC, Hess B, Lindahl E. (2015) GROMACS: high performance molecular simulations through multi-level parallelism from laptops to supercomputers. SoftwareX 1–2:19–25. [Google Scholar]
- Aitken AE, Lee CM, Morgan ET. (2008) Roles of nitric oxide in inflammatory downregulation of human cytochromes P450. Free Radic Biol Med 44:1161–1168. [DOI] [PMC free article] [PubMed] [Google Scholar]
- Blumenthal I. (2001) Carbon monoxide poisoning. J R Soc Med 94:270–272. [DOI] [PMC free article] [PubMed] [Google Scholar]
- Bumpus NN, Hollenberg PF. (2010) Cross-linking of human cytochrome P450 2B6 to NADPH-cytochrome P450 reductase: identification of a potential site of interaction. J Inorg Biochem 104:485–488. [DOI] [PMC free article] [PubMed] [Google Scholar]
- Bussi G, Donadio D, Parrinello M. (2007) Canonical sampling through velocity rescaling. J Chem Phys 126:014101. [DOI] [PubMed] [Google Scholar]
- Castro L, Eiserich JP, Sweeney S, Radi R, Freeman BA. (2004) Cytochrome c: a catalyst and target of nitrite-hydrogen peroxide-dependent protein nitration. Arch Biochem Biophys 421:99–107. [DOI] [PubMed] [Google Scholar]
- Cerrone J, Jr., Lee C-M, Mi T, Morgan ET. (2020) Nitric oxide mediated degradation of CYP2A6 via the ubiquitin-proteasome pathway in human hepatoma cells. Drug Metab Dispos 48:544–552. [DOI] [PMC free article] [PubMed] [Google Scholar]
- Deeb RS, Cheung C, Nuriel T, Lamon BD, Upmacis RK, Gross SS, Hajjar DP. (2010) Physical evidence for substrate binding in preventing cyclooxygenase inactivation under nitrative stress. J Am Chem Soc 132:3914–3922. [DOI] [PMC free article] [PubMed] [Google Scholar]
- Deeb RS, Hao G, Gross SS, Lainé M, Qiu JH, Resnick B, Barbar EJ, Hajjar DP, Upmacis RK. (2006) Heme catalyzes tyrosine 385 nitration and inactivation of prostaglandin H2 synthase-1 by peroxynitrite. J Lipid Res 47:898–911. [DOI] [PubMed] [Google Scholar]
- Deeb RS, Nuriel T, Cheung C, Summers B, Lamon BD, Gross SS, Hajjar DP. (2013) Characterization of a cellular denitrase activity that reverses nitration of cyclooxygenase. Am J Physiol Heart Circ Physiol 305:H687–H698. [DOI] [PMC free article] [PubMed] [Google Scholar]
- Denninger JW, Marletta MA. (1999) Guanylate cyclase and the. NO/cGMP signaling pathway. Biochim Biophys Acta 1411:334–350. [DOI] [PubMed] [Google Scholar]
- Donato MT, Jiménez N, Castell JV, Gómez-Lechón MJ. (2004) Fluorescence-based assays for screening nine cytochrome P450 (P450) activities in intact cells expressing individual human P450 enzymes. Drug Metab Dispos 32:699–706. [DOI] [PubMed] [Google Scholar]
- Ebel RE, O’Keefe DH, Peterson JA. (1975) Nitric oxide complexes of cytochrome P-450. FEBS Lett 55:198–201. [DOI] [PubMed] [Google Scholar]
- Ferrari L, Peng N, Halpert JR, Morgan ET. (2001) Role of nitric oxide in down-regulation of CYP2B1 protein, but not RNA, in primary cultures of rat hepatocytes. Mol Pharmacol 60:209–216. [DOI] [PubMed] [Google Scholar]
- Gay SC, Shah MB, Talakad JC, Maekawa K, Roberts AG, Wilderman PR, Sun L, Yang JY, Huelga SC, Hong WX, et al. (2010) Crystal structure of a cytochrome P450 2B6 genetic variant in complex with the inhibitor 4-(4-chlorophenyl)imidazole at 2.0-A resolution. Mol Pharmacol 77:529–538. [DOI] [PMC free article] [PubMed] [Google Scholar]
- Guengerich FP, Martin MV, Sohl CD, Cheng Q. (2009) Measurement of cytochrome P450 and NADPH-cytochrome P450 reductase. Nat Protoc 4:1245–1251. [DOI] [PMC free article] [PubMed] [Google Scholar]
- Guo J, Zhou HX. (2016) Protein allostery and conformational dynamics. Chem Rev 116:6503–6515. [DOI] [PMC free article] [PubMed] [Google Scholar]
- Hess B, Bekker H, Berendsen HJC, Fraaije GEM. (1998) LINCS: a linear constraint solver for molecular simulations. J Comput Chem 18:1463–1472. [Google Scholar]
- Kabsch W, Sander C. (1983) Dictionary of protein secondary structure: pattern recognition of hydrogen-bonded and geometrical features. Biopolymers 22:2577–2637. [DOI] [PubMed] [Google Scholar]
- Kim S, Ponka P. (2000) Effects of interferon-gamma and lipopolysaccharide on macrophage iron metabolism are mediated by nitric oxide-induced degradation of iron regulatory protein 2. J Biol Chem 275:6220–6226. [DOI] [PubMed] [Google Scholar]
- Kim YM, Bergonia HA, Müller C, Pitt BR, Watkins WD, Lancaster JR., Jr. (1995) Loss and degradation of enzyme-bound heme induced by cellular nitric oxide synthesis. J Biol Chem 270:5710–5713. [DOI] [PubMed] [Google Scholar]
- Kohen A. (2015) Role of dynamics in enzyme catalysis: substantial versus semantic controversies. Acc Chem Res 48:466–473. [DOI] [PMC free article] [PubMed] [Google Scholar]
- Koley AP, Robinson RC, Markowitz A, Friedman FK. (1994) Kinetics of CO binding to cytochromes P450 in the endoplasmic reticulum. Biochemistry 33:2484–2489. [DOI] [PubMed] [Google Scholar]
- Lee CM, Kim BY, Li L, Morgan ET. (2008) Nitric oxide-dependent proteasomal degradation of cytochrome P450 2B proteins. J Biol Chem 283:889–898. [DOI] [PMC free article] [PubMed] [Google Scholar]
- Lee CM, Lee BS, Arnold SL, Isoherranen N, Morgan ET. (2014) Nitric oxide and interleukin-1β stimulate the proteasome-independent degradation of the retinoic acid hydroxylase CYP2C22 in primary rat hepatocytes. J Pharmacol Exp Ther 348:141–152. [DOI] [PMC free article] [PubMed] [Google Scholar]
- Lee CM, Pohl J, Morgan ET. (2009) Dual mechanisms of CYP3A protein regulation by proinflammatory cytokine stimulation in primary hepatocyte cultures. Drug Metab Dispos 37:865–872. [DOI] [PMC free article] [PubMed] [Google Scholar]
- Lee CM, Tripathi S, Morgan ET. (2017) Nitric oxide-regulated proteolysis of human CYP2B6 via the ubiquitin-proteasome system. Free Radic Biol Med 108:478–486. [DOI] [PMC free article] [PubMed] [Google Scholar]
- Lin HL, Kenaan C, Zhang H, Hollenberg PF. (2012) Reaction of human cytochrome P450 3A4 with peroxynitrite: nitrotyrosine formation on the proximal side impairs its interaction with NADPH-cytochrome P450 reductase. Chem Res Toxicol 25:2642–2653. [DOI] [PMC free article] [PubMed] [Google Scholar]
- Lin HL, Kent UM, Zhang H, Waskell L, Hollenberg PF. (2003) Mutation of tyrosine 190 to alanine eliminates the inactivation of cytochrome P450 2B1 by peroxynitrite. Chem Res Toxicol 16:129–136. [DOI] [PubMed] [Google Scholar]
- Lin HL, Myshkin E, Waskell L, Hollenberg PF. (2007) Peroxynitrite inactivation of human cytochrome P450s 2B6 and 2E1: heme modification and site-specific nitrotyrosine formation. Chem Res Toxicol 20:1612–1622. [DOI] [PubMed] [Google Scholar]
- Liu Z, Dai X, Zhu H, Zhang M, Zou MH. (2015) Lipopolysaccharides promote S-nitrosylation and proteasomal degradation of liver kinase B1 (LKB1) in macrophages in vivo. J Biol Chem 290:19011–19017. [DOI] [PMC free article] [PubMed] [Google Scholar]
- Minamiyama Y, Takemura S, Imaoka S, Funae Y, Tanimoto Y, Inoue M. (1997) Irreversible inhibition of cytochrome P450 by nitric oxide. J Pharmacol Exp Ther 283:1479–1485. [PubMed] [Google Scholar]
- Miyamoto S, Kollman PA. (1992) An analytical version of the SHAKE and RATTLE algorithm for rigid water models. J Comput Chem 13:952–962. [Google Scholar]
- Morgan ET. (2009) Impact of infectious and inflammatory disease on cytochrome P450-mediated drug metabolism and pharmacokinetics. Clin Pharmacol Ther 85:434–438. [DOI] [PMC free article] [PubMed] [Google Scholar]
- Motterlini R, Clark JE, Foresti R, Sarathchandra P, Mann BE, Green CJ. (2002) Carbon monoxide-releasing molecules: characterization of biochemical and vascular activities. Circ Res 90:E17–E24. [DOI] [PubMed] [Google Scholar]
- Nakano R, Sato H, Watanabe A, Ito O, Shimizu T. (1996) Conserved Glu318 at the cytochrome P450 1A2 distal site is crucial in the nitric oxide complex stability. J Biol Chem 271:8570–8574. [DOI] [PubMed] [Google Scholar]
- Oda A, Yamaotsu N, Hirono S. (2005) New AMBER force field parameters of heme iron for cytochrome P450s determined by quantum chemical calculations of simplified models. J Comput Chem 26:818–826. [DOI] [PubMed] [Google Scholar]
- Omura T, Sato R. (1964) The carbon monoxide-binding pigment of liver microsomes. I. Evidence for its hemoprotein nature. J Biol Chem 239:2370–2378. [PubMed] [Google Scholar]
- Ouellet H, Lang J, Couture M, Ortiz de Montellano PR. (2009) Reaction of Mycobacterium tuberculosis cytochrome P450 enzymes with nitric oxide. Biochemistry 48:863–872. [DOI] [PMC free article] [PubMed] [Google Scholar]
- Park JW, Byrd A, Lee CM, Morgan ET. (2017) Nitric oxide stimulates cellular degradation of human CYP51A1, the highly conserved lanosterol 14α-demethylase. Biochem J 474:3241–3252. [DOI] [PMC free article] [PubMed] [Google Scholar]
- Park JW, Lee CM, Cheng JS, Morgan ET. (2018) Posttranslational regulation of CYP2J2 by nitric oxide. Free Radic Biol Med 121:149–156. [DOI] [PMC free article] [PubMed] [Google Scholar]
- Quaroni LG, Seward HE, McLean KJ, Girvan HM, Ost TW, Noble MA, Kelly SM, Price NC, Cheesman MR, Smith WE, et al. (2004) Interaction of nitric oxide with cytochrome P450 BM3. Biochemistry 43:16416–16431. [DOI] [PubMed] [Google Scholar]
- Roberts ES, Lin Hl, Crowley JR, Vuletich JL, Osawa Y, Hollenberg PF. (1998) Peroxynitrite-mediated nitration of tyrosine and inactivation of the catalytic activity of cytochrome P450 2B1. Chem Res Toxicol 11:1067–1074. [DOI] [PubMed] [Google Scholar]
- Schmid N, Eichenberger AP, Choutko A, Riniker S, Winger M, Mark AE, van Gunsteren WF. (2011) Definition and testing of the GROMOS force-field versions 54A7 and 54B7. Eur Biophys J 40:843–856. [DOI] [PubMed] [Google Scholar]
- Scott EE, White MA, He YA, Johnson EF, Stout CD, Halpert JR. (2004) Structure of mammalian cytochrome P450 2B4 complexed with 4-(4-chlorophenyl)imidazole at 1.9-A resolution: insight into the range of P450 conformations and the coordination of redox partner binding. J Biol Chem 279:27294–27301. [DOI] [PubMed] [Google Scholar]
- Sewer MB, Morgan ET. (1997) Nitric oxide-independent suppression of P450 2C11 expression by interleukin-1beta and endotoxin in primary rat hepatocytes. Biochem Pharmacol 54:729–737. [DOI] [PubMed] [Google Scholar]
- Skjærven L, Yao XQ, Scarabelli G, Grant BJ. (2014) Integrating protein structural dynamics and evolutionary analysis with Bio3D. BMC Bioinformatics 15:399. [DOI] [PMC free article] [PubMed] [Google Scholar]
- Sugita H, Fujimoto M, Yasukawa T, Shimizu N, Sugita M, Yasuhara S, Martyn JA, Kaneki M. (2005) Inducible nitric-oxide synthase and NO donor induce insulin receptor substrate-1 degradation in skeletal muscle cells. J Biol Chem 280:14203–14211. [DOI] [PubMed] [Google Scholar]
- Tanioka T, Tamura Y, Fukaya M, Shinozaki S, Mao J, Kim M, Shimizu N, Kitamura T, Kaneki M. (2011) Inducible nitric-oxide synthase and nitric oxide donor decrease insulin receptor substrate-2 protein expression by promoting proteasome-dependent degradation in pancreatic beta-cells: involvement of glycogen synthase kinase-3beta. J Biol Chem 286:29388–29396. [DOI] [PMC free article] [PubMed] [Google Scholar]
- Touw WG, Baakman C, Black J, te Beek TA, Krieger E, Joosten RP, Vriend G. (2015) A series of PDB-related databanks for everyday needs. Nucleic Acids Res 43:D364–D368. [DOI] [PMC free article] [PubMed] [Google Scholar]
- Wang Y, Zhang P, Xu Z, Yue W, Zhuang Y, Chen Y, Lu Z. (2015) S-nitrosylation of PDE5 increases its ubiquitin-proteasomal degradation. Free Radic Biol Med 86:343–351. [DOI] [PubMed] [Google Scholar]
- Webb B, Sali A. (2016) Comparative protein structure modeling using MODELLER. Curr Protoc Protein Sci 86:2.9.1-2.9.37. [DOI] [PubMed] [Google Scholar]
- Wilderman PR, Gay SC, Jang HH, Zhang Q, Stout CD, Halpert JR. (2012) Investigation by site-directed mutagenesis of the role of cytochrome P450 2B4 non-active-site residues in protein-ligand interactions based on crystal structures of the ligand-bound enzyme. FEBS J 279:1607–1620. [DOI] [PMC free article] [PubMed] [Google Scholar]
- Wink DA, Osawa Y, Darbyshire JF, Jones CR, Eshenaur SC, Nims RW. (1993) Inhibition of cytochromes P450 by nitric oxide and a nitric oxide-releasing agent. Arch Biochem Biophys 300:115–123. [DOI] [PubMed] [Google Scholar]
- Zangar RC, Kimzey AL, Okita JR, Wunschel DS, Edwards RJ, Kim H, Okita RT. (2002) Cytochrome P450 3A conjugation to ubiquitin in a process distinct from classical ubiquitination pathway. Mol Pharmacol 61:892–904. [DOI] [PubMed] [Google Scholar]
- Zhan X, Wang X, Desiderio DM. (2015) Mass spectrometry analysis of nitrotyrosine-containing proteins. Mass Spectrom Rev 34:423–448. [DOI] [PubMed] [Google Scholar]
- Zoete V, Cuendet MA, Grosdidier A, Michielin O. (2011) SwissParam: a fast force field generation tool for small organic molecules. J Comput Chem 32:2359–2368. [DOI] [PubMed] [Google Scholar]
- Zou MH, Daiber A, Peterson JA, Shoun H, Ullrich V. (2000) Rapid reactions of peroxynitrite with heme-thiolate proteins as the basis for protection of prostacyclin synthase from inactivation by nitration. Arch Biochem Biophys 376:149–155. [DOI] [PubMed] [Google Scholar]