

ABSTRACT
Aberrant activation of estrogen signaling through three ESR (estrogen receptor) subtypes, termed ESR1/ERα, ESR2/ERβ, and GPER1 (G protein-coupled estrogen receptor 1), is implicated in breast cancer pathogenesis and progression. Antiestrogens tamoxifen (TAM) and fulvestrant (FUL) are effective for treatment of ESR1-positive breast tumors, but development of resistance represents a major clinical challenge. However, the molecular mechanisms behind these events remain largely unknown. Here, we report that 17β-estradiol (E2), TAM, and FUL stabilize MORC2 (MORC family CW-type zinc finger 2), an emerging oncoprotein in human cancer, in a GPER1-dependent manner. Mechanistically, GPER1 activates PRKACA (protein kinase cAMP-activated catalytic subunit alpha), which in turn phosphorylates MORC2 at threonine 582 (T582). Phosphorylated MORC2 decreases its interaction with HSPA8 (heat shock protein family A [Hsp70] member 8) and LAMP2A (lysosomal associated membrane protein 2A), two core components of the chaperone-mediated autophagy (CMA) machinery, thus protecting MORC2 from lysosomal degradation by CMA. Functionally, knockdown of MORC2 attenuates E2-induced cell proliferation and enhances cellular sensitivity to TAM and FUL. Moreover, introduction of wild-type MORC2, but not its phosphorylation-lacking mutant (T582A), in MORC2-depleted cells restores resistance to antiestrogens. Clinically, the phosphorylation levels of MORC2 at T582 are elevated in breast tumors from patients undergoing recurrence after TAM treatment. Together, these findings delineate a phosphorylation-dependent mechanism for MORC2 stabilization in response to estrogen and antiestrogens via blocking CMA-mediated lysosomal degradation and uncover a dual role for MORC2 in both estrogen-induced proliferation and resistance to antiestrogen therapies of breast cancer cells.
Abbreviations
4-OHT: 4-hydroxytamoxifen; Baf A1: bafilomycin A1; CMA: chaperone-mediated autophagy; E2: 17β-estradiol; ESR: estrogen receptor; FUL: fulvestrant; GPER1: G protein-coupled estrogen receptor 1; HSPA8: heat shock protein family A (Hsp70) member 8; LAMP2A: lysosomal associated membrane protein 2A; MORC2: MORC family CW-type zinc finger 2; PRKACA: protein kinase cAMP-activated catalytic subunit alpha; TAM: tamoxifen; VCL: vinculin
KEYWORDS: Breast cancer, chaperone-mediated autophagy, endocrine resistance, estrogen, estrogen receptor, lysosomal degradation, MORC2
Introduction
Breast cancer is the most commonly diagnosed malignancy and constitutes the leading cause of cancer-related mortality in women globally [1]. Accumulating evidence shows that aberrant activation of estrogen-dependent genomic and nongenomic events through its designated receptors is a key driving force for breast cancer development and progression [2]. To date, at least three nonredundant estrogen receptor (ESR) subtypes have been identified, termed ESR1/ERα, ESR2/ERβ, and GPER1 (G protein-coupled estrogen receptor 1) [3]. Of them, both ESR1 and ESR2 belong to the nuclear receptor superfamily of ligand-activated transcription factors, which transcriptionally regulate estrogen-responsive genes involved in cell proliferation, migration, invasion, and metastasis [4]. In the clinic, ESR1 is expressed in up to 70% of breast tumors and contributes to breast cancer development and progression in response to estrogen stimulation, whereas the precise role of ESR2 in breast cancer remains elusive [5]. Accordingly, ESR1-targeting drugs such as tamoxifen (TAM) [6] and fulvestrant (FUL) [7] have emerged as frontline therapies for estrogen-dependent breast cancer. Mechanistically, TAM competes with estrogen for ESR1 binding, thus blocking ESR1-mediated gene transcription activities and growth stimulatory effects [6]. FUL is a pure ESR1 antagonist, which promotes proteasomal degradation of ESR1 [7]. However, the development of endocrine resistance is a major clinical challenge.
GPER1 is a transmembrane ESR and mainly mediates estrogen-induced nongenomic signals in ESR1-negative breast cancer cells [8,9]. In this context, stimulation of cells expressing GPER1 but lacking ESR1 and ESR2 by estrogen rapidly activates multiple intracellular signaling pathways, such as EGFR (epidermal growth factor receptor) [10], PIK3CA (phosphatidylinositol-4,5-bisphosphate 3-kinase catalytic subunit alpha) [8], MAPK3 (mitogen-activated protein kinase 3)/MAPK1 [10], and PRKACA (protein kinase cAMP-activated catalytic subunit alpha) [11]. GPER1 is expressed in approximately 50% of ESR1-negative breast cancers and promote ESR1-negative breast cancer cell proliferation, migration, and invasion [12–14]. More importantly, ESR1 antagonists TAM and FUL can bind to and activate GPER1 [10,13,15–21], which in turn activates multiple pro-survival signaling pathways, thus establishing a mechanistic role for GPER1 in endocrine resistance of breast cancer [21–24]. Despite the clinical importance of the estrogen-ESR signaling in breast cancer pathogenesis and antiestrogen response, the underlying mechanisms behind these events remain incompletely understood.
MORC2 (MORC family CW-type zinc finger 2) belongs to the MORC nuclear protein superfamily, which is characterized by the presence of a conserved GHKL (Gyrase, Hsp90, Histidine kinase, and MutL)-type ATPase domain, a CW-type zinc finger domain, and several distinct coiled-coil domains [25–27]. Although MORC2 is ubiquitously expressed in mammalian cells [25], its biological functions remain largely unknown. Recently, we and others defined MORC2 as a chromatin remodeling protein with emerging roles in the maintenance of genome integrity in response to DNA damage [28] and in gene transcription [29]. In addition to its nuclear functions, cytosolic MORC2 is involved in lipogenesis and adipogenesis [30]. Emerging evidence shows that MORC2 is upregulated in breast cancer and its expression levels are associated with unfavorable pathological characteristics and poor prognosis [31,32]. In support of these results, our recent studies demonstrated that MORC2 promotes metastatic progression of triple-negative breast cancer, a distinct subtype of breast cancer with low or no expression of ESR1, PGR (progesterone receptor), and ERBB2 (erb-b2 receptor tyrosine kinase 2) [33,34]. Despite these advances, the functional and mechanistic roles for MORC2 in estrogen signaling and responsiveness to antiestrogen therapies of breast cancer cells remain unexplored.
The ubiquitin-proteasome system and the autophagy-lysosome system are two main pathways for protein degradation in eukaryotes [35,36]. Generally, the ubiquitin system targets short-lived regulatory proteins for proteasome-mediated destruction through polyubiquitination [36]. In contrast, autophagy mediates the degradation of long-lived proteins and organelles in lysosomes [35]. To date, three main types of autophagy have been described in mammalian cells, including macroautophagy, microautophagy, and chaperone-mediated autophagy (CMA) [35]. Macroautophagy delivers proteins and organelles to lysosomes for degradation upon sequestration within an autophagosome, whereas microautophagy is still very poorly understood in mammals [35]. In contrast, CMA is responsible for selective degradation of proteins bearing a Lys-Phe-Glu-Arg-Gln (KFERQ)-like motif [37,38]. This motif is selectively recognized by the chaperone protein HSPA8 (heat shock protein family A [Hsp70] member 8) [39], which transfers the substrates to lysosomes for degradation through interacting with LAMP2A (lysosomal associated membrane protein 2A) [40].
In this study, we discovered that 17β-estradiol (E2), the predominant and most potent endogenous estrogen, and ESR1 antagonists TAM and FUL stabilize MORC2 via the GPER1-PRKACA-CMA pathway. Functional assays further demonstrated that knockdown of endogenous MORC2 impairs E2-induced cell proliferation and enhances cellular sensitivity to antiestrogens. These findings uncover a previously unappreciated mechanism for MORC2 upregulation in breast tumors and highlight MORC2 as a potential therapeutic target for breast cancer.
Results
E2 and ESR1 antagonists stabilize MORC2 in breast cancer cells
To investigate the regulatory mechanism of MORC2 in breast cancer cells, we first analyzed the promoter sequence of MORC2 gene using the AliBaba2.1 program (http://gene-regulation.com) to predict potential transcription factor binding sites. Results showed that MORC2 gene promoter within one kilobase region upstream of the transcription start site contains two ESR1 binding sites (Figure S1), indicating that MORC2 might be a downstream target of the E2-ESR1 pathway. To test this notion, three well-characterized breast cancer cell lines with different ESR expression profiles, including MCF-7 (ESR1-positive, ESR2-positive, and GPER1-positive) [10], SK-BR-3 (ESR1-negative, ESR2-negative, and GPER1-positive) [10], and MDA-MB-468 (ESR1-negative, ESR2-positive, and GPER1-positive) [41] (Figure 1A), were grown in estrogen-depleted medium for 48 h, and then treated with or without 10 nM E2 for the indicated times. Unexpectedly, we found that administration of E2 induced MORC2 protein expression in three tested cell lines in a time-dependent manner irrespective of ESR1 status (Figure 1B). As a control, ESR1 was downregulated, whereas estrogen downstream target CCND1 (cyclin D1) was upregulated, in E2-responsive, ESR1-positive MCF-7 cells following E2 treatment (Figure 1B, left panel). To consolidate these findings, we next examined whether ESR1 antagonists TAM and FUL could modulate MORC2 protein expression in these cell lines. Interestingly, we found that treatment with either 10 nM 4-hydroxytamoxifen (4-OHT), the active metabolite of TAM (Figure 1C), or 10 nM FUL (Figure 1D) resulted in an increase in MORC2 protein levels in both ESR1-positive (MCF-7) and ESR1-negative (SK-BR-3 and MDA-MB-468) cells. As reported previously [42], ESR1 expression levels in MCF-7 cells were increased following 4-OHT treatment (Figure 1C), but decreased in the presence of FUL (Figure 1D). These results suggest that E2 as well as ESR1 antagonists TAM and FUL enhance MORC2 expression levels.
Figure 1.
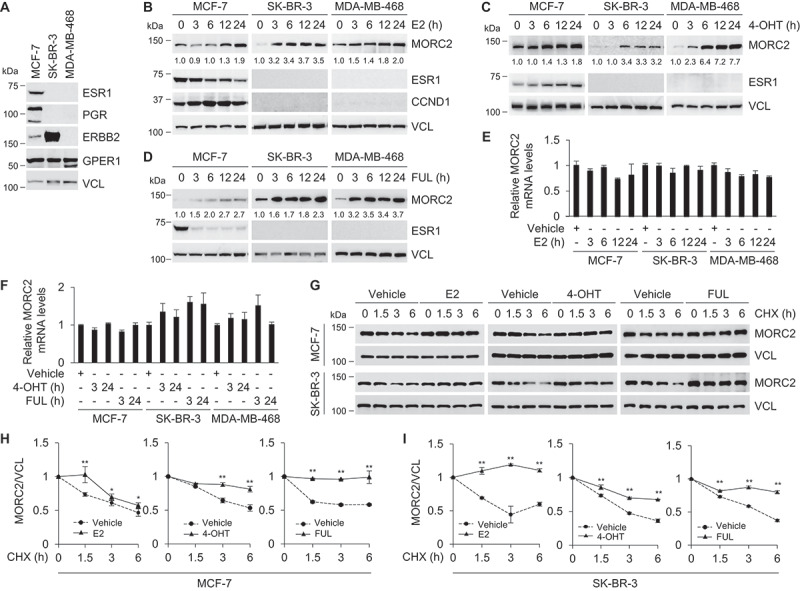
E2 and ESR1 antagonists stabilize MORC2.
To determine whether E2, 4-OHT, and FUL regulate MORC2 at the mRNA level, MCF-7, SK-BR-3, and MDA-MB-468 cells were treated with E2, 4-OHT, and FUL for the indicated times and then subjected to real-time quantitative PCR (qPCR) analysis of MORC2 mRNA levels. Results showed that incubation of cells with E2 (Figure 1E), 4-OHT, and FUL treatment (Figure 1F) did not significantly alter MORC2 mRNA levels, suggesting the effects of E2, 4-OHT, and FUL on MORC2 upregulation to be post-transcriptional. To examine whether E2, 4-OHT, and FUL could affect MORC2 protein stability, MCF-7 and SK-BR-3 cells were pretreated with or without E2, 4-OHT, and FUL for 1 h, and then incubated with 100 μg/ml cycloheximide (CHX), a putative protein synthesis inhibitor, for the indicated times. Immunoblotting analysis showed that the half-life of MORC2 prolonged in the presence of E2, 4-OHT, and FUL in MCF-7 (Figure 1G, upper panel, and Figure 1H) and SK-BR-3 (Figure 1G, lower panel, and Figure 1I) cells. Together, these results suggest that E2 and ESR1 antagonists stabilize MORC2 in breast cancer cells independently of the ESR1 status.
GPER1 is required for MORC2 stabilization induced by E2 and ESR1 antagonists
As E2, TAM, and FUL have been shown to bind to and activate GPER1 [8,10,13,15–21], we next tested the possibility that E2 and ESR1 antagonists stabilize MORC2 via a GPER1 dependent mechanism. For this purpose, we chose SK-BR-3 cell line as the major model system, as this cell line lacks ESR1 and ESR2 but expresses high levels of GPER1 and has been widely used to investigate GPER1 signaling in breast cancer cells [10,13,43]. First, we performed dose-response and time-course studies to examine whether the selective GPER1 agonist G1 [43] and GPER1 antagonist G36 [44] could modulate MORC2 expression. Immunoblotting and qPCR analyses showed that incubation of cells with G1 resulted in a significant increase in MORC2 protein (Figure 2A) but not mRNA (Figure 2B) levels. In contrast, MORC2 protein (Figure 2C) but not mRNA (Figure 2D) levels were downregulated following G36 treatment. Moreover, co-administration of G36 compromised E2-, 4-OHT-, and FUL-induced MORC2 protein expression (Figure 2E–G, respectively). Second, we determined whether knockdown of endogenous GPER1 gene in SK-BR-3 cells using specific short hairpin RNAs (shRNAs) targeting GPER1 (shGPER1) (OriGene) could compromise MORC2 expression induction by E2 and ESR1 antagonists. As shown in Figure 2H, immunoblotting analysis demonstrated that shGPER1 #4 effectively knocked down endogenous GPER1 as compared with negative-control shRNAs (shNC). Moreover, knockdown of endogenous GPER1 by shGPER1 #4 attenuated MORC2 expression induced by E2 (Figure 2I), 4-OHT, and FUL (Figure 2J). To further validate these results, the second shGPER1 targeting different GPER1 sequence (GenePharma) was employed. Immunoblotting analysis demonstrated that protein levels of GPER1 were significantly downregulated in shGPER1 #C infected cells as compared with shNC-treated control cells (Figure 2K). In agreement with the above results, knockdown of endogenous GPER1 by shGPER1 #C compromised MORC2 protein expression induced by E2 (Figure 2L), 4-OHT, and FUL (Figure 2M). Collectively, evidence from pharmacological and genetic modulation of GPER1 demonstrated that stabilization of MORC2 by E2 and ESR1 antagonists depends on GPER1.
Figure 2.
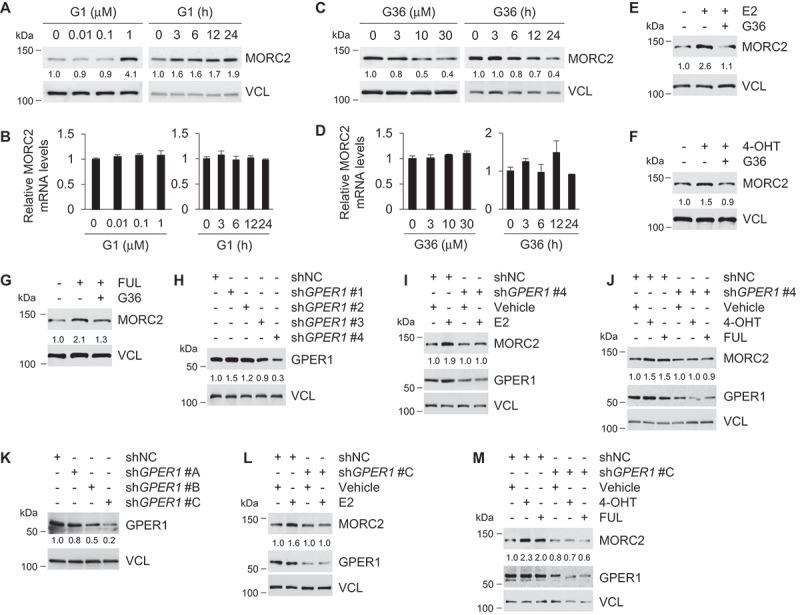
Stabilization of MORC2 by E2 and ESR1 antagonists depends on GPER1.
Activation of PRKACA by GPER1 enhances MORC2 stability
Activation of GPER1 leads to rapid activation of multiple downstream pathways, including EGFR [10], PIK3CA [8], MAPK3/MAPK1 [10], and PRKACA [11]. To determine which pathway is responsible for the noted MORC2 stabilization following E2, 4-OHT, and FUL treatment, EGFR inhibitor AG1478, PIK3CA inhibitor LY294002, MAPK3/MAPK1 inhibitor U0126, and PRKACA inhibitor H89 were used. As a positive control, pretreatment of SK-BR-3 cells with AG1478 blocked EGF (epidermal growth factor)-induced phospho (p)-p44/42 MAPK (Erk1/2)(T202/Y204) and p-AKT (S473) activation (Figure 3A). In contrast, administration of U0126, LY294002, and H89 suppressed EGF-induced p-p44/42 MAPK (Erk1/2) (T202/Y204), p-AKT (S473), and p-CREB1 (S133) activation, respectively (Figure 3A). These results suggest that these inhibitors are specific and functional. Moreover, immunoblotting analysis demonstrated that pretreatment of SK-BR-3 cells with H89, but not AG1478, LY294002, or U0126, suppressed MORC2 protein expression induced by E2 (Figure 3B), 4-OHT (Figure 3C), and FUL (Figure 3D). These results indicate that GPER1-mediated MORC2 stabilization depends on PRKACA.
Figure 3.
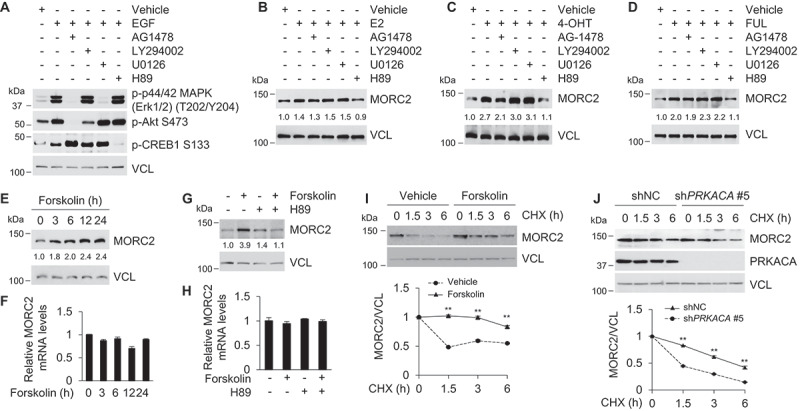
Activation of PRKACA by GPER1 enhances MORC2 protein stability.
The activation of the GPER1-PRKACA pathway by E2, 4-OH, and FUL has been documented previously [9,15,45,46]. Mechanistically, binding of E2, 4-OH, FUL to GPER1 results in a disassociation of the Gα subunit of GPER1 from the heterotrimeric G-protein complex and then activates adenylyl cyclase (AC) to produce cyclic adenosine monophosphate (cAMP), which in turn activates PRKACA and its downstream phosphorylation events [15,46,47]. One of the best characterized substrates of PRKACA is the cAMP responsive element binding protein 1 (CREB1), which is phosphorylated by PRKACA at serine 133 (p-CREB1 S133) [48]. To verify these results, SK-BR-3 cells were pretreated with or without GPER1 antagonist G36 for 1 h, and then incubated with or without E2, TAM, FUL, and GPER1 agonist G1 for another 1 h. The intracellular cAMP levels were determined using a cAMP enzyme-linked immunosorbent assay (ELISA) kit. In agreement with previously reported results [15,21,49], we found that treatment with E2, TAM, FUL, and G1 enhanced the cAMP levels, and the noted effects were compromised in the presence of G36 (Figure S2). These results suggest that stimulation of AC activity and induction of cAMP production by E2, TAM, FUL, and G1 are GPER1 dependent. To verify whether E2, 4-OHT, and FUL enable to activate PRKACA, SK-BR-3 cells stably expressing shNC and shGPER1 were treated with or without E2, TAM, and FUL for the indicated times. The expression levels of p-CREB1 S133 were determined by immunoblotting to monitor PRKACA activation. Results showed that treatment of shNC expressing cells with E2, TAM, and FUL increased the levels of p-CREB1 S133 and the noted effects were attenuated in shGPER1-expressing cells (Figure S3A-S3C,respectively). Moreover, G1 treatment resulted in an increase in p-CREB1 S133 levels in shNC-expressing but not in shGPER1-expressing cells, and enhanced p-CREB1 S133 levels in shNC-expressing cells following G1 treatment were compromised in the presence of G36 (Figure S3D). These results support the notion that E2, TAM, and FUL enable to activate the GPER1-PRKACA pathway.
In support of these results, activation of PRKACA by its putative activator forskolin, which activates AC and increases intracellular cAMP levels [50], resulted in an increase in MORC2 protein but not mRNA levels in a time-dependent manner (Figure 3E and F, respectively). Moreover, PRKACA inhibitor H89 blocked forskolin-induced upregulation of MORC2 protein but not mRNA levels (Figure 3G and H, respectively). Consistently, forskolin treatment enhanced the half-life of MORC2 protein by measuring MORC2 protein levels at different time points after CHX treatment (Figure 3I). In contrast, knockdown of endogenous PRKACA (shPRKACA #5) decreased the half-life of MORC2 protein (Figure 3J). Together, these results demonstrated that activation of PRKACA by GPER1 enhances the stability of MORC2.
PRKACA phosphorylates MORC2 at threonine 582
As PRKACA regulates a plethora of biological events through phosphorylating its substrates both in the cytoplasm and in the nucleus [51,52], we next examined whether PRKACA could phosphorylate MORC2, thus enhancing its protein stability. To do this, SK-BR-3 cells were treated with or without forskolin to activate endogenous PRKACA. Immunoprecipitation (IP) using an anti-MORC2 antibody followed by immunoblotting with a p-(Ser/Thr) PRKACA substrate antibody revealed an increase in the phosphorylation levels of endogenous MORC2 following forskolin treatment (Figure 4A). Moreover, expression of wild-type PRKACA, but not its catalytically inactive mutant (K73H) [53], enhanced MORC2 phosphorylation levels (Figure 4B). These results indicate that MORC2 is a potential substrate of PRKACA.
Figure 4.
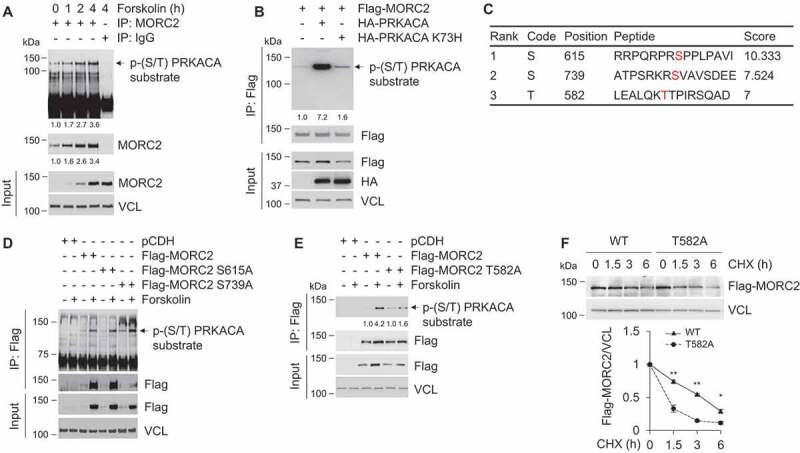
PRKACA phosphorylates MORC2 at T582.
To identify the potential phosphorylation sites of MORC2 by PRKACA, we first predicted PRKACA-specific phosphorylation sites in MORC2 using the group-based prediction system, version 3.0 (GPS3.0) software (http://gps.biocuckoo.org), and identified three sites with high score, including serine 615 (S615), S739, and threonine 582 (T582) (Figure 4C). To verify these results, we individually mutated these potential phosphorylation residues to alanine (termed S615A, S739A, and T582A, respectively), and then transfected Flag-MORC2 or Flag-MORC2 mutants (S615A, S739A, and T582A) into HEK293T cells. Following IP assays using an anti-Flag antibody, we examined the phosphorylation status of MORC2 with a p-(Ser/Thr) PKA substrate antibody. As shown in Figure 4D, expression of S615A and S739A mutations did not significantly affect MORC2 phosphorylation levels upon activation of endogenous PRKACA by forskolin. In contrast, T582A mutation attenuated PRKACA-mediated MORC2 phosphorylation (Figure 4E). Moreover, CHX chase assay showed that exogenously expressed Flag-MORC2 T582A displayed a lower stability than wild-type MORC2 in HEK293T cells (Figure 4F). These data indicates that T582 is one of major phosphorylation sites of MORC2 by PRKACA and phosphorylation of MORC2 at T582 enhances its protein stability.
To further demonstrate that MORC2 is phosphorylated at T582 by PRKACA, we generated a specific antibody against phosphorylated MORC2 at T582 (termed p-MORC2 T582). To verify the antibody specificity, HEK293T cells were transfected with empty vector pCDH, Flag-MORC2, and Flag-MORC2 T582A. After 48 h of transfection, cells were treated with or without forskolin for 1 h, and then were subjected to IP analysis with an anti-Flag antibody. Immunoblotting analyses with an anti-p-MORC2 T582 antibody revealed a specific signal of T582 phosphorylation in cells expressing wild-type MORC2, but not T582A mutant, following forskolin treatment (Figure S4A). Moreover, the levels of p-MORC2 T582 were enhanced in MCF-7 cells upon forskolin treatment in a time-dependent manner (Figure S4B). Together, these results suggest that PRKACA phosphorylates MORC2 at T582.
E2 and ESR1 antagonists enhance MORC2 phosphorylation at T582 via PRKACA
To determine whether PRKACA phosphorylates MORC2 at T582 in response to E2 and ESR1 antagonists, we first examined the possibility that PRKACA interacts with MORC2 in vivo. To do this, MCF-7 cells were treated with or without E2, OHT and FUL and total cellular lysates were subjected to IP assays with an anti-MORC2 antibody. Immunoblotting analyses showed that MORC2 indeed interacted with PRKACA and the noted interaction between MORC2 and PRKACA was enhanced in the presence of E2, 4-OHT, and FUL (Figure 5A–C, respectively). Given that treatment with E2, 4-OHT or FUL also enhanced the basal levels of MORC2, the increased interaction between MORC2 and PRKACA may be due to MORC2 upregulation by E2 and antiestrogens.
Figure 5.
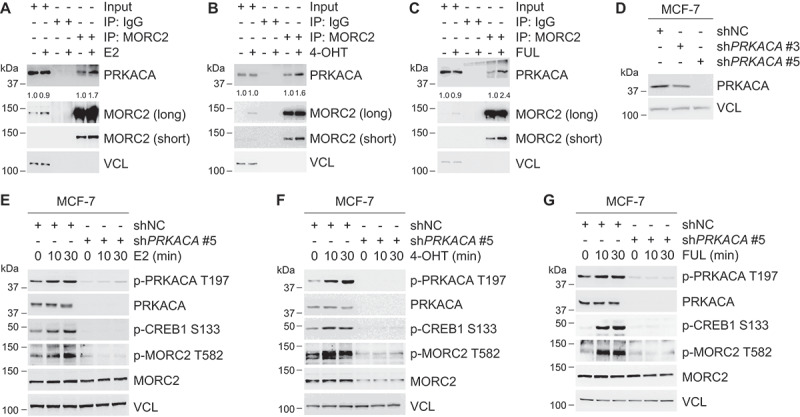
E2 and antiestrogens promote MORC2 phosphorylation at T582 via PRKACA.
Structural and biochemical evidence has shown that autophosphorylation of PRKACA at T197, located in the activation loop, is required for its full enzymatic activation [54,55]. Activated PRKACA in turn phosphorylates a variety of substrates such as CREB1, which is phosphorylated at S133 by PRKACA [48]. To examine whether E2, 4-OHT, and FUL can activate PRKACA, we established stable MCF-7 cell lines expressing shNC or shPRKACAs (shPRKACA #3 and shPRKACA #5). Immunoblotting analysis demonstrated that shPRKACA #5 effectively knocked down endogenous PRKACA as compared with shNC and shPRKACA #3 (Figure 5D). Then, the effects of E2, 4-OHT, FUL treatment on the levels of PRKACA phosphorylation at T197 (p-PRKACA T197), an indicator for PRKACA activation, and of p-CREB1 S133, a functional readout for PRKACA activation, were examined by immunoblotting analysis. Results showed that treatment of shNC expressing cells with E2 (Figure 5E), 4-OHT (Figure 5F), and FUL (Figure 5G) enhanced the levels of p-PRKACA T197 and p-CREB1 S133 in a time dependent manner. In contrast, shPRKACA-expressing cells had decreased p-PRKACA T197 and p-CREB1 S133 levels in response to E2, 4-OHT, and FUL treatment (Figure 5E–G, respectively). These data suggests that treatment with E2, 4-OHT and FUL can activate PRKACA. More importantly, treatment of MCF-7 cells with E2, 4-OHT, and FUL led to a significant increase in the phosphorylation levels of MORC2 at T582, whereas knockdown of endogenous PRKACA attenuated these effects (Figure 5E–G, respectively). Together, these results demonstrated that PRKACA phosphorylates MORC2 at T582 in response to estrogen and antiestrogen treatment.
MORC2 undergoes lysosomal degradation by CMA
The ubiquitin-proteasome system and the autophagy-lysosome system are two main pathways for protein degradation in eukaryotes [35,36]. To determine whether MORC2 stability is regulated by the ubiquitin-proteasome pathway, MCF-7 and SK-BR-3 cells were treated with 20 μM of proteasome inhibitor MG-132 for the indicated times and then subjected to immunoblotting analysis with the indicated antibodies. Interestingly, we found that MG-132 treatment did not significantly alter the protein levels of MORC2 (Figure S5A). In contrast, MG-132 treatment resulted in a significant increase in the protein levels of p53, a known substrate of the ubiquitin-proteasome system [56]. To investigate whether the autophagy-lysosome system is involved in the degradation of MORC2, MCF-7 and SK-BR-3 cells were treated with or without lysosomal inhibitors bafilomycin A1 (Baf A1) and ammonium chloride (NH4Cl). Results showed that treatment of MCF-7 and SK-BR-3 cells with 50 ng/ml of Baf A1 (Figure 6A) and 50 mM NH4Cl (Figure 6B) resulted in an accumulation of MORC2 in a time-dependent manner. These results suggest that MORC2 is degraded mainly in the lysosome, but not the proteasome.
Figure 6.
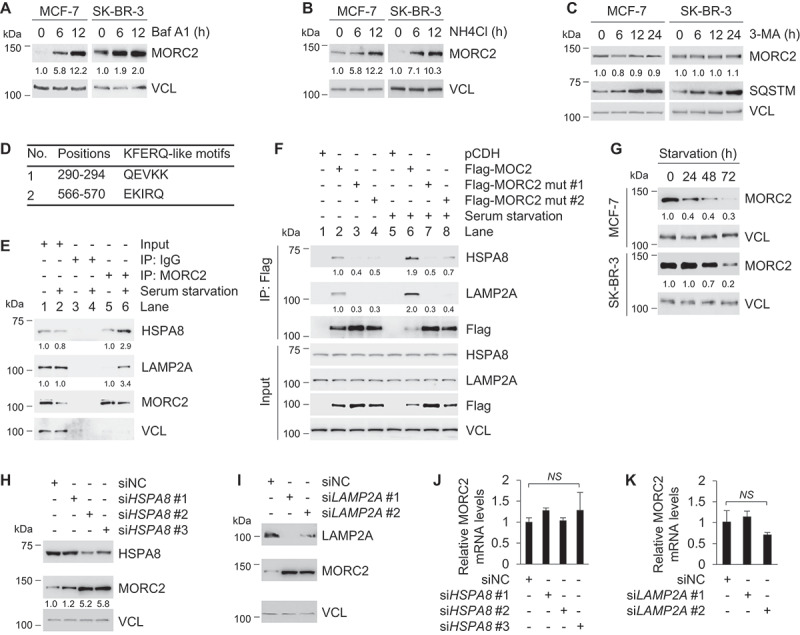
MORC2 undergoes lysosomal degradation via CMA.
There are three types of autophagy that are involved in lysosomal degradation of distinct substrates [35]. To determine whether macroautophagy contributes to MORC2 regulation, MCF-7 and SK-BR-3 cells were treated with 10 mM 3-methyladenine (3-MA), a selective inhibitor of macroautophagy through blocking autophagosome formation [57]. Immunoblotting analysis showed that that 3-MA had no significant effects on the steady-state levels of MORC2 (Figure 6C). As a positive control, 3-MA treatment led to an evident increase in the protein levels of SQSTM, a well-recognized substrate of macroautophagy [58], in a time-dependent manner. These results indicate that macroautophagy is not responsible for the lysosome- dependent degradation of MORC2.
CMA is another subtype of autophagy responsible for selective degradation of protein bearing a KFERQ-like motif that is selectively recognized by HSPA8 [37,38]. The KFERQ motif generally contains five residues, including a critical glutamine residue (Q) flanked on either side by four amino acid residues consisting of only one acidic residue (D, E), and one or two basic (K, R) or bulky hydrophobic residues (K, R, F, I, L, V) [37,38]. Interestingly, analysis of MORC2 amino acid sequence revealed the presence of two putative KFERQ-like motifs at its N terminus, 290QEVKK294 and 566EKIRQ570, respectively (Figure 6D), indicating that MORC2 may be a bona fide CMA substrate. The first step in CMA is the substrate interaction with HSPA8, which recruits target proteins to the lysosome [39]. At the lysosome, the substrate proteins bind to the CMA receptor LAMP2A [40], which mediates the translocation of these CMA substrates into the lysosomal lumen for degradation [38]. To address whether MORC2 interacts with HSPA8 and LAMP2A, MCF-7 cells were cultured in complete or serum-free medium (serum starvation) for 24 h, and then subjected to IP assays with an anti-MORC2 antibody. Results showed that serum starvation, a well-established inducer of CMA in cultured cells [59], enhanced the interaction between MORC2 and HSPA8 (and LAMP2A) compared to normal growth condition (Figure 6E). Immunofluorescent staining showed that MORC2 was mainly localized in the nuclear under normal culture conditions, which is consistent with our previous reports [28,33,34]. In contrast, serum starvation promoted the translocation of MORC2 from the nuclear to the cytoplasm and enhanced the co-localization between MORC2 and HSPA8 and LAMP2A (yellow signal) (Figure S5B).
Previous studies have shown that mutation of Q and the adjacent amino acid within the KFERQ-like motif is usually sufficient to disrupt HSPA8-substrate interaction [60,61]. To examine whether the KFERQ-like motifs in MORC2 are required for its interaction with HSPA8 and LAMP2A, we generated two KFERQ-like motif mutant expression vectors by mutating 290QEVKK294 to 290AAVKK294 (termed Flag-MORC2 mut #1) and 566EKIRQ570 to 566EKIAA570 (Flag-MORC2 mut #2), respectively, and then transfected them into MCF-7 cells. After 48 h of transfection, cells were cultured in complete or serum-free medium for 24 h, and then subjected to IP assays with an anti-Flag antibody. Results showed that mutation of the KFERQ-like motifs in MORC2 attenuated its interaction with HSPA8 and LAMP2A as compared with its wild-type counterpart under either normal or serum starvation condition (Figure 6F). To demonstrate the role of CMA in MORC2 degradation, we assessed the effect of serum deprivation on the steady-state levels of MORC2. Immunoblotting analysis showed that MORC2 protein levels were decreased in MCF-7 and SK-BR-3 cells following serum starvation in a time-dependent manner (Figure 6G). To validate these results, we next knocked down endogenous HSPA8 or LAMP2A using specific small interfering RNAs (siRNAs) and measured MORC2 protein and mRNA levels. Results showed that knockdown of HSPA8 or LAMP2A led to an increase in MORC2 protein (Figure 6H and I, respectively) but not mRNA levels (Figure 6J and K, respectively). These results collectively suggest that CMA targets MORC2 for lysosomal degradation.
PRKACA-mediated phosphorylation blocks lysosomal degradation of MORC2 by CMA
To examine whether E2, 4-OHT and FUL could affect the interaction between MORC2 with HSPA8 or LAMP2A, SK-BR-3 cells were treated with or without E2, OHT and FUL and were then subjected to IP assays with an anti-MORC2 antibody. Results showed that treatment of SK-BR-3 cells with E2, 4-OHT and FUL compromised the interaction between MORC2 and HSPA8 (and LAMP2A) as compared with vehicle control (Figure 7A–C, respectively). To examine whether PRKACA-mediated MORC2 phosphorylation at T582 may affect its interaction with HSPA8 and LAMP2A and thus its degradation by CMA, HEK293T cells were transfected with Flag-MORC2, Flag-MORC2 T582A, HA-HSPA8 alone or in combination. After 48 h of transfection, total cellular lysates were subjected to IP analysis with an anti-Flag or an anti-HA antibody, followed by immunoblotting with the indicated antibodies. Results showed that T582A displayed a much stronger interaction with HSPA8 than wild-type MORC2 did (Figure 7D). Consistently, Flag-MORC2 showed enhanced stability compared to Flag-MORC2 T582A mutant when cells were cultured in serum-free medium (Figure 7E). Moreover, blockage of lysosomal degradation by treatment with Baf A1 resulted in a significant accumulation of Flag-MORC2 T582A as compared with its wild-type counterparts (Figure 7F). These data indicates that T582 phosphorylation abrogates MORC2 recognition by chaperone protein HSPA8, thereby preventing its subsequent lysosomal degradation by CMA.
Figure 7.
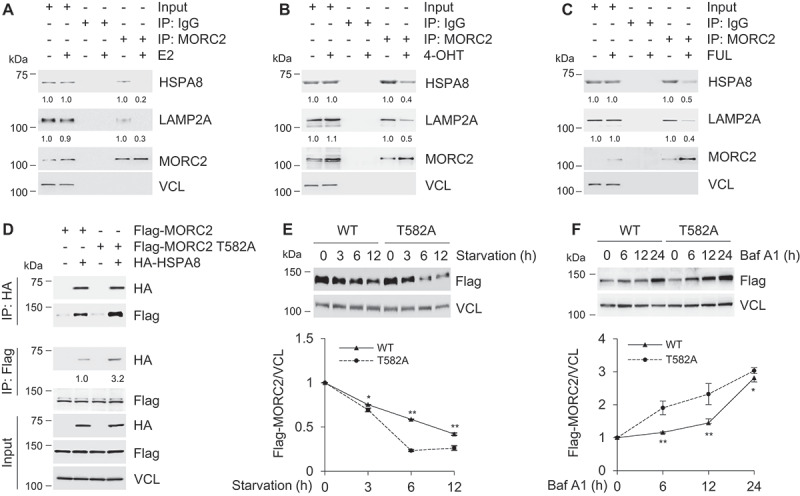
Phosphorylation of MORC2 at T582 blocks lysosomal degradation of MORC2 by CMA.
T582 phosphorylation is required for optimal oncogenic functions of MORC2
Emerging evidence shows that MORC2 is upregulated and exerts oncogenic activities in several types of human cancers including breast cancer [31–33]. We next determined whether knockdown of MORC2 by specific shRNAs affects the biological effects of E2 and antiestrogen agents in breast cancer cells. Given that E2 is a well-established mitogenic factor essential for cellular proliferation of breast cancer cells, we first examined whether knockdown of endogenous MORC2 (Figure 8A) could modulate cell proliferation in response to E2 in MCF-7 cells. As expected, E2 exerted a growth stimulatory activity as compared with vehicle treatment (Figure 8B). Furthermore, the growth-stimulating effects of E2 were compromised in shMORC2 infected cells as compared with shNC expressing controls (Figure 8B). We next examined whether knockdown of MORC2 affects cellular sensitivity to 4-OHT and FUL. As shown in Figure 8C, knockdown of endogenous MORC2 enhanced cellular sensitivity to 4-OHT and FUL. These results suggest that MORC2 may play a dual role in both E2-mediated cell proliferation and cellular sensitivity to antiestrogens. To investigate whether T582 phosphorylation affects the function of MORC2, we stably expressed either wild-type MORC2 or phosphorylation-deficient mutant (T582A) in MORC2-depleted MCF-7 cells (Figure 8D), and found that introduction of wild-type MORC2, but not T582A mutant, reversed the effects of MORC2 knockdown on cellular sensitivity to 4-OHT and FUL (Figure 8E and F). These results suggest that T582 phosphorylation is required for optimal biological functions of MORC2.
Figure 8.
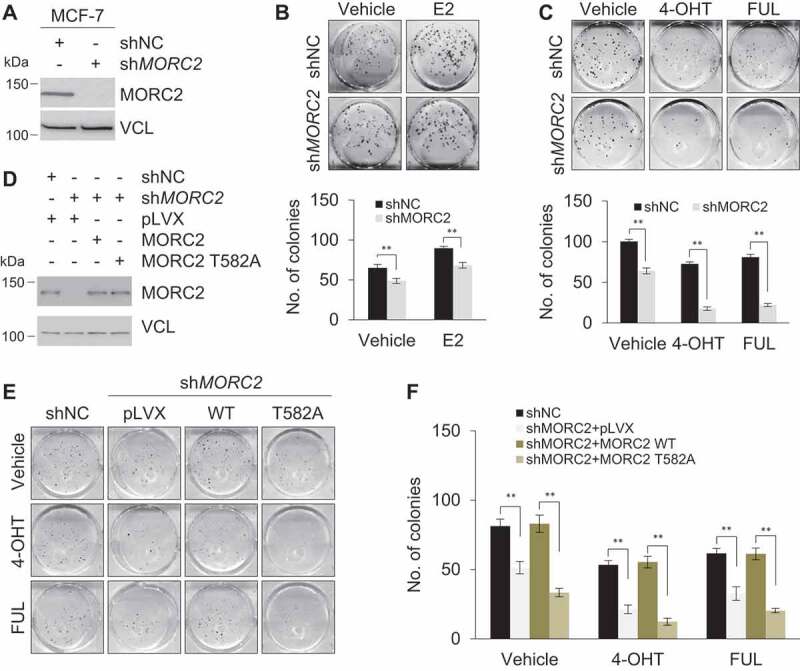
MORC2 regulates E2-mediated cell proliferation and cellular sensitivity to 4-OHT and FUL.
To evaluate the clinical relevance of our findings, we next examined the expression levels of p-MORC2 T582 in breast tumors from patients who underwent recurrence during TAM therapy. Of 21,964 breast cancer patients who underwent surgery followed by TAM treatment at Fudan University Shanghai Cancer Center, 589 patients underwent recurrence during TAM treatment. Among them, we found 5 pairs of matched primary-recurrent tumor samples from patients who had re-operation or biopsy after recurrence during TAM treatment (Figure S6A). Immunohistochemical staining showed that increased p-MORC2 T582 levels were observed in 4/5 recurrent tumor samples (Figure S6B), thus highlighting clinical relevance of our findings. In summary, these results establish a previously unrecognized role for the GPER1-PRKACA-MORC2 pathway in E2-induced breast cancer cellular proliferation and in endocrine resistance (Figure 9).
Figure 9.
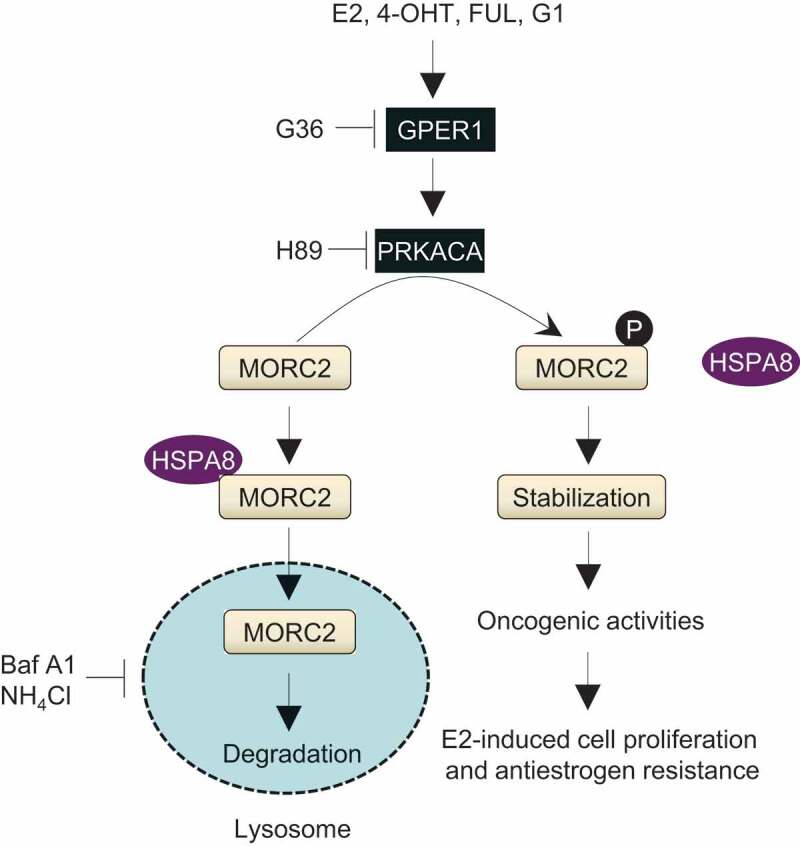
The proposed working model.
Discussion
In this study, we present several interesting findings concerning the biological function and the regulatory mechanism for MORC2 in breast cancer. First, E2 as well as antiestrogens stabilize MORC2 through a GPER1-dependent mechanism. Although the precise causes of breast cancer are unclear, estrogen is one key player in breast cancer development and progression primarily through ESR1-mediated transcriptional program [62]. Despite the presence of two ESR1 binding sites in the MORC2 promoter within 1-kb region (Figure S1), we found, surprisingly, that treatment of E2 did not affect MORC2 transcription levels but enhanced its protein stability in breast cancer cells irrespective of ESR1 status (Figure 1). More interestingly, we found that ESR1 antagonists TAM and FUL enhanced MORC2 stability in both ESR1-positive and ESR1-negative breast cancer cells (Figure 1). Previous studies have shown that E2, TAM, and FUL enable to activate GPER1 [11,14,16–22], which is upregulated in primary breast tumors and metastatic specimens and is significantly associated with tumor size and the presence of distant metastases [22]. Consistently, knockout of GPER1 in a mouse model suppresses mammary tumor growth and lung metastasis [63]. Moreover, increased GPER1 expression is implicated in endocrine resistance of breast cancer patients [21,23], and GPER1 inhibitor G15 enhances the responsiveness of TAM-resistant xenografts to endocrine treatment [21]. These results collectively suggest that pharmacological inhibition of GPER1 may represent a novel approach to reduce morbidity and mortality from breast cancer. Using GPER1 agonist G1 [43], GPER1 antagonist G36 [44], and genetic depletion of GPER1 using two different shGPER1s, we demonstrated that GPER1 is required for MORC2 stabilization induced by E2 and ESR1 antagonists (Figure 2).
TAM and FUL have been the principal front-line therapy for hormone-dependent breast tumors [6,7], but their efficacy is limited by intrinsic and acquired resistance [64]. Although the molecular events leading to endocrine resistance remain unclear, it is becoming evident that ESR1-independent mechanisms play a role in this process. Indeed, the Adjuvant Tamoxifen Longer Against Shorter (ATLAS) trial results showed that the benefit of TAM treatment for 10 years is questionable as compared with that for 5 years when ESR1 is unknown or negative [65]. Similarly, results from the International Breast Cancer Study Group (IBCSG) Trial 13–93 demonstrated that extended TAM therapy even leads to a worse survival in ESR1-negative breast cancer patients [66]. In fact, clinical classification of a tumor as ESR1 positive requires only 1% of the cells expresses ESR1 [67]. Especially, those ESR1 “poorly” positive tumors (such as less than 10% of tumor cells with ESR1 staining positive by immunohistochemistry) contain a large number of ESR1-negative tumor cells, which may mediate estrogen responsiveness and endocrine resistance through GPER1. Emerging evidence has shown that MORC2 is upregulated in human breast cancer and its elevated expression is associated with unfavorable pathological characteristics and poor prognosis [31,32]. Our recent studies also demonstrated that MORC2 promotes ESR1-negative breast cancer progression [33,34]. Thus, we propose a novel mechanism for endocrine resistance through stabilization of oncoprotein MORC2 by TAM and FUL in a GPER1 dependent manner.
Second, we provide evidence for the first time that MORC2 undergoes lysosomal degradation by the CMA pathway. Although MORC2 has been shown to be upregulated in human cancers including breast cancer [32], how this happens remains unexplored. In this study, we demonstrated that MORC2 is primarily degraded in the lysosome by the CMA pathway according to the criteria settled by the field to establish the function of CMA [68]. MORC2 contains two putative KFERQ-like motifs, QEVKK and EKIRQ (Figure 6D), and mutation of those two KFERQ-like motifs in MORC2 compromised its interaction with HSPA8 and LAMP2A (Figure 6F). In addition, immunofluorescent staining showed that MORC2 was mainly localized in the nuclear under physiological condition [28,33,34]. However, following activation of CMA pathway by serum deprivation, MORC2 translocated to cytosol and co-localized with HSPA8 and LAMP2A (Figure S5B). Moreover, treatment of cells with lysosomal inhibitors Baf A1 (Figure 6A) and NH4Cl (Figure 6B) increased MORC2 protein levels. In contrast, activation of CMA by serum starvation decreased MORC2 protein levels (Figure 6G). IP assays demonstrated that the interaction and co-localization between MORC2 and HSPA8 and LAMP2A were increased in response to serum starvation (Figure 6E and F). Finally, knockdown of endogenous HSPA8 or LAMP2A by siRNA upregulated MORC2 protein levels but did not significantly affect MORC2 mRNA levels (Figure 6H–K). Together, these results demonstrated that MORC2 protein levels are regulated by CMA-mediated lysosomal degradation. In support of our findings, nuclear protein checkpoint kinase 1 (CHK1) has been described to undergo degradation by CMA [61].
Third, activated PRKACA kinase by GPER1 phosphorylates MORC2 at T582, which protects MORC2 from lysosomal degradation via CMA. It has been documented that activation of GPER1 leads to rapid activation of multiple intracellular signaling pathways [8,10,11]. Using a combination of pharmacological and genetic approaches, we further demonstrated that GPER1-mediated MORC2 stabilization depends on PRKACA (Figures 3 and 4). PRKACA is frequently overexpressed in clinical breast tumors and regulates a variety of cellular activities through phosphorylating its downstream substrates. For instance, PRKACA-induced ESR1 phosphorylation at serine residue 305 can induce TAM resistance in breast cancer [51]. Moreover, activation of PRKACA leads to conversion of TAM into a growth stimulator in TAM-resistant breast cancer cells [69]. In addition, PRKACA drives mammary tumorigenesis through phosphorylating proto-oncogene tyrosine-protein kinase Src [52]. In this study, we identified T582 as one of phosphorylation sites of MORC2 by PRKACA based on the following evidence (Figures 4 and 5). Phosphorylation of MORC2 at T582 has been demonstrated by a mass spectrometry-based phosphoproteomics [70]. In addition, we generated a specific antibody against phosphorylated MORC2 at T582 and demonstrated that activation of PRKACA by forskolin enhanced the phosphorylation levels of MORC2 at T582 in a time-dependent manner (Figure S4). Immunoblotting analyses showed that treatment with E2, 4-OHT and FUL can activate PRKACA (Figure 5E–G). More importantly, treatment of MCF-7 cells with E2, 4-OHT, and FUL led to a significant increase in the phosphorylation levels of MORC2 at T582, whereas knockdown of endogenous PRKACA attenuated these effects (Figure 5E–G). Furthermore, we demonstrated that phosphorylation of MORC2 at T582 enhances its stability through decreasing its interaction with HSPA8 and LAMP2A (Figure 7). These results highlight a role for phosphorylation modification of MORC2 in preventing its lysosomal degradation by CMA. In contrast, it has been reported that phosphorylation of serine/threonine-protein kinase ULK1 by protein kinase C alpha type [71] and phosphorylation of lipid droplet protein PLIN2 by AMP-activated protein kinase triggers their degradation by CMA [72].
In summary, we uncovered a GPER1-PRKACA-MORC2 pathway in governing E2-mediated cell growth and cellular sensitivity to antiestrogens in breast cancer. As MORC2 expression is upregulated in breast tumors [32], discovery of novel drugs targeting MORC2 could suppress breast cancer growth and enhance cellular sensitivity to endocrine therapy. These emerging findings provide new mechanistic insights into how the estrogen-ESR signaling drives breast cancer development and antiestrogen response and define novel therapeutic targets for breast cancer.
Materials and methods
Chemicals and reagents
All chemicals and reagents were purchased from Sigma-Aldrich unless otherwise noted. AG1478 (S2728), LY294002 (S1105), U0126 (S1102), H89 (S1582), forskolin (S2449), MG-132 (S2619), 3-MA (S2767), and Baf A1 (S1413) were purchased from Selleck Chemicals. G1 (881,639-98-1), G36 (1,392,487-51-2), and puromycin (58-58-2) were obtained from Cayman Chemical. FUL was kindly provided by AstraZeneca (129,453-61-8). All compounds were dissolved in DMSO except E2, 4-OHT, and FUL, which were dissolved in ethanol.
Cell culture and treatment
Human breast cancer MCF-7 (SCSP-531), SK-BR-3 (TCHu225), MDA-MB-468 (TCHu136) cell lines, and HEK293T (GNHu17) cell line were obtained from the Type Culture Collection of Chinese Academy of Sciences, and were authenticated by routine detection of morphology, cell vitality, DNA fingerprinting, and mycoplasma. MCF-7 and HEK293T cells were maintained in DMEM medium (BasalMedia, L110). SK-BR-3 and MDA-MB-468 cells were maintained in McCoy’s 5A (L630) and Leibovitzs L15 medium (L620) (BasalMedia), respectively. All the media were supplemented with 10% fetal bovine serum (Gibco, 10,270–106) and 1% penicillin-streptomycin (BasalMedia, S110B). For E2 treatment, cells were grown in phenol red-free DMEM medium (BasalMedia, L140) supplemented with 5% dextran-coated charcoal (DCC)-stripped fetal bovine serum (Biological Industries, 04-201-1A) for 48 h before experimentation. For administration with various inhibitors, cells were treated with 10 nM 4-OHT (Sigma-Aldrich, H6278), 10 nM FUL, 10 μM AG1478, 10 μM LY294002, 10 μM U0126, 10 μM H89, 20 μM MG-132, 100 μg/ml CHX (Cell Signaling Technology, 2112S), 10 mM 3-MA, 50 mM NH4Cl, and 50 ng/ml Baf A1 for the indicated times. For CMA induction, cells were cultured in serum-free medium (serum starvation) for the indicated times.
Expression vectors, siRNAs, and transfection
Myc-DDK-MORC2 cDNA was obtained from Origene (RC200518) and subcloned into the lentiviral vector pCDH-CMV-MCS-EF1-Puro (System Biosciences, CD510B-1) to generate Flag-MORC2 expression vector. Flag-His-PRKACA (CH857025) and Flag-His-HSPA8 (CH855664) cDNAs were obtained from Vigene Biosciences and subcloned into pCDH-CMV-MCS-EF1-Puro vector to generate HA-PRKACA and HA-HSPA8 expression vector, respectively. Site-directed mutations were generated by PCR-based mutagenesis and verified by DNA sequencing. Human MORC2 (TL311427) and GPER1 (TL316565) short hairpin RNAs (shRNAs) in pGFP-C-shLenti vector were purchased from Origene. Human GPER1 shRNAs in pGLVH1/GFP+Puro vector were obtained from GenePharma (D02001). Human PRKACA shRNAs were purchased from GE Dharmacon (RHS4531-EG5566). The detailed information concerning DNA constructs and the primers used for molecular cloning is provided in Tables S1 and S2. Small interfering RNA (siRNA) oligonucleotides specific for human HSPA8 (siHSPA8) and LAMP2A (siLAMP2A) were synthesized by GenePharma (A09004), and the siRNA sequences are provided in Table S3.
Transient plasmid transfection was performed using Neofect DNA transfection reagent (TengyiBio, TF201201) according to the manufacturer’s protocol. To generate stable cell lines expressing shRNAs or cDNAs, HEK293T cells were transfected with each lentivirus expression vector and packaging plasmid mix using Neofect DNA transfection reagent. The supernatant containing viruses was collected 48 h after transfection, filtered, and used for infecting target cells in the presence of 8 μg/ml of polybrene (Sigma-Aldrich, H9268) prior to drug selection with 2 μg/ml of puromycin for one week. siHSPA8, siLAMP2A, and negative control siRNA (siNC) were transfected using Lipofectamine 2000 (Invitrogen, 11,668,019) according to the manufacturer’s instructions.
qPCR analysis
Total RNA was isolated using TRIzol reagent (Invitrogen, 15,596,018) and cDNA was synthesized using PrimeScript RT Master Mix (Takara, RR036A). qPCR analysis was performed in triplicate using FastStart Universal SYBR Green Master (Roche, 4,913,914,001) on an Eppendorf Realplex qPCR machine. All of primers were synthesized by HuaGene Biotech and the sequences of the primers are available in Table S4. Relative gene expression was analyzed using the 2−ΔΔCT method by normalization to the β-actin levels.
Antibodies, immunoblotting, and immunoprecipitation
The detailed information for commercially available primary antibodies used in this study is provided in Table S5. A polyclonal anti-p-MORC2 T582 antibody was generated by Abgent Biotech (Suzhou, China). A synthetic phosphopeptide (NH2-CEKLEALQKTp[Thr]PIRS-CONH2) and a nonphosphopeptide (NH2-CEKLEALQKTTPIRS-CONH2) corresponding to residues surrounding T582 of MORC2 were used to immunize rabbits. Affinity purified antisera were evaluated by immunoblotting and immunohistochemical analysis. For immunoblotting analysis, cells were lysed in RIPA buffer containing protease (Roche, 5,056,489,001) and phosphatase inhibitors (Bimake, B15002) as described previously [33]. Proteins were separated by SDS-PAGE and then transferred onto a PVDF membrane (Millipore, IPVH00010). The membranes were incubated with primary antibodies according to manufacturer’s instructions and detected using enhanced chemiluminescence detection kit (Yeasen, 36208ES80). For IP analysis, cells were lysed in NP-40 lysis buffer [33] containing protease (Roche, 5,056,489,001) and phosphatase inhibitors (Bimake, B15002). Supernatants were incubated with 1–3 μg primary antibodies overnight at 4°C on a rotating platform, followed by immunoblotting analysis. Protein band densities were quantified using ImageJ software (http://rsb.info.nih.gov/ij/index.html).
Immunofluorescent staining
Cells were fixed in 4% paraformaldehyde, permeabilized in 0.1% Triton X-100, and blocked in 10% normal goat serum in PBS. Cells were incubated with primary antibodies, washed three times in PBS, and then incubated with the appropriate secondary antibody conjugated with 555-Alexa (4409S or 4413S) or 488-Alexa (4408S or 4412S) (Cell Signaling Technology), respectively. DNA staining was performed using fluoroshield mounting medium with DAPI (Abcam, ab104139). Microscopic analyses were performed using a Leica SP5 confocal laser scanning microscopy (Leica Microsystems, Buffalo Grove, USA).
Breast tumor samples and immunohistochemistry
Five pairs of pre- and post-TAM treatment tumor samples were obtained from pre-treatment excision surgery and post-treatment re-operation or biopsies after recurrence. All procedures were performed under a protocol approved by the Ethics Committee at Fudan University, and written informed consent was obtained from all patients. For immunohistochemical staining, paraffin-embedded tumor tissue sections (4 μm) were deparaffinized, rehydrated, permeabilized in PBS containing 0.01% Triton X-100, and blocked in 3% normal goat serum diluted in PBS plus 0.1% Tween-20. Slides were incubated with an anti-MORC2 p-T582 antibody (1:50) overnight at 4°C and detected using EnVision Detection Systems (Peroxidase/DAB, Rabbit/Mouse; DAKO, K5007) according to the manufacturer’s protocol. Negative controls with omitted primary antibodies were included and did not show any staining. Hematoxylin was used for counterstaining in all specimens.
Colony formation
For colony formation assay, 500 cells were plated into 6-well plates. After overnight incubation, cells were treated with 10 nM E2, 10 nM of 4-OHT, and 10 nM FUL for 10–14 days. The colonies were fixed in methanol and stained with 0.5% crystal violet. Colonies consisting of 50 cells or more were counted.
cAMP measurement
SK-BR-3 cells were pretreated with or without 10 μM G36 for 1 h, and then incubated with or without 10 nM E2, 10 nM 4-OHT, 10 nM FUL, and 1 μM G1 for another 1 h. The intracellular cAMP levels were determined using cAMP complete enzyme-linked immunosorbent assay (ELISA) kit (Abcam, ab133051) according to the manufacturer’s instructions. Data was analyzed by reading the optical density (OD) absorbance at 405 nm using a microplate reader. The results are expressed as the mean ± standard deviation from three independent experiments in triplicate.
Statistical analyses
All data is presented as the mean ± standard deviation from at least three independent experiments. The Student’s t-test was used for assessing the difference between individual groups and p ≤ 0.05 was considered statistically significant.
Supplementary Material
Acknowledgments
We sincerely acknowledge the staff members of the pathology core facility (Shanghai Cancer Center) and members in the Li laboratory for their technical assistance and helpful advices.
Funding Statement
This work is supported by the National Natural Science Foundation of China [No. 81372847, 81572584, and 81772805]; the Program for Professor of Special Appointment (Eastern Scholar) at Shanghai Institutions of Higher Learning [No. 2013-06]; the Science and Technology Innovation Action Plan of Shanghai Municipal Science and Technology Commission [No. 16JC1405400]; and the start-up funds for new investigators from Fudan University.
Disclosure statement
No potential conflict of interest was reported by the authors.
Supplementary material
Supplemental data for this article can be accessed here.
References
- [1].Bray F, Ferlay J, Soerjomataram I, et al. Global cancer statistics 2018: GLOBOCAN estimates of incidence and mortality worldwide for 36 cancers in 185 countries. CA Cancer J Clin. 2018;68:394–424. [DOI] [PubMed] [Google Scholar]
- [2].Yager JD, Davidson NE.. Estrogen carcinogenesis in breast cancer. N Engl J Med. 2006;354:270–282. [DOI] [PubMed] [Google Scholar]
- [3].Thomas C, Gustafsson JA. The different roles of ER subtypes in cancer biology and therapy. Nat Rev Cancer. 2011;11:597–608. [DOI] [PubMed] [Google Scholar]
- [4].Carroll JS, Brown M. Estrogen receptor target gene: an evolving concept. Mol Endocrinol. 2006;20:1707–1714. [DOI] [PubMed] [Google Scholar]
- [5].Ignatiadis M, Sotiriou C. Luminal breast cancer: from biology to treatment. Nat Rev Clin Oncol. 2013;10:494–506. [DOI] [PubMed] [Google Scholar]
- [6].Osborne CK. Tamoxifen in the treatment of breast cancer. N Engl J Med. 1998;339:1609–1618. [DOI] [PubMed] [Google Scholar]
- [7].Johnston SJ, Cheung KL. Fulvestrant - a novel endocrine therapy for breast cancer. Curr Med Chem. 2010;17:902–914. [DOI] [PubMed] [Google Scholar]
- [8].Revankar CM, Cimino DF, Sklar LA, et al. A transmembrane intracellular estrogen receptor mediates rapid cell signaling. Science. 2005;307:1625–1630. [DOI] [PubMed] [Google Scholar]
- [9].Prossnitz ER, Barton M. The G-protein-coupled estrogen receptor GPER in health and disease. Nat Rev Endocrinol. 2011;7:715–726. [DOI] [PMC free article] [PubMed] [Google Scholar]
- [10].Filardo EJ, Quinn JA, Bland KI, et al. Estrogen-induced activation of Erk-1 and Erk-2 requires the G protein-coupled receptor homolog, GPR30, and occurs via trans-activation of the epidermal growth factor receptor through release of HB-EGF. Mol Endocrinol. 2000;14:1649–1660. [DOI] [PubMed] [Google Scholar]
- [11].Hsieh YC, Yu HP, Frink M, et al. G protein-coupled receptor 30-dependent protein kinase A pathway is critical in nongenomic effects of estrogen in attenuating liver injury after trauma-hemorrhage. Am J Pathol. 2007;170:1210–1218. [DOI] [PMC free article] [PubMed] [Google Scholar]
- [12].Girgert R, Emons G, Grundker C. Inhibition of GPR30 by estriol prevents growth stimulation of triple-negative breast cancer cells by 17beta-estradiol. BMC Cancer. 2014;14:935. [DOI] [PMC free article] [PubMed] [Google Scholar]
- [13].Pandey DP, Lappano R, Albanito L, et al. Estrogenic GPR30 signalling induces proliferation and migration of breast cancer cells through CTGF. Embo J. 2009;28:523–532. [DOI] [PMC free article] [PubMed] [Google Scholar]
- [14].Girgert R, Emons G, Grundker C. Inactivation of GPR30 reduces growth of triple-negative breast cancer cells: possible application in targeted therapy. Breast Cancer Res Treat. 2012;134:199–205. [DOI] [PMC free article] [PubMed] [Google Scholar]
- [15].Filardo EJ, Quinn JA, Frackelton AR Jr., et al. Estrogen action via the G protein-coupled receptor, GPR30: stimulation of adenylyl cyclase and cAMP-mediated attenuation of the epidermal growth factor receptor-to-MAPK signaling axis. Mol Endocrinol. 2002;16:70–84. [DOI] [PubMed] [Google Scholar]
- [16].De Francesco EM, Pellegrino M, Santolla MF, et al. GPER mediates activation of HIF1alpha/VEGF signaling by estrogens. Cancer Res. 2014;74:4053–4064. [DOI] [PubMed] [Google Scholar]
- [17].Quinn JA, Graeber CT, Frackelton AR Jr., et al. Coordinate regulation of estrogen-mediated fibronectin matrix assembly and epidermal growth factor receptor transactivation by the G protein-coupled receptor, GPR30. Mol Endocrinol. 2009;23:1052–1064. [DOI] [PMC free article] [PubMed] [Google Scholar]
- [18].Vivacqua A, Romeo E, De Marco P, et al. GPER mediates the Egr-1 expression induced by 17beta-estradiol and 4-hydroxitamoxifen in breast and endometrial cancer cells. Breast Cancer Res Treat. 2012;133:1025–1035. [DOI] [PubMed] [Google Scholar]
- [19].Catalano S, Giordano C, Panza S, et al. Tamoxifen through GPER upregulates aromatase expression: a novel mechanism sustaining tamoxifen-resistant breast cancer cell growth. Breast Cancer Res Treat. 2014;146:273–285. [DOI] [PubMed] [Google Scholar]
- [20].Madeo A, Maggiolini M. Nuclear alternate estrogen receptor GPR30 mediates 17beta-estradiol-induced gene expression and migration in breast cancer-associated fibroblasts. Cancer Res. 2010;70:6036–6046. [DOI] [PubMed] [Google Scholar]
- [21].Mo Z, Liu M, Yang F, et al. GPR30 as an initiator of tamoxifen resistance in hormone-dependent breast cancer. Breast Cancer Res. 2013;15:R114. [DOI] [PMC free article] [PubMed] [Google Scholar]
- [22].Filardo EJ, Graeber CT, Quinn JA, et al. Distribution of GPR30, a seven membrane-spanning estrogen receptor, in primary breast cancer and its association with clinicopathologic determinants of tumor progression. Clin Cancer Res. 2006;12:6359–6366. [DOI] [PubMed] [Google Scholar]
- [23].Ignatov A, Ignatov T, Weissenborn C, et al. G-protein-coupled estrogen receptor GPR30 and tamoxifen resistance in breast cancer. Breast Cancer Res Treat. 2011;128:457–466. [DOI] [PubMed] [Google Scholar]
- [24].Ignatov A, Ignatov T, Roessner A, et al. Role of GPR30 in the mechanisms of tamoxifen resistance in breast cancer MCF-7 cells. Breast Cancer Res Treat. 2010;123:87–96. [DOI] [PubMed] [Google Scholar]
- [25].Li DQ, Nair SS, Kumar R. The MORC family: new epigenetic regulators of transcription and DNA damage response. Epigenetics. 2013;8:685–693. [DOI] [PMC free article] [PubMed] [Google Scholar]
- [26].Iyer LM, Abhiman S, Aravind L. MutL homologs in restriction-modification systems and the origin of eukaryotic MORC ATPases. Biol Direct. 2008;3:8. [DOI] [PMC free article] [PubMed] [Google Scholar]
- [27].Perry J, Zhao Y. The CW domain, a structural module shared amongst vertebrates, vertebrate-infecting parasites and higher plants. Trends Biochem Sci. 2003;28:576–580. [DOI] [PubMed] [Google Scholar]
- [28].Li DQ, Nair SS, Ohshiro K, et al. MORC2 signaling integrates phosphorylation-dependent, ATPase-coupled chromatin remodeling during the DNA damage response. Cell Rep. 2012;2:1657–1669. [DOI] [PMC free article] [PubMed] [Google Scholar]
- [29].Liu N, Lee CH, Swigut T, et al. Selective silencing of euchromatic L1s revealed by genome-wide screens for L1 regulators. Nature. 2018;553:228–232. [DOI] [PMC free article] [PubMed] [Google Scholar]
- [30].Sanchez-Solana B, Li DQ, Kumar R. Cytosolic functions of MORC2 in lipogenesis and adipogenesis. Biochim Biophys Acta. 2014;1843:316–326. [DOI] [PMC free article] [PubMed] [Google Scholar]
- [31].Chen LH, Kuo WH, Tsai MH, et al. Identification of prognostic genes for recurrent risk prediction in triple negative breast cancer patients in Taiwan. PLoS One. 2011;6:e28222. [DOI] [PMC free article] [PubMed] [Google Scholar]
- [32].Ding QS, Zhang L, Wang BC, et al. Aberrant high expression level of MORC2 is a common character in multiple cancers. Hum Pathol. 2018;76:58–67. [DOI] [PubMed] [Google Scholar]
- [33].Liao XH, Zhang Y, Dong WJ, et al. Chromatin remodeling protein MORC2 promotes breast cancer invasion and metastasis through a PRD domain-mediated interaction with CTNND1. Oncotarget. 2017;8:97941–97954. [DOI] [PMC free article] [PubMed] [Google Scholar]
- [34].Zhang FL, Cao JL, Xie HY, et al. Cancer-associated MORC2-mutant M276I regulates an hnRNPM-mediated CD44 splicing switch to promote invasion and metastasis in triple-negative breast cancer. Cancer Res. 2018;78:5780–5792. [DOI] [PubMed] [Google Scholar]
- [35].Mizushima N, Levine B, Cuervo AM, et al. Autophagy fights disease through cellular self-digestion. Nature. 2008;451:1069–1075. [DOI] [PMC free article] [PubMed] [Google Scholar]
- [36].Ravid T, Hochstrasser M. Diversity of degradation signals in the ubiquitin-proteasome system. Nat Rev Mol Cell Biol. 2008;9:679–690. [DOI] [PMC free article] [PubMed] [Google Scholar]
- [37].Kaushik S, Cuervo AM. The coming of age of chaperone-mediated autophagy. Nat Rev Mol Cell Biol. 2018;19:365–381. [DOI] [PMC free article] [PubMed] [Google Scholar]
- [38].Kaushik S, Cuervo AM. Chaperone-mediated autophagy: a unique way to enter the lysosome world. Trends Cell Biol. 2012;22:407–417. [DOI] [PMC free article] [PubMed] [Google Scholar]
- [39].Chiang HL, Terlecky SR, Plant CP, et al. A role for a 70-kilodalton heat shock protein in lysosomal degradation of intracellular proteins. Science. 1989;246:382–385. [DOI] [PubMed] [Google Scholar]
- [40].Cuervo AM, Dice JF. A receptor for the selective uptake and degradation of proteins by lysosomes. Science. 1996;273:501–503. [DOI] [PubMed] [Google Scholar]
- [41].Samanta S, Sharma VM, Khan A, et al. Regulation of IMP3 by EGFR signaling and repression by ERbeta: implications for triple-negative breast cancer. Oncogene. 2012;31:4689–4697. [DOI] [PMC free article] [PubMed] [Google Scholar]
- [42].Seo HS, Larsimont D, Querton G, et al. Estrogenic and anti-estrogenic regulation of estrogen receptor in MCF-7 breast-cancer cells: comparison of immunocytochemical data with biochemical measurements. Int J Cancer. 1998;78:760–765. [DOI] [PubMed] [Google Scholar]
- [43].Bologa CG, Revankar CM, Young SM, et al. Virtual and biomolecular screening converge on a selective agonist for GPR30. Nat Chem Biol. 2006;2:207–212. [DOI] [PubMed] [Google Scholar]
- [44].Dennis MK, Field AS, Burai R, et al. Identification of a GPER/GPR30 antagonist with improved estrogen receptor counterselectivity. J Steroid Biochem Mol Biol. 2011;127:358–366. [DOI] [PMC free article] [PubMed] [Google Scholar]
- [45].Filardo EJ, Thomas P. GPR30: a seven-transmembrane-spanning estrogen receptor that triggers EGF release. Trends Endocrinol Metab. 2005;16:362–367. [DOI] [PubMed] [Google Scholar]
- [46].Maggiolini M, Picard D. The unfolding stories of GPR30, a new membrane-bound estrogen receptor. J Endocrinol. 2010;204:105–114. [DOI] [PubMed] [Google Scholar]
- [47].Nilsson BO, Olde B, Leeb-Lundberg LM. G protein-coupled oestrogen receptor 1 (GPER1)/GPR30: a new player in cardiovascular and metabolic oestrogenic signalling. Br J Pharmacol. 2011;163:1131–1139. [DOI] [PMC free article] [PubMed] [Google Scholar]
- [48].Shaywitz AJ, Greenberg ME. CREB: a stimulus-induced transcription factor activated by a diverse array of extracellular signals. Annu Rev Biochem. 1999;68:821–861. [DOI] [PubMed] [Google Scholar]
- [49].Thomas P, Pang Y, Filardo EJ, et al. Identity of an estrogen membrane receptor coupled to a G protein in human breast cancer cells. Endocrinology. 2005;146:624–632. [DOI] [PubMed] [Google Scholar]
- [50].Moody SE, Schinzel AC, Singh S, et al. PRKACA mediates resistance to HER2-targeted therapy in breast cancer cells and restores anti-apoptotic signaling. Oncogene. 2015;34:2061–2071. [DOI] [PMC free article] [PubMed] [Google Scholar]
- [51].Michalides R, Griekspoor A, Balkenende A, et al. Tamoxifen resistance by a conformational arrest of the estrogen receptor alpha after PKA activation in breast cancer. Cancer Cell. 2004;5:597–605. [DOI] [PubMed] [Google Scholar]
- [52].Beristain AG, Molyneux SD, Joshi PA, et al. PKA signaling drives mammary tumorigenesis through Src. Oncogene. 2015;34:1160–1173. [DOI] [PubMed] [Google Scholar]
- [53].Iyer GH, Moore MJ, Taylor SS. Consequences of lysine 72 mutation on the phosphorylation and activation state of cAMP-dependent kinase. J Biol Chem. 2005;280:8800–8807. [DOI] [PubMed] [Google Scholar]
- [54].Steichen JM, Kuchinskas M, Keshwani MM, et al. Structural basis for the regulation of protein kinase A by activation loop phosphorylation. J Biol Chem. 2012;287:14672–14680. [DOI] [PMC free article] [PubMed] [Google Scholar]
- [55].Adams JA, McGlone ML, Gibson R, et al. Phosphorylation modulates catalytic function and regulation in the cAMP-dependent protein kinase. Biochemistry. 1995;34:2447–2454. [DOI] [PubMed] [Google Scholar]
- [56].Brooks CL, Gu W. p53 ubiquitination: Mdm2 and beyond. Mol Cell. 2006;21:307–315. [DOI] [PMC free article] [PubMed] [Google Scholar]
- [57].Seglen PO, Gordon PB. 3-Methyladenine: specific inhibitor of autophagic/lysosomal protein degradation in isolated rat hepatocytes. Proc Natl Acad Sci U S A. 1982;79:1889–1892. [DOI] [PMC free article] [PubMed] [Google Scholar]
- [58].Wang B, Cai Z, Tao K, et al. Essential control of mitochondrial morphology and function by chaperone-mediated autophagy through degradation of PARK7. Autophagy. 2016;12:1215–1228. [DOI] [PMC free article] [PubMed] [Google Scholar]
- [59].Cuervo AM, Knecht E, Terlecky SR, et al. Activation of a selective pathway of lysosomal proteolysis in rat liver by prolonged starvation. Am J Physiol. 1995;269:C1200–8. [DOI] [PubMed] [Google Scholar]
- [60].Patel B, Cuervo AM. Methods to study chaperone-mediated autophagy. Methods. 2015;75:133–140. [DOI] [PMC free article] [PubMed] [Google Scholar]
- [61].Park C, Suh Y, Cuervo AM. Regulated degradation of Chk1 by chaperone-mediated autophagy in response to DNA damage. Nat Commun. 2015;6:6823. [DOI] [PMC free article] [PubMed] [Google Scholar]
- [62].Hyun YS, Hong YB, Choi BO, et al. Clinico-genetics in Korean charcot-marie-tooth disease type 2Z with MORC2 mutations. Brain. 2016;139:e40. [DOI] [PubMed] [Google Scholar]
- [63].Marjon NA, Hu C, Hathaway HJ, et al. G protein-coupled estrogen receptor regulates mammary tumorigenesis and metastasis. Mol Cancer Res. 2014;12:1644–1654. [DOI] [PMC free article] [PubMed] [Google Scholar]
- [64].Musgrove EA, Sutherland RL. Biological determinants of endocrine resistance in breast cancer. Nat Rev Cancer. 2009;9:631–643. [DOI] [PubMed] [Google Scholar]
- [65].Davies C, Pan H, Godwin J, et al. Long-term effects of continuing adjuvant tamoxifen to 10 years versus stopping at 5 years after diagnosis of oestrogen receptor-positive breast cancer: ATLAS, a randomised trial. Lancet. 2013;381:805–816. [DOI] [PMC free article] [PubMed] [Google Scholar]
- [66].Colleoni M, Gelber S, Goldhirsch A, et al.; International Breast Cancer Study G . Tamoxifen after adjuvant chemotherapy for premenopausal women with lymph node-positive breast cancer: International breast cancer study group trial 13–93. J Clin Oncol. 2006;24:1332–1341. [DOI] [PubMed] [Google Scholar]
- [67].Hammond ME, Hayes DF, Dowsett M, et al. American Society of Clinical Oncology/College of American Pathologists guideline recommendations for immunohistochemical testing of estrogen and progesterone receptors in breast cancer (unabridged version). Arch Pathol Lab Med. 2010;134:e48–72. [DOI] [PubMed] [Google Scholar]
- [68].Kaushik S, Bandyopadhyay U, Sridhar S, et al. Chaperone-mediated autophagy at a glance. J Cell Sci. 2011;124:495–499. [DOI] [PMC free article] [PubMed] [Google Scholar]
- [69].Zwart W, Griekspoor A, Berno V, et al. PKA-induced resistance to tamoxifen is associated with an altered orientation of ERalpha towards co-activator SRC-1. Embo J. 2007;26:3534–3544. [DOI] [PMC free article] [PubMed] [Google Scholar]
- [70].Zhou H, Di Palma S, Preisinger C, et al. Toward a comprehensive characterization of a human cancer cell phosphoproteome. J Proteome Res. 2013;12:260–271. [DOI] [PubMed] [Google Scholar]
- [71].Wang C, Wang H, Zhang D, et al. Phosphorylation of ULK1 affects autophagosome fusion and links chaperone-mediated autophagy to macroautophagy. Nat Commun. 2018;9:3492. [DOI] [PMC free article] [PubMed] [Google Scholar]
- [72].Kaushik S, Cuervo AM. AMPK-dependent phosphorylation of lipid droplet protein PLIN2 triggers its degradation by CMA. Autophagy. 2016;12:432–438. [DOI] [PMC free article] [PubMed] [Google Scholar]
Associated Data
This section collects any data citations, data availability statements, or supplementary materials included in this article.