
Figure 6.
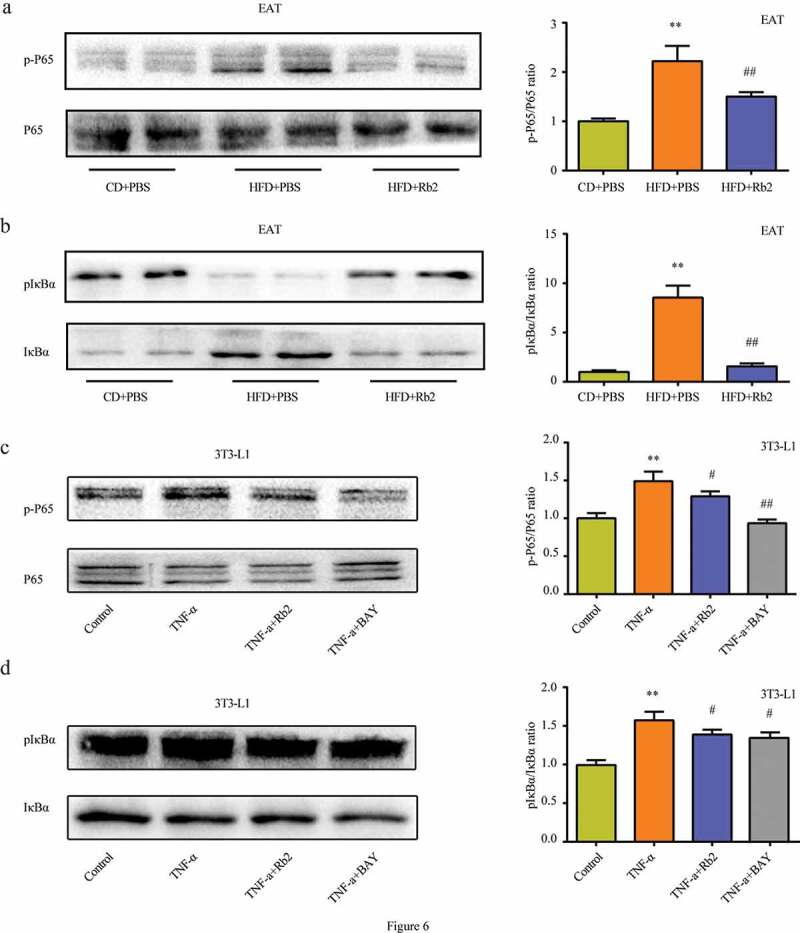
Rb2 inhibited NF-κB pathway both in epididymal adipose tissue (EATs) and 3T3-L1 adipocytes. Phosphorylation (p-P65) and total NF-κB/P65 (P65) levels in EATs (a) and 3T3-L1 cells (c); Phosphorylatio (p-IκBα) and total IκBα levels in EATs (b) and 3T3-L1 cells (d). Data are presented as mean ± SEM. (a-b) *P < 0.05, **P < 0.01 compared with CD+PBS group; #P < 0.05, ##P < 0.01 compared with HFD+PBS group; (c-d)*P < 0.05, **P < 0.01 compared with control group; #P < 0.05, ##P < 0.01 compared with TNF-α group