

ABSTRACT
Diabetes is a recognized high-risk factor for the development of atherosclerosis, in which macroautophagy/autophagy is emerging to play essential roles. The retention of low-density lipoprotein (LDL) particles in subendothelial space following transcytosis across the endothelium is the initial step of atherosclerosis. Here, we identified that high glucose could promote atherosclerosis by stimulating transcytosis of LDL. By inhibiting AMPK-MTOR-PIK3C3 pathway, high glucose suppresses the CAV-CAVIN-LC3B-mediated autophagic degradation of CAV1; therefore, more CAV1 is accumulated in the cytosol and utilized to form more caveolae in the cell membrane and facilitates the LDL transcytosis across endothelial cells. For a proof of concept, higher levels of lipids were accumulated in the subendothelial space of umbilical venous walls from pregnant women with gestational diabetes mellitus (GDM), compared to those of pregnant women without GDM. Our results reveal that high glucose stimulates LDL transcytosis by a novel CAV1-CAVIN1-LC3B signaling-mediated autophagic degradation pathway.
Abbreviations
3-MA: 3-methyladenine; ACTB: actin beta; AMPK: AMP-activated protein kinase; Bafi: bafilomycin A1; CAV1: caveolin-1; CAVIN1: caveolae associated protein 1; CSD: the CAV1 scaffolding domain; GDM: gestational diabetes mellitus; IMD: intramembrane domain; LIR: LC3-interacting region; MAP1LC3/LC3: microtubule- associated protein 1 light chain 3; MFI: mean fluorescence intensity; MTOR: mechanistic target of rapamycin kinase; PIK3C3/VPS34: phosphatidylinositol 3-kinase catalytic subunit type 3; SQSTM1/p62: sequestosome 1.
KEYWORDS: Atherosclerosis, autophagy, CAV1/caveolin-1, caveolae associated protein 1, hyperglycemia, LDL transcytosis
Introduction
Atherosclerotic cardio- or cerebral-vascular diseases are common causes of morbidity and mortality worldwide, for which diabetes represents one of the most important risk factors [1]. Several clinical studies have demonstrated a correlation between suboptimal glycemic control and fewer cardiovascular events, suggesting a benefit for atherosclerotic cardio- or cerebral- vascular diseases by lowering glucose levels in patients with type 2 diabetes [2,3]. However, the mechanisms of hyperglycemia, one of the major features in diabetes, on impacting atherosclerosis are not fully elucidated.
Subendothelial retention of APOB/apoB100 (apolipoprotein B)-containing lipoproteins, such as LDL is the initial step of atherogenesis [4,5]. Since the diameter of LDL is much larger than the intercellular space between endothelial cells, LDL particles can only be transported across the intact endothelial barrier through transcytosis [6,7]. Caveolae-mediated endocytosis is known to be involved in LDL transcytosis [8,9].
CAV1 and CAVIN1 are 2 essential and structural components of caveolae, and represent small invaginations of the plasma membrane that form lipid vesicles [9]. CAV1 is a 21–22 kDa integral membrane protein containing cytoplasmic N and C termini that sandwich the membrane-association domains: the CAV1 scaffolding domain (CSD; residues 82–101) and the intramembrane domain (IMD; residues 102–134) [10]. CAV1 deficiency prevents LDL transcytosis across endothelial cells [11,12]. In our previous studies, we have shown that CAV1 upregulation is associated with enhanced LDL transcytosis induced by pro-inflammatory factors [13,14]. CAVIN1 is most abundant in endothelial cells [15], and is recruited to caveolae to immediately stabilize CAV1 during CAV1 oligomers arrangement in the cell membrane [10,16]. CAVIN1 deficiency leads to the loss of morphology typical of caveolae [17]. However, it is yet unclear whether CAV1 and CAVIN1 play a role in regulating LDL transcytosis under hyperglycemic conditions.
Macroautophagy/autophagy is characterized by the formation of double membrane vesicles called autophagosomes, which engulf cytoplasmic structures and fusion with lysosome for destruction [18]. Basal autophagy helps cells to remove aged or damaged organelles and is critical for cellular homeostasis [19,20]. The formation of autophagosomes requires 2 ubiquitin-like systems. First, the ubiquitin-like protein ATG12 is conjugated to ATG5 by ATG7 (E1-like) and ATG10 (E2-like) enzymes, and results in the formation of a complex between ATG12–ATG5 and ATG16L1, which participates in elongation of the autophagic membrane. A second conjugation system requires the ubiquitin-like protein MAP1LC3/LC3. In general, the covalent conjugation of a soluble form of LC3B (LC3B-I) with phosphatidylethanolamine to form a non-soluble form (LC3B-II) is a hallmark of autophagy.
Previous reports demonstrated the suppression of high glucose on the activity of AMPK, which then consolidates BCL2-BECN1, leading to autophagy inhibition in cardiomyocytes [21,22]. Interestingly, atherosclerotic lesions were significantly increased in high-fat fed apoe−/− mice, in which endothelial autophagy is significantly impaired, indicating an essential role for endothelial autophagy in limiting lipid accumulation within the vessel wall [23]. However, whether high glucose could promote LDL transcytosis to increase the subendothelial retention of atherogenic lipids, and whether autophagy could regulate excessive LDL transcytosis have not been elucidated.
In our study, we first evaluated the effects of high glucose on lipid transcytosis across endothelial cells and lipid retention. Our results demonstrated that treatment with high glucose resulted in enhanced LDL transcytosis and lipid retention. To further clarify the molecular mechanisms involved the roles of autophagy and caveolae-residing proteins, CAV1 and CAVIN1 were investigated which revealed that high glucose suppressed autophagic degradation of CAV1, and then increased the interaction of CAV1 and CAVIN1 with LC3B, upregulating caveolae, and consequently promoting LDL transcytosis.
Results
High glucose stimulates LDL transcytosis
High glucose is an atherogenic factor in the development of atherosclerosis. In this study, we first measured the effects of high glucose on LDL transcytosis in HUVECs using the established non-radioactive in vitro approach [13]. As shown in Figure 1A,B, high glucose treatment significantly facilitated LDL transcytosis across the endothelial monolayer. In addition, mannitol did not show any effect, indicating that the potential effect of osmotic pressure could be excluded. Caveolae-mediated endocytosis is known to be involved in the transcytosis of LDL. Therefore, we tested the effect of CAV1 and CAVIN1 knockdown on LDL transcytosis induced by high glucose. CAV1 and CAVIN1 knockdown reversed the elevated LDL transcytosis induced by high glucose treatment (Figure 1A). Additionally, ATG5 siRNA mediated autophagy-specific inhibition, which enhanced high glucose-induced LDL transcytosis. Interestingly, rapamycin, which is an autophagy inducer, inhibited high glucose-induced LDL transcytosis, whereas 3-MA, an autophagy inhibitor, further accelerated high glucose-induced LDL transcytosis (Figure 1B), suggesting that autophagy may be involved in high glucose-induced LDL transcytosis. In an effort to further illustrating the effect of high glucose on lipid retention within the vascular wall, we collected the umbilical cords from pregnant women with or without GDM. We found increased lipid levels in the region above the basilar membrane of the umbilical venous wall in umbilical cord samples from pregnant women with GDM, when compared to pregnant women without GDM (Figure 1C). Interestingly, immunohistochemical analysis showed an increased expression of CAV1 and CAVIN1 (structural and essential components of caveolae) and a decreased expression of LC3B (an autophagy marker) in the endothelial monolayer of the vascular wall (Figure 1C).
Figure 1.
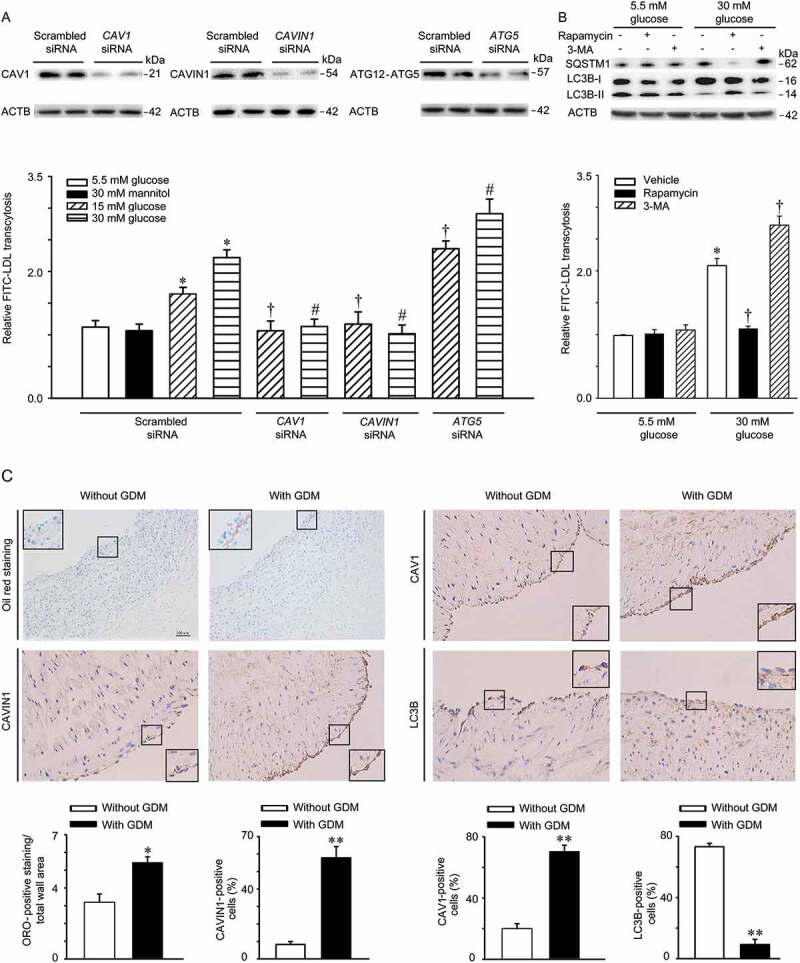
High glucose stimulates LDL transcytosis. (A) HUVECs were transfected with scrambled siRNA (20 nM), CAV1 siRNA (20 nM), CAVIN1 siRNA (20 nM), or ATG5 siRNA (20 nM) for 48 h, followed by treatment with glucose (5.5 mM, 15 mM or 30 mM) or mannitol (5.5 mM glucose+24.5 mM mannitol) for 24 h and FITC-LDL treatment for 3 h. LDL transcytosis was evaluated. (B) HUVECs were treated with rapamycin (5 nM, 24 h) or 3-MA (5 mM, 4 h) with different concentrations of glucose (5.5 mM, 30 mM, 24 h), after which LDL transcytosis was evaluated. * p < 0.05 versus scrambled siRNA +5.5 mM glucose or 5.5 mM glucose alone; † p < 0.05 versus scrambled siRNA+15 mM glucose or 30 mM glucose alone, # p < 0.05 versus scrambled siRNA+30 mM glucose, (n = 4). (C) Human umbilical cords were stained with Oil Red O (ORO), CAV1, CAVIN1, and LC3B, respectively. Quantitative summary of the percentage of area Oil Red or CAV1-CAVIN1-LC3B-positive cells in human umbilical cords venous. Scale bars: 100 μm. * p < 0.05, ** p < 0.01, versus without GDM.
Increased LDL uptake in high glucose-treated HUVECs
LDL uptake by endothelial cells is an intermediate step of LDL transcytosis. Thus, the concentration of LDL in cells reflects the activity of LDL transcytosis. In our study, flow cytometry analyses were performed to measure FITC-labeled LDL uptake in HUVECs. As shown in Figure 2A, after incubation with FITC-LDL, the mean fluorescence intensity (MFI) of HUVECs, reflecting the level of LDL uptake, was significantly increased. Moreover, as shown in Figure 2A,B, CAV1 and CAVIN1 knockdown almost completely aborted the fluorescent intensity of HUVECs stimulated by high glucose treatment. Conversely, ATG5 siRNA transfection further increased high glucose-induced LDL uptake (Figure 2A,B). Interestingly, rapamycin markedly attenuated high glucose-induced LDL uptake, while 3-MA, further increased high glucose-induced LDL uptake (Figure 2C,D).
Figure 2.
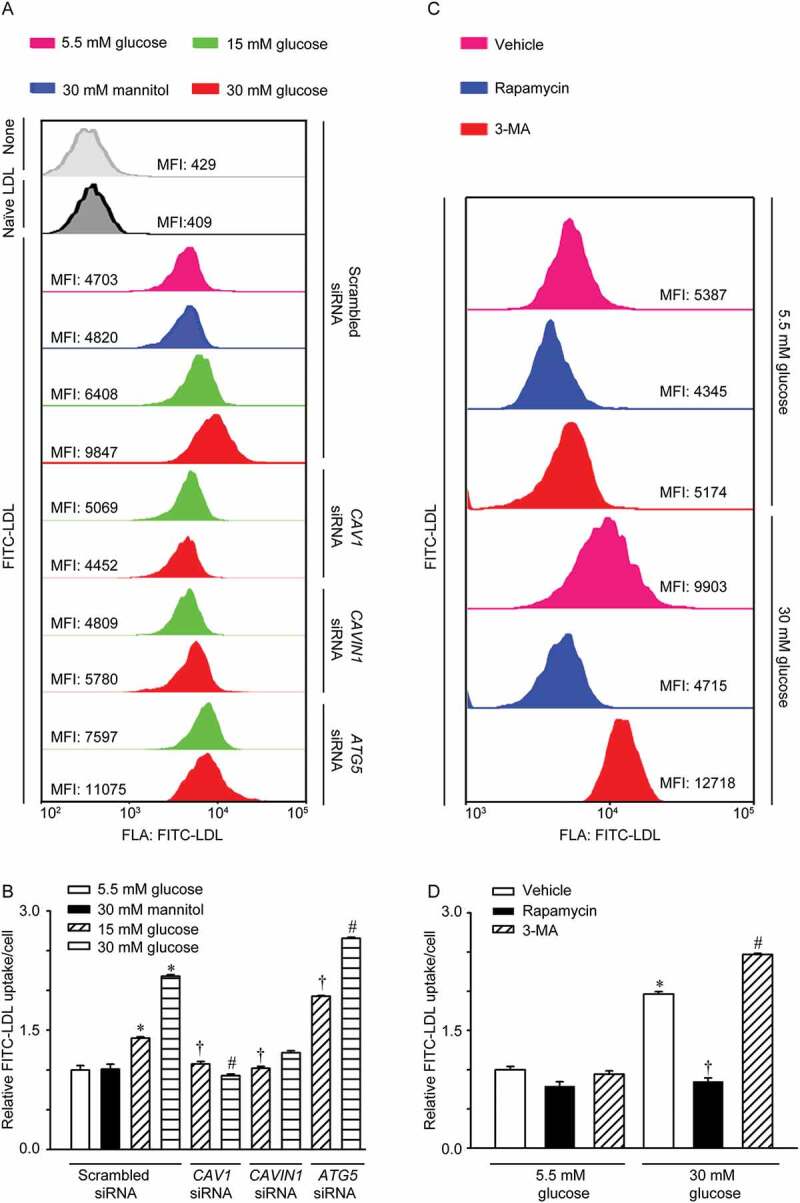
Increased LDL uptake in HUVECs treated with high glucose. (A, B) HUVECs were transfected with scrambled siRNA (20 nM), CAV1 siRNA (20 nM), or CAVIN1 siRNA (20 nM) for 48 h, followed by treatment with glucose (5.5 mM, 15 mM or 30 mM) or mannitol (5.5 mM glucose+24.5 mM mannitol) for 24 h and FITC-LDL treatment for 3 h. Cells were harvested using 0.125% trypsin and the uptake of LDL was measured by flow cytometry analysis. (A) Representative flow cytometry images show the MFI of HUVECs. (B) Quantification summary of FITC-LDL uptake in HUVECs. (C, D) HUVECs were treated with rapamycin (5 nM, 24 h) or 3-MA (5 mM, 4 h) with different concentrations of glucose (5.5 mM, 30 mM, 24 h), after which LDL uptake was evaluated. (C) Representative images of flow cytometry analysis indicate the MFI of HUVECs. (D) Quantification summary of FITC-LDL uptake in HUVECs. * p < 0.05 versus scrambled siRNA+ 5.5 mM glucose or 5.5 mM glucose alone; † p < 0.05 versus scrambled siRNA+15 mM glucose or 30 mM glucose alone, # p < 0.05 versus scrambled siRNA+30 mM glucose (n = 4).
High glucose suppresses autophagy
The above-mentioned data suggested that caveolae structural proteins and the autophagy pathway were involved in LDL transcytosis across endothelial cells. Therefore, we next evaluated the effect of high glucose on the expression of caveolae structural proteins (CAV1 and CAVIN1) and autophagy marker (LC3B). Treatment with 15 mM glucose and 30 mM glucose increased the expression of CAV1 and CAVIN1 but suppressed the expression of LC3B-II (Figure 3A). Furthermore, transmission electron microscopy revealed a decrease in autophagic vacuoles in the cytoplasm as well as a significant increase in caveolae in the membranes of HUVECs (Figure 3B). The decrease in autophagosomes in cells is an intermediate process within the autophagic flux and reflects a balance between the rate of formation and degradation. Thus, the decrease in autophagosomes in high glucose-treated cells may be explained by the following: (1) high glucose suppressed autophagosomes formation, (2) high glucose promoted the fusion of lysosomes and autophagosomes, or (3) high glucose increased lysosome activity. To test these possibilities, bafilomycin A1, a lysosomal inhibitor that can prevent fusion of lysosomes and autophagosomes and the degradation activity of lysosomes, was used. As indicated in Figure 3C,D, co-incubation of high glucose with bafilomycin A1 significantly enhanced the abundance of SQSTM1 but had no significant effect on the amount of LC3B-II when compared to bafilomycin A1 treatment alone. Moreover, the increase in bafilomycin A1-induced GFP-LC3B puncta was significantly lower after treatment with 30 mM glucose compared to treatment with 5.5 mM glucose (Figure 3E,F). These findings demonstrated that high glucose attenuated autophagy in endothelial cells via suppressing autophagosome formation. In an effort to explore the mechanism responsible for high glucose mediated autophagy inhibition, we first carried out glutathione S-transferase (GST) pull down assay to identify the interaction between CAV1 and LC3 homologs. Interestingly, purified GST-LC3B from bacteria could more efficiently pull down endogenous CAV1 from cell lysates than other LC3 homologs (Figure S1). Next, co-IP experiments confirmed an interaction between CAV1-CAVIN1 and LC3B and treatment with high glucose increased these interactions in a concentration-dependent manner (Figure 3G-I).
Figure 3.
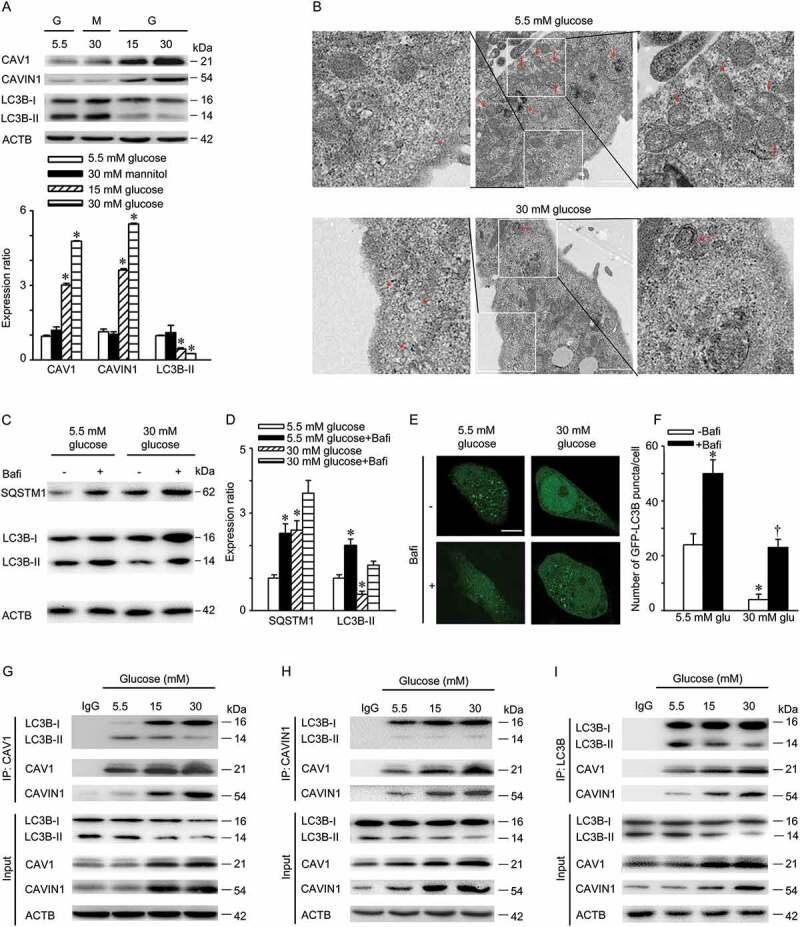
High glucose suppresses autophagy. (A) HUVECs were treated with indicated concentrations of glucose or mannitol for 24 h. CAV1, CAVIN1 and LC3B levels were analyzed by immunoblot, with ACTB as a loading control. G: glucose; M: mannitol. Representative western blotting analysis of the indicated proteins (upper panel) and summary bar graph showing the expression of the indicated proteins (lower panel). * p < 0.05 versus 5.5 mM glucose. (B) HUVECs were treated with indicated concentrations of glucose for 24 h, followed by electron transmission microscopy analysis. Representative images are shown. Asterisk, caveolae or caveolae cluster, arrow, autophagosomes or autolysosomes, Scale bar: 1 μm. (C-D) HUVECs were treated with indicated concentrations of glucose for 24 h, followed by treatment with bafilomycin A1 (100 nM, 2 h). LC3B and SQSTM1 levels were analyzed by immunoblot, with ACTB as a loading control. Representative western blotting analysis of the indicated proteins (C) and summary bar graph showing the expression of the indicated proteins (D). * p < 0.05 versus 5.5 mM glucose, † p < 0.05 versus 5.5 mM glucose +bafilomycin A1, (n = 4). (E-F) HUVECs were transfected with GFP-LC3B plasmids for 24 h, followed by 5.5 mM or 30 mM glucose treatment for 24 h in the presence or absence of bafilomycin A1 (100 nM, 2 h). GFP-LC3B puncta was visualized by confocal microscopy. (E) Representative fluorescent images are shown. Scale bars: 15 μm. (F) The number of GFP- LC3B puncta in each cell was quantified, and at least 50 cells were included per group. * p < 0.05 versus 5.5 mM glucose; † p < 0.05, versus 5.5 mM glucose+bafilomycin A1 (n = 3). (G-I) HUVECs were treated with indicated concentrations of glucose for 24 h. Whole-cell lysates from HUVECs immunoprecipitated with CAV1 antibody (H; IP: CAV1), CAVIN1 antibody (I; IP: CAVIN1), or LC3B antibody (J; IP: LC3B). Cellular ACTB from the same samples for IP served as a loading control (n = 3).
CAV1 and CAVIN1 silencing induces autophagy in endothelial cells
Given that a significant interaction between CAV1-CAVIN1 and LC3B was observed in our study, we thus are interested in understanding how CAV1-CAVIN1 modulates autophagy. We first measured the expression of LC3B after CAV1-CAVIN1 knockdown. As shown in Figure 4A,B, CAV1 knockdown significantly upregulated expression of LC3B-II, an autophagic marker, but suppressed the expression of autophagic substrate SQSTM1, suggesting that CAV1 negatively regulated autophagy. Consistent with previous studies [24–26], CAV1 knockdown in HUVECs led to a parallel change in CAVIN1 expression. Moreover, CAVIN1 knockdown resulted in a significant increase in LC3B-II level, as well as the decreased expression of the autophagy substrate SQSTM1, indicating that CAVIN1 negatively regulates autophagy (Figure 4C,D). Since LC3B-II is degraded by autophagy, the expression of LC3B-II alone at a given time point does not indicate an autophagic flux. Therefore, it is important to compare the differences in LC3B-II levels between samples in the presence and absence of lysosomal protease inhibitors [27]. As indicated in Figure 4E,F, the combination of CAV1 siRNA and bafilomycin A1 further increased the levels of LC3B-II when compared with bafilomycin A1 treatment alone, suggesting that CAV1 siRNA induced autophagy in HUVECs. Similarly, combining CAVIN1 siRNA with bafilomycin A1 significantly upregulated the levels of LC3B-II when compared with bafilomycin A1 treatment alone, indicating that CAVIN1 knockdown activated autophagy in HUVECs (Figure 4G,H). Subsequently, a tandem fluorescent-tagged GFP-RFP-LC3B construct was used to assess the roles of CAV1-CAVIN1 in autophagic flux. The GFP of this tandem autophagosome reporter is sensitive to pH and quenched in the acidic environment of the lysosome, whereas the RFP is resistant. Therefore, the fusion of autophagosomes with lysosomes results in the loss of yellow puncta and the appearance of red-only puncta. As shown in Figure 4I-J, similar to rapamycin treatment, CAV1 siRNA or CAVIN1 siRNA transfection increased the numbers of both yellow puncta and red-only puncta. Collectively, CAV1-CAVIN1 silencing activates autophagy in HUVECs.
Figure 4.
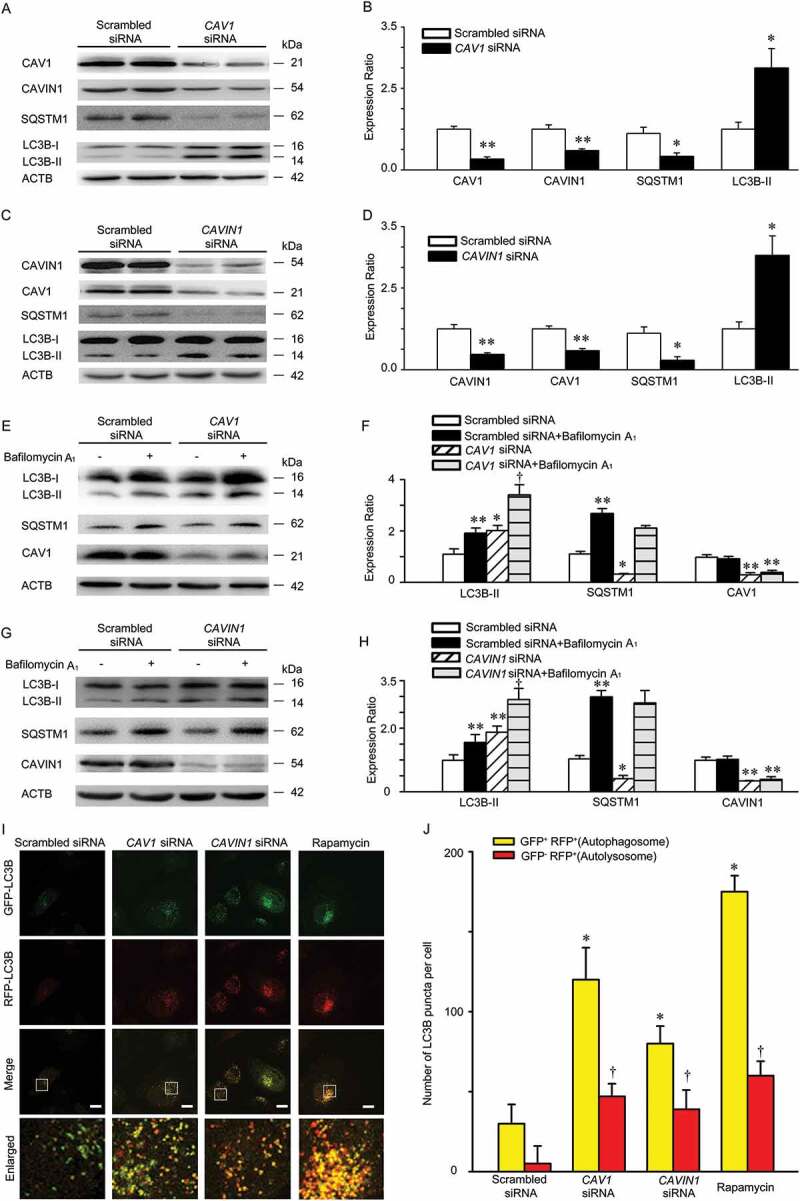
Knockdown of CAV1 and CAVIN1 activates autophagy. (A-D) HUVECs were transfected with scrambled siRNA (20 nM), CAV1 siRNA (20 nM), or CAVIN1 siRNA (20 nM) for 72 h. CAV1, CAVIN1, LC3B or SQSTM1 levels were analyzed by immunoblot analysis, with ACTB as a loading control. Representative western blotting analysis of the indicated proteins (A, C) and summary bar graph showing the expression of these indicated proteins (B, D). * p < 0.05 or ** p < 0.01 versus scrambled siRNA (n = 4). (E-H) HUVECs were transfected with scrambled siRNA (20 nM), CAV1 siRNA (20 nM), or CAVIN1 siRNA (20 nM) for 72 h and exposed to bafilomycin A1 (100 nM, 2 h). CAV1, CAVIN1, LC3B, or SQSTM1 levels were analyzed by immunoblot, with ACTB as a loading control. Representative western blotting of the indicated proteins (E, G) and summary bar graph showing the expression of these indicated proteins (F, H). * p < 0.05 or ** p < 0.01 versus scrambled siRNA, † p < 0.05 versus scrambled siRNA+ bafilomycin A1, (n = 3). (I-J) HUVECs infected with GFP-RFP-LC3 lentivirus and subsequently subjected to CAV1 or CAVIN1 siRNA transfection for 72 h, or treated with rapamycin (5 nM) for 24 h, and then observed for the change of both green and red fluorescence using confocal microscope. (I) Representative fluorescent images are shown. Scale bar: 15 μm. (J) The number of yellow or red-only LC3B puncta in each HUVECs in merged images was quantified respectively, and at least 50 cells were included per group. * p < 0.05 versus yellow puncta in scrambled siRNA group; † p < 0.05, versus red-only puncta in scrambled siRNA group (n = 3).
LC3 associates with CAV1 scaffolding domain and intramembrane domain
Next, we attempt to clarify how CAV1-CAVIN1 interacts with LC3B leading to autophagy inhibition. When CAV1 exists as a structural protein in membrane caveolae or caveosomes, CAVIN1 associates with the N-terminal of CAV1 to make it more stable [9,16,28]. Signaling proteins directly associate with CSD in CAV1 via a signature peptide sequence, named the CAV1 binding motif (CBM) [29,30]. Additionally, most protein directly binds to LC3 via an LC3-interacting region (LIR) [31]. Therefore, we carefully blasted the amino acids sequence of CAV1-CAVIN1, LC3B, and found that CAVIN1 had no LIR, while CAV1 contained 2 LIRs in CSD and 2 LIRs in IMD (Figure 5A). We also found there was a CBM domain in LC3B (Figure 5A). Based on the above, we synthesized several fusion peptides containing a putative CSD sequence or a putative IMD sequence with transcriptional activator protein (TAT) at the N-terminus. The peptides including TAT, TAT-CSD and TAT-IMD were all cell-permeable and biotinylated at the C-terminus. Biotinylated TAT was used as a negative control. As shown in Figure 5B,C, TAT-CSD reduced GFP-LC3B puncta in the presence or absence of bafilomycin A1, whereas TAT-IMD increased GFP-LC3B puncta. Moreover, TAT-CSD bound to LC3B, and subsequently inhibited LC3B conversion from LC3B-I to LC3B-II. TAT-CSD increased the expression of SQSTM1, suggesting autophagy inhibition (Figure 5D). Alternatively, TAT-IMD interacted with LC3B, subsequently promoted LC3B conversion from LC3B-I to LC3B-II and reduced the expression of SQSTM1, suggesting autophagy activation (Figure 5D). Since it is difficult to perform a reverse immunoprecipitation in our model, ELISA was used to determine the peptides-proteins interaction. Previous studies indicated that endothelial nitric oxide synthase (eNOS) is thought to be associated with CSD not IMD [32,33], which was consistent with our observations (Figure 5E). Compared with TAT, LC3B interacted with both TAT-CSD and TAT-IMD (Figure 5E), which was consistent with the immunoprecipitation results (Figure 5D). Moreover, these results suggested that CAV1 associated with LC3B via CSD to inhibit autophagy in the cell membrane, whereas when associated with LC3B via IMD, autophagy in the cytoplasm was increased. Next, we further assessed the interaction between TAT-CSD or TAT-IMD and LC3B upon high glucose treatment. The combination of TAT-CSD and high glucose treatment enhanced the interaction between TAT-CSD and LC3B, which aggravated autophagy inhibition illustrated by diminished appearance of GFP-LC3B puncta (Figure 5F,G), as well as attenuated expression of LC3B-II (Figure 5H). Interestingly, simultaneous treatment with TAT-IMD and high glucose disrupted the interaction between TAT-IMD and LC3B, which also leads to autophagy suppression (Figure 5H-I). Taken together, these findings demonstrated that CSD and IMD may have opposite effects on autophagy.
Figure 5.

LC3 associates with CAV1 scaffolding domain and intramembrane domain. (A) Schematic illustration showing the putative domain of CAV1 that interacts with LC3B. CBM: CAV1 binding motif. (B, C) HUVECs were transfected with GFP-LC3B plasmids for 24 h and incubated with the indicated peptides (20 µM, 4 h) in the presence or absence of bafilomycin A1 (100 nM) for 2 h and then visualized by confocal microscopy. (B) Representative images are shown. Scale bars: 15 μm. (C) The number of GFP- LC3B puncta in each cell was quantified, and at least 50 cells were included per group. * p < 0.05 versus vehicle; † p < 0.05, versus bafilomycin A1 (n = 3). (D) HUVECs were incubated with biotinylated peptides including TAT, TAT-CSD, or TAT-IMD for 4 h (20 µM). The cell lysates were immunoprecipitated with LC3B antibody. Biotinylated peptides from the precipitated complexes were separated on Tricine-SDS-PAGE gel and immunoblotted with HRP-conjugated streptavidin. (E) HUVECs were treated as mentioned above and cell lysates were used to determine peptide – protein interactions using an ELISA-based assay. ** p < 0.05, * p < 0.05 versus TAT; n = 3. (F, G) HUVECs were transfected with GFP-LC3B plasmids for 24 h and exposed to 30 mM glucose treatment, followed by incubating with the indicated peptides (20 µM, 4 h). Subsequently, cells were subjected to confocal microscopy analysis. (F) Representative fluorescent images were shown; glu: glucose. Scale bars: 15 μm. (G) The number of GFP- LC3B puncta in each cell was quantified, and at least 50 cells were included per group. * p < 0.05 versus 5.5 mM glucose; † p < 0.05, versus CSD+5.5 mM glucose; # p < 0.05 versus IMD+5.5 mM glucose (n = 3). (H-I) HUVECs were treated with high glucose (30 mM, 24 h), followed by incubation with the biotinylated peptides including TAT, TAT-CSD, or TAT-IMD for 4 h (20 µM). (H) Cell lysates were immunoprecipitated with LC3B antibody. Biotinylated peptides from precipitated complexes were separated on Tricine-SDS-PAGE gel and immunoblotted with HRP-conjugated streptavidin. (I) HUVECs were treated as mentioned above. Cell lysates were used to determine peptide – protein interactions by an ELISA-based assay. ** p < 0.01,* p < 0.05 versus TAT; † p < 0.05, versus TAT+30 mM glucose; (n = 3).
LC3B interacts with the CSD in CAV1 to inhibit autophagy but interacts with the IMD in CAV1 to activate autophagy
To further demonstrate that LC3B associates with the CSD in CAV1 leading to autophagy inhibition and interacts with the IMD in CAV1 to induce autophagy, we generated a series of mutations including CAV1 mutants carrying a defective LIRs in the CSD, IMD or both, namely LIRs−/-(CSD), LIRs−/-(IMD) and LIRs−/-, respectively (Figure 6A). As illustrated in Figure 6B-F and Figure S2, LIRs−/-(CSD) was co-immunoprecipitated with LC3B, accompanied by significantly increased autophagy, illustrated by increased numbers of GFP-LC3B puncta (Figure 6B, Figure S2A) and elevated LC3B-II expression as well as a reduction in SQSTM1 level (Figure 6C-D and Figure S2B). Conversely, LIRs−/-(IMD) also interacts with LC3B (Figure 6E,F, Figure S2C and Figure S2D), followed by autophagy suppression (Figure 6B-D and Figure S2A-2B). In addition, high glucose treatment disrupted the interaction between LIRs−/-(IMD) and LC3B, whereas enhanced the interaction between the LIRs−/-(CSD) and LC3B, which ultimately aggravated autophagy inhibition (Figure 6B-F). Moreover, immuno-electron microscopy analysis showed that CAV1 and CAV1 mutants carrying a defective LIRs in CSD (LIRs−/- in CSD), both containing the LIRs in IMD, were present on autolysosomes, whereas CAV1 mutants with a deletion of LIRs in IMD (LIRs−/- in IMD) were absent (Figure 6G). These data demonstrated that LC3B associates with the CSD in CAV1 leading to autophagy suppression, while interacts with the IMD in CAV1 to induce autophagy. In an effort to further explore whether CAV1 binds to the CBM in LC3B, plasmids encoding LC3B and LC3B mutants carrying a defective CBM (CBM−/-) (Figure S3A) were transfected into HUVECs. In our experiment, LC3-CBM−/- can target to autophagosomes (Figure S4). Deletion of CBM partly disrupted the interaction between LC3B and CAV1 and promoted autophagy (Figure S3B-3E). Moreover, CBM−/- blocked high glucose-mediated autophagy inhibition. These observations illustrated that CAV1 interacts with the CBM in LC3B to inhibit autophagy. Taken together, the CSD in CAV1 binds to the CBM in LC3B and suppresses autophagy, while the IMD in CAV1 interacts with LC3B and stimulates autophagy.
Figure 6.
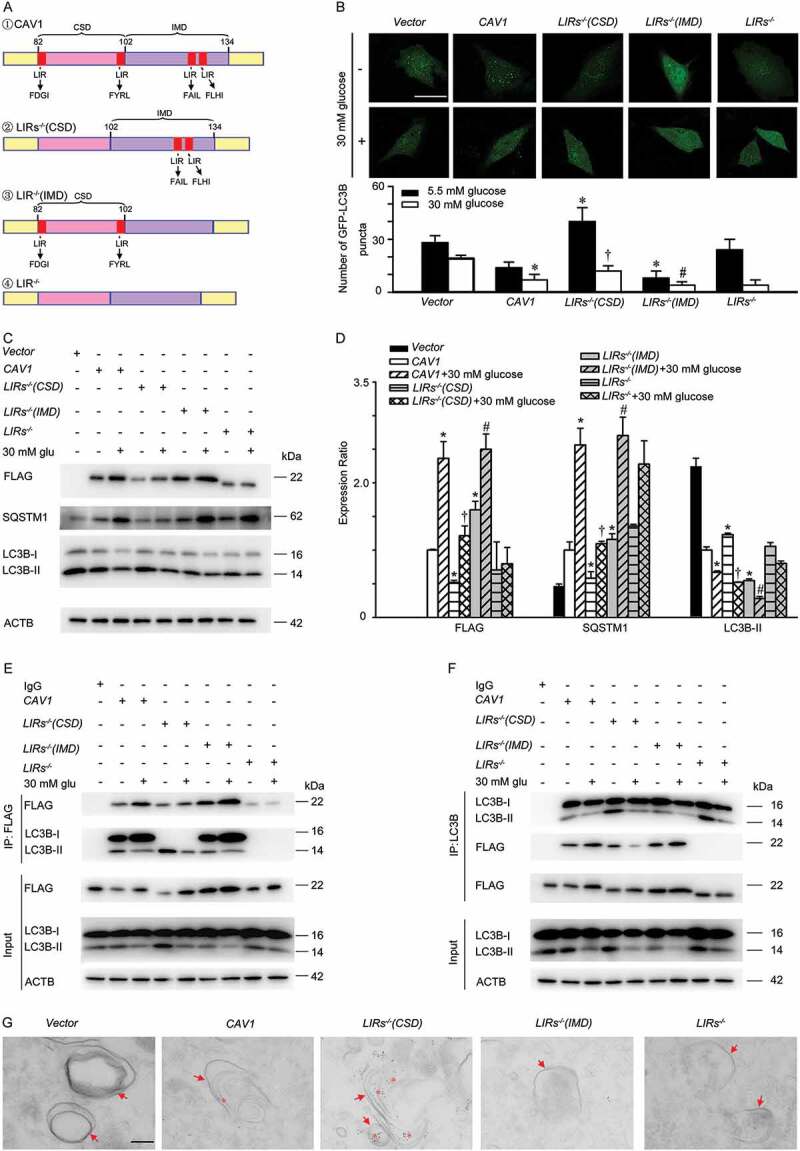
LC3B interacts with the CSD in CAV1 to inhibit autophagy, but interacts with the IMD in CAV1 to activate autophagy. (A) Schematic representation of the plasmids carrying Flag-CAV1 or Flag-CAV1 mutants, CAV1: CAV1 wild type; LIRs−/-(CSD): CAV1 mutant carrying the defective LIRs in the CSD; LIRs−/-(IMD): CAV1 mutant carrying the defective LIRs in the IMD; LIRs−/-: CAV1 mutant carrying the defective LIRs in both the CSD and IMD. (B) HUVECs were transfected with plasmids encoding Flag-CAV1 wild type (0.4 μg) or Flag-CAV1 mutants (0.4 μg) respectively, and co-transfected with GFP-LC3B plasmids for 24 h, followed by 30 mM glucose (glu) treatment for 24 h. GFP-LC3B puncta was visualized by confocal microscopy. Representative fluorescent images are shown (upper panel). Scale bars: 15 μm. The number of GFP- LC3B puncta in each cell was quantified, and at least 50 cells were included for each group (lower panel). * p < 0.05 versus CAV1 + 5.5 mM glucose; † p < 0.05 versus LIRs−/- (CSD) + 5.5 mM glucose; # p < 0.05 versus LIRs−/- (IMD) + 5.5 mM glucose (n = 3). (C-F) HUVECs were transfected with plasmids encoding Flag-CAV1 wild type (0.4 μg) or Flag-CAV1 mutant (0.4 μg) for 24 h, and treated with high glucose (30 mM, 24 h). Whole-cell lysates from HUVECs were subjected to immunoblot analysis to determine Flag-CAV1, LC3B, and SQSTM1 levels. glu: glucose Representative western blotting analysis of the indicated proteins (C) and summary bar graph showing the expression of the indicated proteins (D). n = 3. * p < 0.05 versus CAV1; † p < 0.05 versus LIRs−/- (CSD); # p < 0.05 versus LIRs−/- (IMD). (E-F) Whole-cell lysates from HUVECs treated as above mentioned, and then immunoprecipitated with Flag antibody (E; IP: Flag) or LC3B antibody (F; IP: LC3B). Cellular ACTB derived from the same samples for IP experiments served as a loading control. glu: glucose. (G) HUVECs were transfected with plasmids encoding, vector or GFP-CAV1 (0.4 μg) or GFP-CAV1 mutants (0.4 μg) respectively, and then were analyzed by immuno-electron microscopy using primary antibody against GFP and 4 nm colloidal gold affinipure goat anti-mouse IgG as secondary antibody. Arrow, autophagosomes or autolysosomes; Asterisk, 4 nm colloidal gold in autophagosomes or autolysosomes; scale bar: 200 nm.
Autophagy modulates the stability of CAV1
As stated above, CAV1 is present on autolysosomes. We speculated that CAV1 may be an autophagic substrate. Therefore, we explored whether autophagy affects the CAV1 stabilization. Time-course analysis revealed that 3-MA, a tool drug to prevent autophagosome formation (Figure 7F,H), extended the half-life of endogenous CAV1 from 7.4 h to 8.4 h (Figure 7A,B). In addition, ATG5 siRNA transfection, which specifically suppressed the expression of ATG5 to inhibit autophagosome formation (Figure 7G,I), extended the half-life of endogenous CAV1 from 7.1 h to 14.9 h (Figure 7D,E). Furthermore, bafilomycin A1 was used to block the degradation of autophagic cargo by the lysosome, and extended the half-life of endogenous CAV1 from 7.4 h to 16.3 h (Figure 7A,B). Inversely, activation of autophagy by rapamycin treatment shortened the half-life of endogenous CAV1 from 7.4 h to 4.9 h. However, proteome inhibitors (MG-132) and pan–caspase inhibitor (Z-VAD-FMK) did not significantly change the half-life of CAV1 (Figure 7A,C). Collectively, CAV1 is degraded by autophagy.
Figure 7.
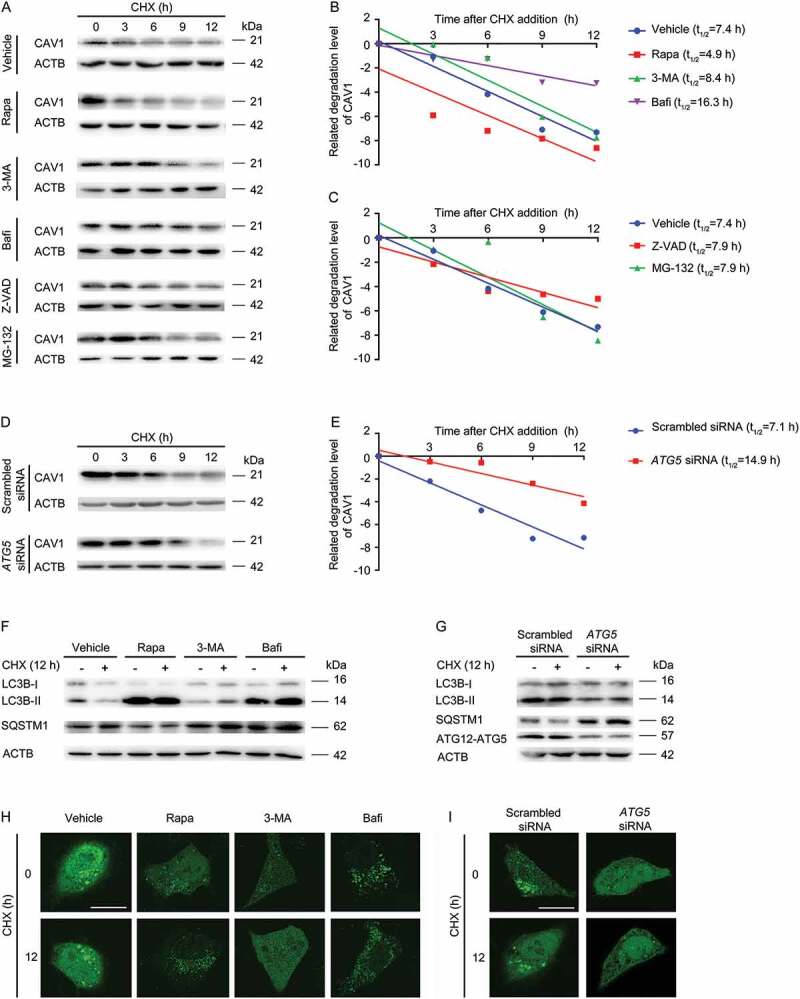
Quantification of CAV1 stability assays. (A-C) HUVECs were pre-treated with Rapa (rapamycin, 1 μM, 1 h), 3-MA (20 mM,1 h), Bafi (bafilomycin A1, 1 μM, 1 h), Z-VAD (Z-VAD-FMK, 20 μM, 1 h) or MG-132 (20 μM, 1 h), followed by co-incubation with Cycloheximide (CHX, 10 μM) at indicated time points. (A) The expression of specific proteins was analyzed by immunoblotting assay. (B, C) The CAV1 band density was normalized to ACTB, and then normalized to t = 0 controls. (D-E) HUVECs were transfected with scrambled siRNA (20 nM, 48 h) or ATG5 siRNA (20 nM, 48 h), and incubated with CHX (10 μM) at indicated time points. (D) The expression of specific proteins was analyzed by immunoblotting assay. (E) Density of CAV1 bands was normalized to ACTB and then normalized to t = 0 controls. (F) HUVECs were pre-treated with rapamycin (1 μM, 1 h), 3-MA (20 mM, 1 h), bafilomycin A1 (1 μM, 1 h), followed by co-incubation with CHX (10 μM, 12 h). The expression of indicated proteins was analyzed by immunoblotting assay. (G) HUVECs were transfected with scrambled siRNA (20 nM, 48 h) or ATG5 siRNA (20 nM, 48 h), and incubated with CHX (10 μM) at indicated time points. The expression of specific proteins was analyzed by immunoblotting assay. (H) HUVECs were transfected with GFP-LC3B, followed by pre-treatment with Rapa (rapamycin, 1 μM, 1 h), 3-MA (20 mM,1 h), Bafi (bafilomycin A1, 1 μM, 1 h), and co-incubated with CHX (10 μM,12 h). GFP-LC3B puncta was visualized by confocal microscopy. Representative images are shown. Scale bars: 15 μm. (I) HUVECs were transfected with GFP-LC3B, then transfected with scrambled siRNA (20 nM, 48 h) or ATG5 siRNA (20 nM, 48 h), and incubated with CHX (10 μM, 12 h). GFP-LC3B puncta was visualized by confocal microscopy. Representative images are shown. Scale bars: 15 μm.
CAVIN1 knockdown promotes autophagic degradation of CAV1
Next, we evaluated whether activation of CAVIN1 knockdown-induced autophagy is sufficient to trigger autophagic degradation of CAV1, when CAV1 loss stability in membrane to expose its IMD. In brief, HUVECs were transfected with CAVIN1 siRNA, and then ATG5 siRNA was subsequently transfected. As shown in Figure 8A,B, CAVIN1 siRNA induced CAV1 downregulation, concomitant with autophagy activation. ATG5 siRNA transfection inhibited CAVIN1 siRNA-induced autophagy activation and reversed CAV1 downregulation caused by CAVIN1 siRNA. Subsequently, dual treatment with CAVIN1 siRNA and bafilomycin A1, which inhibits the fusion of lysosomes and autophagosomes to block autophagic degradation, resulted in a significant increase in CAV1 levels (Figure 8C,D). CAVIN1 knockdown caused loss of GFP-CAV1 in the plasma membrane and accumulation of GFP-CAV1 in acidic, LysoTracker-positive organelles (Figure 8E,F). These data demonstrate CAVIN1 silencing impairs the stability of CAV1 at the cell membrane, and CAV1 subsequently translocate to the cytoplasm for autophagic degradation.
Figure 8.
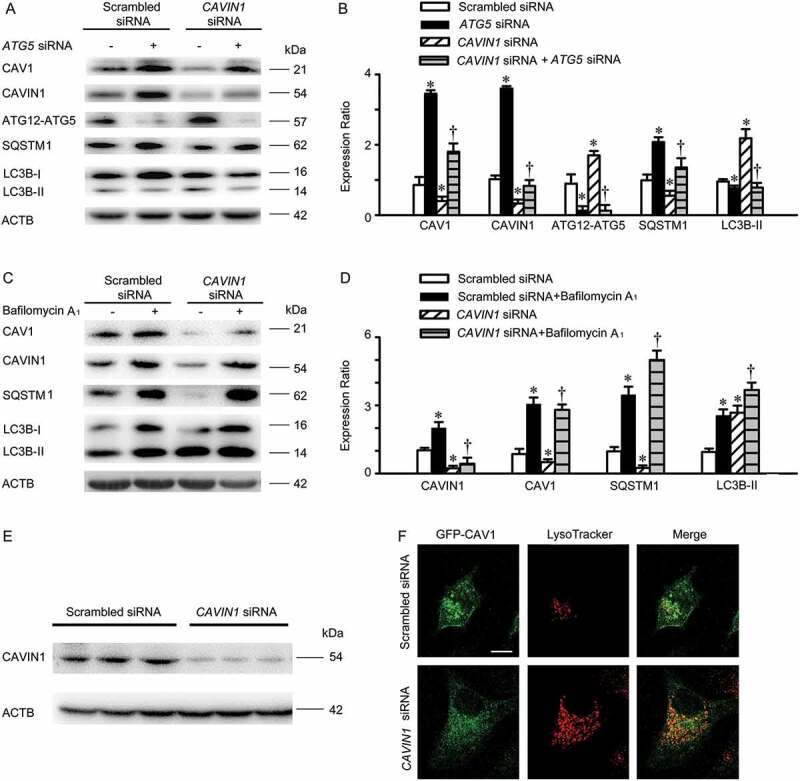
CAVIN1 knockdown promotes autophagic degradation of CAV1. (A, B) HUVECs were transfected with CAVIN1 siRNA (20 nM) or scrambled siRNA (20 nM) for 24 h, followed by transfection with ATG5 siRNA (20 nM) or scrambled siRNA (20 nM) for another 24 h. (C-D) HUVECs were transfected with CAVIN1 siRNA or scrambled siRNA for 24 h, followed by treatment with bafilomycin A1 (100 nM, 24 h). The expression of specific proteins was analyzed by immunoblotting assay. Representative western blotting of the indicated proteins (A, C) and summary bar graph showing the expression of the indicated proteins (B, D). * p < 0.05 versus scrambled siRNA; † p < 0.05 versus CAVIN1 siRNA (n = 3). (E-F) HUVECs were transfected with GFP-CAV1 plasmids for 24 h, and then transfected with scrambled siRNA (20 nM) or CAVIN1 siRNA (20 nM) for 48 h, followed by LysoTracker treatment (100 nM, 1 h). Blots images (E) and fluorescent images (F) are representative of at least 3 independent experiments. Scale bars: 15 μm.
High glucose suppresses autophagic degradation of CAV1
As stated above, high glucose facilitates the expression of CAV1, leading to an increased interaction between CAV1-CAVIN1 and LC3B. Meanwhile, CAV1 is degraded by autophagy. Thus, we speculate that high glucose is able to cause CAV1 accumulation by suppressing autophagy and increases interaction between CAV1-CAVIN1 and LC3B and further aggravates autophagy suppression, which forms a type of feedback forward loop. At first, the AMPK-MTOR-PIK3C3 pathway, a classic signaling pathway for initiating autophagosome formation, was studied [34–36]. As indicated in Figure S5, on high glucose stimuli, the expression of Thr172 phosphorylation of AMPK (illustrating the activation of AMPK) and PIK3C3 were markedly attenuated, whereas the ser 2448 phosphorylation of MTOR (indicating the activating of MTOR) was promoted, accompanied by autophagy inhibition. Nevertheless, the upregulated expression of CAV1-CAVIN1 and downregulated autophagy was significantly restored by 5-aminoimidazole-4-carboxamide-1-β-d-ribofuranoside (AICAR, an AMPK activator) in high-glucose-treated cells. Similarly, MTOR siRNA markedly attenuated high-glucose-inhibited autophagy and increased CAV1-CAVIN1 expression (Figure S5). Therefore, high glucose suppressed autophagic degradation of CAV1 via AMPK-MTOR-PIK3C3 pathway, which increased the stability of CAVIN1. Subsequently, we further examined whether the increased expression of CAV1 or CAVIN1 participated in high glucose-suppressed autophagy. We monitored autophagic alteration by analyzing the abundance of LC3B-II and autophagic substrate SQSTM1. As shown in Figure 9A-D, treatment with high glucose decreased the level of LC3B-II protein and increased the level of SQSTM1, which was restored by CAV1 or CAVIN1 knockdown in HUVECs. To monitor autophagosome formation, plasmids encoding the GFP-LC3B fusion protein were utilized. As expected, treatment of HUVECs with high glucose decreased the appearance of GFP-LC3B puncta, which could be prevented by CAV1 or CAVIN1 knockdown (Figure 9E-H). Furthermore, transmission electron microscopy analysis revealed that CAV1 or CAVIN1 knockdown prevented the high-glucose-mediated autophagic vacuole decreasing in the cytoplasm (Figure 9I). Moreover, the upregulation of caveolae mediated by high glucose was restored by CAV1 or CAVIN1 knockdown (Figure S6). Collectively, these data clearly demonstrated high glucose suppresses autophagic degradation of CAV1 via AMPK-MTOR-PIK3C3 pathway. Over-expression of CAV1 lead to an increased expression of CAVIN1, which was consistent with previous study [37,38].
Figure 9.
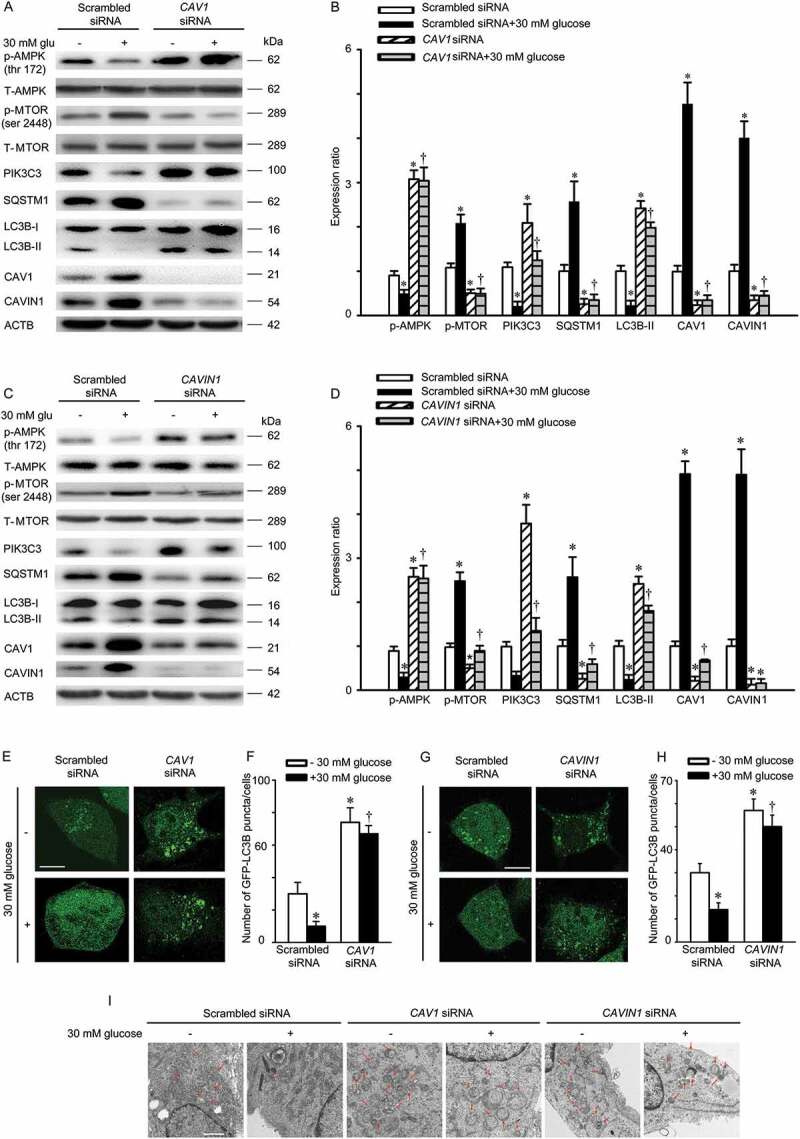
High glucose suppresses autophagic degradation of CAV1. (A-D) HUVECs were transfected with scrambled siRNA (20 nM), CAV1 siRNA (20 nM), or CAVIN1 siRNA (20 nM) for 72 h and exposed to high glucose (glu, 30 mM, 24 h). CAV1, CAVIN1, LC3B, SQSTM1, p-AMPK, T-AMPK, p-MTOR, T-MTOR or PIK3C3 levels were analyzed by immunoblot, with ACTB as a loading control. Representative western blotting of the indicated proteins (A, C) and summary bar graph showing the expression of the indicated proteins (B, D) * p < 0.05 versus scrambled siRNA; † p < 0.05, versus scrambled siRNA+ 30 mM glucose (n = 3). (E-H) HUVECs were transfected with GFP-LC3B for 24 h, followed by scrambled siRNA (20 nM), CAV1 siRNA (20 nM), or CAVIN1 siRNA (20 nM) transfection for 48 h and treated with high glucose (glu, 30 mM, 24 h). GFP-LC3B puncta was visualized by confocal microscopy. (E, G) Representative fluorescence images are shown. Scale bar: 15 μm. (F, H) The number of GFP-LC3B puncta in each cell was quantified, and at least 50 cells were included per group. * p < 0.05 versus scrambled siRNA; † p < 0.05, versus scrambled siRNA + 30 mM glucose (n = 3). (I) HUVECs were transfected with scrambled siRNA (20 nM), CAVIN1 siRNA (20 nM), or CAV1 siRNA (20 nM) for 48 h, exposed to high glucose (30 mM, 24 h), and imaged by transmission electron microscopy. Representative images are shown. Arrow, autophagosomes or autolysosomes, Scale bar: 1 μm.
CAV1 mutant with a deletion of LIRs in IMD accumulated in the cytosol and facilitates LDL transcytosis
As indicated in Figure S7, CAV1 mutants with a deletion of LIRs in the IMD (LIRs−/- [IMD]) was accumulated in both cytosol and membrane, which has been proved to inhibit autophagic degradation of CAV1 and thus promotes LDL transcytosis. Conversely, CAV1 mutants carrying a defective LIRs in the CSD (LIRs−/-[CSD]) resulted in increased autophagic degradation of CAV1 thus suppressed the expression of CAV1 in both cytosol and membrane and downregulated LDL transcytosis (Figure S7).
Discussion
In the present study, for the first time we demonstrated that high glucose could stimulate LDL transcytosis through suppression of autophagy in human endothelial cells. Since CAV1 undergoes autophagic degradation, the suppression of autophagy results in increased CAV1 expression and caveolae formation, which further facilitates LDL transcytosis.
Data from human and animal studies have supported a pro-atherosclerotic role of high glucose [39,40]. Retention of LDL particles into the subendothelial space is the initial step of atherosclerosis [13,14]. Autophagy is an emerging therapeutic target for preventing the development of atherosclerosis. Thus, targeting the crossed pathway mediated autophagy inhibition and enhanced LDL transcytosis is a promising anti-atherosclerotic strategy. Consistent with previous observations [21,41–43], we found high glucose (15 mM or 30 mM) decreased the expression of LC3B-II and GFP-LC3B puncta as well as autophagic vacuoles in the cytosol of HUVECs. Subsequent experiments demonstrated that the apparent decrease of GFP-LC3B puncta and LC3B-II [22,44] was not due to augmented lysosomal degradation. These findings confirmed the suppressing effects on autophagy by high glucose. Meanwhile, the increased interaction between CAV1-CAVIN1 and LC3B was observed upon high glucose stimulation.
The interaction between CAV1 and LC3B has been reported previously, but whether this interaction activates or inhibits autophagy is not known. Previous studies have shown intervention of autophagy can affect the interaction between LC3B and CAV1 in caveolae [45–48]. A recent study showed that rapamycin attenuated the expression of CAV1 in liver sinusoidal endothelial cells, while 3-MA stimulated the amount of CAV1, implying CAV1 may be degraded through autophagy [49]. Therefore, we further designed experiments to explore the molecular mechanism of LC3B binding to CAV1 to inhibit or activate autophagy.
The human protein CAV1 contains 170 amino acids, including CSD and IMD. To understand the roles of these domains in autophagy, TAT-CSD-biotin peptide or TAT-IMD-biotin peptide were introduced into endothelial cells. We observed that the TAT-CSD-biotin peptide interacted with LC3B, accompanied by autophagy inhibition. However, the TAT-IMD-biotin peptide associated with LC3B, accompanied by autophagy activation. High glucose disrupted the interaction between TAT-IMD-biotin peptides and LC3B, subsequently more LC3B is conjugated to TAT-CSD-biotin peptide, leading to autophagy inhibition. These data suggest that CAV1 plays bidirectional roles in autophagy regulation through these distinct domains.
Since most LC3-interacting proteins contain typical LC3-interacting regions (LIR) motif. Specifically, an aromatic amino acid (Trp, Tyr, or Phe) is followed by t2wo undefined amino acids and a hydrophobic residue (Leu or Ile), e.g. Trp-Xaa-Xaa-Leu (where Xaa represents any amino acid) in SQSTM1. CAV1 also has 2 types of LIRs, including CSD and IMD. Thus, we designed 4 plasmids including wild type CAV1 and 3 mutants of CAV1, LIRs−/-(CSD), LIRs−/-(IMD), LIRs−/-. Treatment with high glucose enhanced the interaction between the LIRs in CSD of CAV1 and LC3B and suppressed autophagy. However, high glucose interrupted the interaction between the LIRs in IMD of CAV1 and LC3B, which also suppressed autophagy. Meanwhile, we also demonstrate that CAV1 mutant with deletion of LIR in IMD, LIRs−/-(IMD), is accumulated in the cytosol and facilitates the LDL transcytosis across endothelial cells. Importantly, except for CAV1 mutants without LIRs in IMD, both wild type CAV1 and CAV1 mutant LIRs−/-(CSD), which contain LIRs in IMD, were present on autolysosomes under electron microscopy. These findings suggest that the CSD in CAV1 interacts with LC3 to inhibit autophagy, but the IMD of CAV1 interacts with LC3 to activate autophagy. Previous studies have demonstrated that the CSD in CAV1 directly associated with the CBM in signaling protein to repress signaling transduction at cell membrane [30]. In present study, the deletion of CBM in LC3B (CBM−/-) remarkably impaired the interaction between LC3 and CAV1 at cell membrane, indicating that CAV1 can trap LC3B to cell membrane via CBM (Figure S8). Importantly, CBM−/- partially disrupted the association between exogenous LC3B and CAV1, and reversed high glucose-mediated autophagy inhibition, which further indicated that the CSD in CAV1 interacts with the CBM of LC3B to impair autophagy at cell membrane. Whereas, the IMD of CAV1 binds LC3B not via CBM, which could activate autophagy, possibly due to IMD of CAV1 as a type of cargo receptor for autophagic degradation. Because endogenous CAV1 primarily exists as a structural protein in membrane caveolae or caveosomes, LIRs in the IMD were buried and not accessible by LC3B, therefore CAV1 primarily exhibits inhibitory effects on autophagy.
Since CAV1 is present on autolysosomes, CAV1 in the cytoplasm may be degraded via autophagy as a type of cargo receptor. In the present study, we observed that autophagic degradation of CAV1 is increased after CAVIN1 is silenced. We speculated that, CAV1 would translocate to cytosol due to the loss of CAVIN1, and that LIRs in the IMD can be exposed, which are consequently degraded by autophagy. Importantly, time-course analysis revealed that autophagy activation significantly decreased the stability of endogenous CAV1, whereas autophagy inhibition markedly increased the stability of endogenous CAV1. We speculate that CAV1 in membrane structures (caveolae or caveosome), recruited LC3 via CSD and subsequently inhibited autophagy. However, CAVIN1 deficiency promoted CAV1 translocation into the cytoplasm and exposed its IMD, which could bind with LC3B, thereby activating autophagy.
Previous study identified that high glucose suppressed autophagy via AMPK-MTOR pathway [50,51]. Moreover, the activation of AMPK inhibits MTOR. Consequently, ULK1 and BECN1–PIK3C3 complexes are activated and autophagy is activated. Independent of MTORC1 inhibition, AMPK also directly phosphorylates ULK1 and BECN1 [35], which upregulates PIK3C3 activity. In accordance with previous studies, we also illustrated high glucose suppressed autophagy via inhibition of AMPK-MTOR-PIK3C3 pathway. Meanwhile, activation of AMPK-MTOR-PIK3C3 pathway-induced autophagy by AICAR or MTOR siRNA prevented the increased expression of CAV1-CAVIN1 by high glucose. Previous and present study also illustrated that the expression of CAV1 and CAVIN1 are closely correlated. Over-expression of CAV1 led to upregulation of CAVIN1 and decrease of CAV1 led to downregulation of CAVIN1 [17,52]. By suppressing autophagic degradation, high glucose promotes CAV1 accumulation, which further increased the expression of CAVIN1.
In conclusion, the present study for the first time demonstrates the promoting effects of high glucose on LDL transcytosis in human endothelial cells and hence increases the subendothelial retention of atherogenic lipids. The detailed molecular mechanisms are summarized in Figure 10. CAV1 has 2 types of LIRs, CSD and IMD. CAV1 can bind with CAVIN1-LC3B and form a complex. Since CAVIN1 has no LIR and CAV1 has more than 2 LIRs, we speculate that CAV1, as an intermediate linker between CAVIN1 and LC3B could mediate autophagy inhibition. When CAV1 exists as a structural protein in membrane caveolae or caveosomes to mediate LDL transcytosis, the LIRs in IMD were buried and CAV1 can only exhibit inhibitory action on autophagy via CSD. When CAV1 is present in the cytosol, the IMD of CAV1 is accessible and may have the chance to bind with LC3B and mediate the autophagic degradation of CAV1. Under normal glucose circumstance, the autophagic degradation of CAV1 in cytosol and utilization of CAV1 to form membrane caveolae is maintained at a sort of homeostasis and the formation of caveolae in the endothelial cell membrane is relatively fewer, therefore the transcytosis of LDL by endocytosed caveolae is also maintained at a relatively lower level. By inhibiting AMPK-MTOR-PIK3C3 pathway, high glucose suppresses the CAV1-CAVIN1-LC3B -mediated autophagic degradation of CAV1. As a result, more CAV1 is accumulated in the cytosol and can be utilized to form more caveolae in the cell membrane and facilitates LDL transcytosis across endothelial cells, consequently promoting the subendothelial retention of atherogenic lipids.
Figure 10.
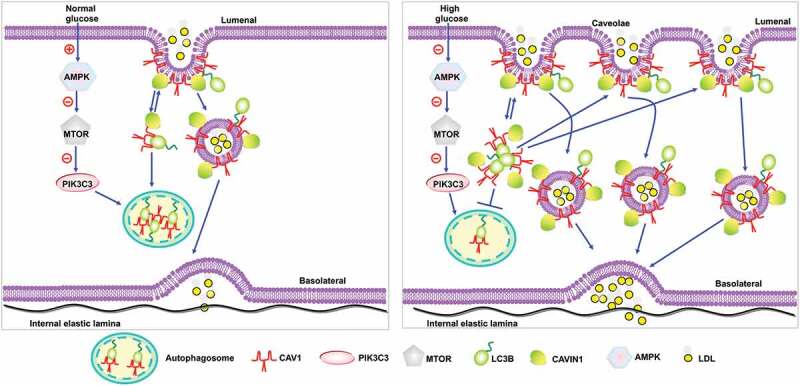
Proposed model of autophagy to regulate high glucose-stimulated LDL transcytosis.
Materials and methods
Patients
Women with and without GDM are included in this study, and characteristic are shown in Table S1. Exclusion criteria were patients with hyperlipidemia, hypertension, diagnosed with cancer, severe kidney or liver failure, and patients who were treated for a chronic disease. The collection of human umbilical cords was approved by the Ethics Committee of Tongji Medical College, Huazhong University of Science and Technology (Wuhan, China) and was conducted in accordance with the Declaration of Helsinki (2008) and all applicable national and local regulations. All women provided written informed consent prior to sample collection. Umbilical cords were collected at the time of childbirth. The umbilical vein was washed 3 times with PBS (Thermo Fisher Scientific, 10010031) to remove any remaining blood and rings of umbilical vein were used for histological analysis.
Primary cultures of human umbilical vein endothelial cells
HUVECs were isolated as previously described [53]. Cells were routinely cultured in endothelial cell medium (ScienCell, 1001), containing 5% fetal bovine serum (ScienCell, 2500), 100 U·mL−1 penicillin, 100 U·mL−1 streptomycin (ScienCell, 0503) and 30 μg·mL−1 endothelial cell growth supplement (ScienCell, 1052) at 37°C in an incubator with a humidified atmosphere of 5% CO2. Cells were used at passages 2–7.
Histological analysis of human umbilical cords
Human umbilical cords were fixed with 4% paraformaldehyde for 24 h at room temperature, dehydrated in 30% sucrose solution and stained with Oil Red O (Servicebio, G1016). Oil Red O-positive staining was calculated using Image-pro plus 6.0. For immunohistochemical analysis, primary antibodies were used at 1:1000 dilutions: anti-LC3B (Cell Signaling Technology, 3868) anti-CAV1 (Cell Signaling Technology, 3267) and anti-CAVIN1 antibody (Proteintech, 18892–1-AP). After primary antibody incubation, specimens were incubated with species-appropriate horse-radish peroxidase-conjugated secondary antibodies (Absin, abs20002C), followed by 60 min of reactive avidin–biotin complex (Roche Diagnostics GmbM, 11664778001).
LDL uptake in HUVECs
FITC-LDL was prepared as previously described [13]. In brief, HUVECs were seeded in 12-well plates (Roche Diagnostics Corporation, 3513) and were incubated with serum-free Opti-MEM (Gibco, 31985–070), containing FITC-LDL (50 μg/mL) for 24 h. Cells were harvested using 0.125% trypsin (without EDTA) and LDL uptake was measured by flow cytometry (Mindry, Bricyte E6). HUVECs treated with naïve LDL were used as a negative control. To obtain the real fluorescence due to FITC-LDL uptake, the background fluorescence was subtracted from the mean FITC-LDL fluorescent intensity of each sample, FSC/FSS scatter diagrams were plotted and 2000 events were recorded.
Reagents
The following reagents were used: bafilomycin A1 (Sigma-Aldrich, 196000), cycloheximide (Sigma-Aldrich, 239763), rapamycin (Sigma-Aldrich, 553210), 3-MA (Sigma-Aldrich, 189490), glucose (Sigma-Aldrich, 47829), mannitol (Sigma-Aldrich, M1902), Z-VAD-FMK (Sigma-Aldrich, 627610), MG-132 (Sigma-Aldrich, 474787), LysoTracker Red (Beyotime Biotechnology, C1049), AICAR (Sigma-Aldrich,171260), LDL (Yiyuan Biotechnology, YB-001), FITC (Sigma-Aldrich, 46950), DMSO (Sigma-Aldrich, 34869).
Sirna transfection
At 40% to 50% confluence, HUVECs were transfected with indicated siRNA (Guangzhou RiboBio, China) or scrambled siRNA (Guangzhou RiboBio, China, siNO5815122147) using Hiperfect transfection reagent (Qiagen, 301705) according to the manufacturer’s protocol. The sequences are as follows: CAV1 siRNA sense: (5ʹ-CGAGAAGCAAGUGUACGACdTdT-3), CAV1 siRNA antisense: (5ʹ-GUCGUACA CUUGCUUCUCGdTdT-3ʹ); ATG5 siRNA sense: (5ʹ-GGAACAUCACAGUACAUUU dTdT-3ʹ), ATG5 siRNA antisense (5ʹ-AAAUGUACUGUGAUGUUCCdTdT-3ʹ); CAVIN1 siRNA sense: (5ʹ-GGAGGUUGAGGAGGUUAUUdTdT-3ʹ), CAVIN1 siRNA antisense: (5ʹ-AAUAACCUCUCCAACCUCCdTdT-3); MTOR siRNA sense: (5ʹ-AAGAAUCAAAG AGCAGAGUGCdTdT-3ʹ); MTOR siRNA antisense (5ʹ-GCACUCUGCUCUUUGAUUC UUdTdT-3ʹ).
Western blotting analysis
Western blotting analysis was carried out as previously described [54]. In brief, 20 μg of total protein in 10 μl supernatant was loaded and separated by SDS-PAGE gel and immunoblotted with indicated primary antibodies. Membranes were incubated with horseradish peroxidase (HRP)-conjugated secondary antibody (1:10,000; Beyotime Biotechnology, A0208) for 1 h and the immunoreactive bands were visualized by chemiluminescence. The choice of 20 μg total protein as a proper sampling amount was based on our preliminary experiments of linear range detection, which found 20 μg protein was within the combined linear range of both target proteins and housekeeping loading control. The following primary antibodies were used at 1:1000 dilution: rabbit anti-LC3B (Cell Signaling Technology, 3868), anti-ATG5 (Cell Signaling Technology, 12994), anti-SQSTM1/p62 (Cell Signaling Technology, 39749), anti-CAV1 (Cell Signaling Technology, 3267) and anti-ACTB (Cell Signaling Technology, 4970), anti-phospho-Ser2448-MTOR (Cell Signaling Technology, 2971), anti-MTOR (Cell Signaling Technology, 2972), anti-AMPK (Cell Signaling Technology, 9158), anti-phospho-Thr172-AMPK (Cell Signaling Technology, 50081) antibodies. Anti-PIK3C3/VPS34 (Sigma-Aldrich, V9764) and anti-CAVIN1 (Proteintech, 18892–1-AP). Goat anti-rabbit IgG HCS (Abbkine, A25222), goat anti-rabbit IgG (Abbkine, A21020) and goat anti-mouse IgG (Abbkine, A21010) secondary antibodies were used at 1:10,000 dilution.
LDL transcytosis
The amount of LDL transcytosis was measured according to previous reports [13,14]. In brief, HUVECs were seeded on polyester transwell membranes (Costar, 3470). The integrity of the cell monolayer was evaluated as previously described [55]. Two inserts containing cell monolayers with equal integrity were assigned to the same group and 2 different groups were considered: the non-competitive group and the competitive group. The competitive group was treated with FITC-LDL (50 μg/mL) and 6-fold excess of unlabeled LDL to determine paracellular transport, whereas the non-competitive group was treated with FITC-LDL (50 μg/mL) alone to determine the total transport of transendothelial LDL. Samples were collected from the outer chambers and further dialyzed against PBS (Thermo Fisher Scientific,10010031) to remove free FITC. The intensity of FITC was measured by a fluorescence spectrophotometer (Tecan, Ininite F200PRO) with excitation and emission wavelengths of 490 nm and 520 nm, respectively. Background fluorescence of serum-free Opti-MEM (Gibco, 31985–070) was subtracted from the fluorescence of each sample. The amount of LDL transcytosis was calculated by the difference between the fluorescence intensity of the non-competitive insert and the competitive insert.
Peptides
To compare the effect of the putative CSD (amino acids 80 − 101; SFDGIWKASFTTFTVTKYWFYR) or the putative IMD (ALIGIPMALIWGIYFAILSFLHIWAYVPCIK) of CAV1 on autophagy, peptides were synthesized in fusion with the C terminus of TAT (YGRKKRRQRRR) by ChinaPeptides (Shanghai, China). Peptides were biotinylated at the C terminus and biotinylated TAT served as negative control.
Co-immunoprecipitation and immunoblotting biotinylated peptides analysis
Cells were lysed on ice in immunoprecipitation cell lysis buffer (Beyotime, P0031), containing a protease inhibitor cocktail (Roche, 049693132001). The lysate was centrifuged at 15,200 xg for 15 min at 4°C and the supernatant was quantified by BCA (Thermo Fisher Scientific, 23235) analysis. For co-immunoprecipitation assay, an amount of 500 μg of protein in 250 μl supernatant was incubated overnight at 4°C with anti-CAV1 (1:50), anti-CAVIN1 (1:50), anti-LC3B (1:50), followed by precipitation with 20 μl of Pierce®Protein A/G Agarose (Thermo Fisher Scientific, 20421) for 2 h at room temperature. Normal rabbit IgG was used as negative control. The precipitated complexes were separated by SDS-PAGE gel and immunoblotted with anti-CAV1, anti-CAVIN1. To reduce the signals from the denatured IP antibody, the secondary antibody anti-Rabbit IgG Light-Chain specific (Cell Signaling Technology, 93702) was used at 1:1000 dilution. To immunoblot biotinylated peptides, the precipitated complexes were separated on a Tricine-SDS-PAGE gel according to a previously published method [56,57] and electro-transferred for 1 h at a constant electric current of 280 mA to a polyvinylidene difluoride (PVDF; millipore, ISEQ00010) membrane. After blocking of non-specific sites in 2% BSA for 15 min, membranes were incubated with streptavidin-horseradish peroxidase (HRP)-conjugated secondary antibody (1:10,000; Beyotime, A0303) for 1 h and the immunoreactive bands were visualized by chemiluminescence.
Gst-affinity isolation
All GST tagged proteins were expressed in E. coli BL21. GST fusion proteins were purified on glutathione-Sepharose 4B (GE Healthcare, 10250335). For GST pull down with HUVECs lysates, 4 μg of GST fusion proteins were incubated with 1,000 μg of HUVECs lysate for 8 h at 4°C and then washed 5 times with 1 ml of lysis buffer. The precipitate complex was boiled with sample buffer containing 1% SDS for 5 min at 95°C and analyzed by SDS-PAGE, followed by immunoblotting with anti-CAV1 or GST antibody (ABclonal, AE001).
Plasmid transfection
The GFP-LC3B plasmid was a gift from Professor Ruiguang Zhang (Cancer Center, Union Hospital, Tongji Medical College, Huazhong University of Science and Technology, Wuhan, Hubei, China) [58]. Vector plasmid (pcDNA3.1; Tsingke,Y0014778–3), Flag-CAV1 plasmid, Flag-LIR−/- (CSD) plasmid; Flag-LIR−/- (IMD) plasmid, Flag-LIR−/- plasmid, a GFP-CAV1 plasmid, GFP-CAV1 (CBM−/-) plasmid, GFP-LIR−/- (CSD) plasmid; GFP-LIR−/- (IMD) plasmid, GFP-LIR−/- plasmid and an RFP-CAV1 plasmid were all synthesized by (Tsingke, Beijing, China). HUVECs were seeded and transfected with indicated plasmid at a concentration of 0.4 μg for 24 h using Effectene transfection reagent (Qiagen, 301427) according to the manufacturer’s protocol. Whereas in Figure S2, HUVECs were transfected with indicated plasmids at a concentration of 2 μg for 24 h using Effectene transfection reagent. HUVECs were infected with GFP-RFP-LC3 lentivirus (Gene, GTCA1431079923QA) according to the manufacturer’s instructions. The MOI used for infection is 20. After infected, cells were cultured in endothelial cell medium containing additional 0.25 μg/ml puromycin.
Confocal imaging analysis
HUVECs were seeded on glass bottom cell culture dishes, followed by plasmid transfection. Cells were stained with 100 nM LysoTracker Red (Beyotime Biotechnology, C1046) in ECM medium at 37°C for 1 h. After washing with PBS (Thermo Fisher Scientific,10010031), cells were immediately fixed with 4% paraformaldehyde for 10 min and observed under a confocal microscope (Olympus, FV3000). Images were obtained by a fluorescence microscope using a 100x objective. The integrated fluorescent intensities were evaluated using Image-Pro Plus software and normalized to the number of cells.
Elisa-based assay to detect peptide – protein interactions
An ELISA-based assay technique using crude cell lysates was established to investigate the association between peptides and their interacting proteins (eNOS, LC3B) as previously described with minor modifications. In brief, HUVECs at 80–100% confluence were treated with biotinylated peptides (TAT, TAT-CSD or TAT-IMD, 20 μM) for 4 h, after which cells were lysed. The concentration of protein was measured using a BCA kit and adjusted to equal concentration and volume. Cell extracts (20 μg) were incubated in streptavidin-coated 96-well plates (Roche Diagnostics Corporation, 11664778001) for 1 h at 37°C, followed by 5 washes with PBST (Servicebio, G0002), containing 0.05% Tween-20 (BioFroxx, 1247). Proteins associated with biotinylated peptides specifically bound to streptavidin-coated 96-wells. LC3B, eNOS were detected using primary antibodies directed against LC3B (Cell Signaling Technology, 3868), eNOS (Cell Signaling Technology, 32027), and a secondary HRP-conjugated antibody (1:5,000; Abbkine, A21020). The blank control underwent the same procedure as the samples, except that lysis buffer was incubated in the microwells instead of cell lysate. The interaction between peptides and proteins was determined by measuring absorbance at a wavelength of 450 nm (OD450) using a micro-plate reader. Data were obtained by subtracting the absorbance of the blank control from the absorbance of the samples.
Transmission electron microscopy
After indicated treatments, cells were fixed with 2.5% glutaraldehyde in 0.1 M sodium cacodylate buffer and stored at 4°C until embedding. Then, cells were post fixed with 1% OsO4 in 0.1 M cacodylate buffer (pH 7.2), containing 0.1% CaCl2 for 1 h at 4°C. After rinsing with cold distilled water, cells were dehydrated through a graded series of ethanol (30%–100%). Samples were embedded in Embed-812 (EMS, 14120), and after polymerization of the resin at 60°C for 36 h, serial sections were cut using an ultramicrotome (Leica, Germany) and mounted on formvar coated slot grids (EMS, GA300-Cu). Sections were stained with 4% uranyl acetate and lead citrate, and examined under a Tecnai G2 F20 S-TWIN transmission electron microscope (FEI, American).
Immuno-electron microscopy
Immuno-electron microscopy analysis was carried out as previous report [59]. For GFP pre-embedding immuno-staining, HUVECs were washed with PBS (Thermo Fisher Scientific,10,10031), fixed in 4% paraformaldehyde at 4°C for 1 h, and permeabilized in enhanced immuno-staining permeabilization buffer (Beyotine Biotechnology, L0097) for 15 ~ 30 min. Fixed cells were blocked with 10% FBS in PBS (Thermo Fisher Scientific,10010031) for 30 min, stained with GFP antibody (1:50; Abclonal, AE012) in blocking buffer at 4°C overnight, and washed with PBS (Thermo Fisher Scientific, 10010031) 3 times. Cells were then stained with 4 nm colloidal gold affinipure goat anti-mouse IgG (1:20; Jackson ImmunoResearch Laboratories, 115–185-146) in PBS (Thermo Fisher Scientific,10010031) at 4°C for 6 h and washed with PBS (Thermo Fisher Scientific, 10010031) 3 times. Cells after immuno-staining were fixed with 2.5% glutaraldehyde and stored at 4°C until embedding. Then, cells were post fixed with 1% OsO4 in 0.1 M cacodylate buffer, pH 7.2, containing 0.1% CaCl2 for 1 h at 4°C. After rinsing with cold distilled water, cells were dehydrated through a graded series of ethanol (30%–100%). Samples were embedded in Embed-812 (EMS, 1412 0), and after polymerization of the resin at 60°C for 36 h, cells were cut using an ultramicrotome (Leica, Germany) and mounted on formvar coated slot grids (EMS, GA300-Cu). Cells were examined under a transmission electron microscope (HITACHI, HT7700, Japan).
Statistical analysis
Data are expressed as the mean ± SEM from at least 3 independent experiments. Individual group statistical comparisons were analyzed by unpaired Student t-test, whereas multiple-group comparisons were evaluated by one-way ANOVA with post-hoc testing. P < 0.05 was considered statistically significant.
Supplementary Material
Funding Statement
This study was supported by Grants from the National Natural Science Foundation of China [81573432, 81373413, 81470458, and 81570657], the Ministry of Education of China [NCET-10-0409], and from the Fundamental Research Funds for the Central Universities [2015ZHYX006, 2016YXZD023 and 2016YXMS128]. This work was supported by Integrated Innovative Team for Major Human Diseases Program of Tongji Medical College, HUST.
Disclosure statement
No potential conflict of interest was reported by the authors.
Supplemental material
Supplemental data for this article can be accessed here.
References
- [1].Buse JB, Ginsberg HN, Bakris GL, et al. Primary prevention of cardiovascular diseases in people with diabetes mellitus: a scientific statement from the American heart association and the American diabetes association. Diabetes Care. 2007;30:162–172. [DOI] [PubMed] [Google Scholar]
- [2].Mazzone T. Intensive glucose lowering and cardiovascular disease prevention in diabetes: reconciling the recent clinical trial data. Circulation. 2010;122:2201–2211. [DOI] [PMC free article] [PubMed] [Google Scholar]
- [3].Beckman JA, Creager MA, Libby P. Diabetes and atherosclerosis: epidemiology, pathophysiology, and management. JAMA. 2002;287:2570–2581. [DOI] [PubMed] [Google Scholar]
- [4].Fogelstrand P, Boren J. Retention of atherogenic lipoproteins in the artery wall and its role in atherogenesis. Nutr Metab Cardiovasc Dis. 2012;22:1–7. [DOI] [PubMed] [Google Scholar]
- [5].Didangelos A, Mayr U, Monaco C, et al. Novel role of ADAMTS-5 protein in proteoglycan turnover and lipoprotein retention in atherosclerosis. J Biol Chem. 2012;287:19341–19345. [DOI] [PMC free article] [PubMed] [Google Scholar]
- [6].Frank PG, Pavlides S, Lisanti MP. Caveolae and transcytosis in endothelial cells: role in atherosclerosis. Cell Tissue Res. 2009;335:41–47. [DOI] [PubMed] [Google Scholar]
- [7].Quest AF, Leyton L, Parraga M. Caveolins, caveolae, and lipid rafts in cellular transport, signaling, and disease. Biochem Cell Biol. 2004;82:129–144. [DOI] [PubMed] [Google Scholar]
- [8].Sun SW, Zu XY, Tuo QH, et al. Caveolae and caveolin-1 mediate endocytosis and transcytosis of oxidized low density lipoprotein in endothelial cells. Acta Pharmacol Sin. 2010;31:1336–1342. [DOI] [PMC free article] [PubMed] [Google Scholar]
- [9].Parton RG, Del Pozo MA. Caveolae as plasma membrane sensors, protectors and organizers. Nat Rev Mol Cell Biol. 2013;14:98–112. [DOI] [PubMed] [Google Scholar]
- [10].Parton RG, Hanzal-Bayer M, Hancock JF. Biogenesis of caveolae: a structural model for caveolin-induced domain formation. J Cell Sci. 2006;119:787–796. [DOI] [PubMed] [Google Scholar]
- [11].Frank PG, Pavlides S, Cheung MW, et al. Role of caveolin-1 in the regulation of lipoprotein metabolism. Am J Physiol Cell Physiol. 2008;295:C242–8. [DOI] [PMC free article] [PubMed] [Google Scholar]
- [12].Fernandez-Hernando C, Yu J, Suarez Y, et al. Genetic evidence supporting a critical role of endothelial caveolin-1 during the progression of atherosclerosis. Cell Metab. 2009;10:48–54. [DOI] [PMC free article] [PubMed] [Google Scholar]
- [13].Bian F, Yang X, Zhou F, et al. C-reactive protein promotes atherosclerosis by increasing LDL transcytosis across endothelial cells. Br J Pharmacol. 2014;171:2671–2684. [DOI] [PMC free article] [PubMed] [Google Scholar]
- [14].Zhang Y, Yang X, Bian F, et al. TNF-alpha promotes early atherosclerosis by increasing transcytosis of LDL across endothelial cells: crosstalk between NF-kappaB and PPAR-gamma. J Mol Cell Cardiol. 2014;72:85–94. [DOI] [PubMed] [Google Scholar]
- [15].Nabi IR. Cavin fever: regulating caveolae. Nat Cell Biol. 2009;11:789–791. [DOI] [PubMed] [Google Scholar]
- [16].Briand N, Dugail I, Le Lay S. Cavin proteins: new players in the caveolae field. Biochimie. 2011;93:71–77. [DOI] [PubMed] [Google Scholar]
- [17].Hayer A, Stoeber M, Ritz D, et al. Caveolin-1 is ubiquitinated and targeted to intralumenal vesicles in endolysosomes for degradation. J Cell Biol. 2010;191:615–629. [DOI] [PMC free article] [PubMed] [Google Scholar]
- [18].Marino G, Niso-Santano M, Baehrecke EH, et al. Self-consumption: the interplay of autophagy and apoptosis. Nat Rev Mol Cell Biol. 2014;15:81–94. [DOI] [PMC free article] [PubMed] [Google Scholar]
- [19].Zhang T, Tian F, Wang J, et al. Endothelial cell autophagy in atherosclerosis is regulated by miR-30-mediated translational control of ATG6. Cell Physiol Biochem. 2015;37:1369–1378. [DOI] [PubMed] [Google Scholar]
- [20].Luo Y, Lu S, Zhou P, et al. Autophagy: an exposing therapeutic target in atherosclerosis. J Cardiovasc Pharmacol. 2016;67:266–274. [DOI] [PubMed] [Google Scholar]
- [21].Fang L, Zhou Y, Cao H, et al. Autophagy attenuates diabetic glomerular damage through protection of hyperglycemia-induced podocyte injury. PLoS One. 2013;8:e60546. [DOI] [PMC free article] [PubMed] [Google Scholar]
- [22].He C, Zhu H, Li H, et al. Dissociation of Bcl-2-Beclin1 complex by activated AMPK enhances cardiac autophagy and protects against cardiomyocyte apoptosis in diabetes. Diabetes. 2013;62:1270–1281. [DOI] [PMC free article] [PubMed] [Google Scholar]
- [23].Torisu K, Singh KK, Torisu T, et al. Intact endothelial autophagy is required to maintain vascular lipid homeostasis. Aging Cell. 2016;15:187–191. [DOI] [PMC free article] [PubMed] [Google Scholar]
- [24].Davalos A, Fernandez-Hernando C, Sowa G, et al. Quantitative proteomics of caveolin-1-regulated proteins: characterization of polymerase i and transcript release factor/CAVIN-1 IN endothelial cells. Mol Cell Proteomics. 2010;9:2109–2124. [DOI] [PMC free article] [PubMed] [Google Scholar]
- [25].Hill MM, Bastiani M, Luetterforst R, et al. PTRF-Cavin, a conserved cytoplasmic protein required for caveola formation and function. Cell. 2008;132:113–124. [DOI] [PMC free article] [PubMed] [Google Scholar]
- [26].Liu L, Brown D, McKee M, et al. Deletion of Cavin/PTRF causes global loss of caveolae, dyslipidemia, and glucose intolerance. Cell Metab. 2008;8:310–317. [DOI] [PMC free article] [PubMed] [Google Scholar]
- [27].Mizushima N, Yoshimori T. How to interpret LC3 immunoblotting. Autophagy. 2007;3:542–545. [DOI] [PubMed] [Google Scholar]
- [28].Frank PG, Woodman SE, Park DS, et al. Caveolin, caveolae, and endothelial cell function. Arterioscler Thromb Vasc Biol. 2003;23:1161–1168. [DOI] [PubMed] [Google Scholar]
- [29].Hoop CL, Sivanandam VN, Kodali R, et al. Structural characterization of the caveolin scaffolding domain in association with cholesterol-rich membranes. Biochemistry. 2012;51:90. [DOI] [PMC free article] [PubMed] [Google Scholar]
- [30].Collins BM, Davis MJ, Hancock JF, et al. Structure-based reassessment of the caveolin signaling model: do caveolae regulate signaling through caveolin-protein interactions? Dev Cell. 2012;23:11–20. [DOI] [PMC free article] [PubMed] [Google Scholar]
- [31].Lamb CA, Yoshimori T, Tooze SA. The autophagosome: origins unknown, biogenesis complex. Nat Rev Mol Cell Biol. 2013;14:759–774. [DOI] [PubMed] [Google Scholar]
- [32].Bernatchez PN, Bauer PM, Yu J, et al. Dissecting the molecular control of endothelial NO synthase by caveolin-1 using cell-permeable peptides. Proc Natl Acad Sci U S A. 2005;102:761–766. [DOI] [PMC free article] [PubMed] [Google Scholar]
- [33].Bucci M, Gratton JP, Rudic RD, et al. In vivo delivery of the caveolin-1 scaffolding domain inhibits nitric oxide synthesis and reduces inflammation. Nat Med. 2000;6:1362–1367. [DOI] [PubMed] [Google Scholar]
- [34].Kim J, Kundu M, Viollet B, et al. and mTOR regulate autophagy through direct phosphorylation of Ulk1. Nat Cell Biol. 2011;13:132–U71. [DOI] [PMC free article] [PubMed] [Google Scholar]
- [35].Kim J, Kim YC, Fang C, et al. Differential regulation of distinct Vps34 complexes by AMPK in nutrient stress and autophagy. Cell. 2013;152:290–303. [DOI] [PMC free article] [PubMed] [Google Scholar]
- [36].Kim KH, Lee MS. Autophagy–a key player in cellular and body metabolism. Nat Rev Endocrinol. 2014;10:322–337. [DOI] [PubMed] [Google Scholar]
- [37].Briand N, Prado C, Mabilleau G, et al. Caveolin-1 expression and cavin stability regulate caveolae dynamics in adipocyte lipid store fluctuation. Diabetes. 2014;63:4032–4044. [DOI] [PMC free article] [PubMed] [Google Scholar]
- [38].Dávalos A, Fernándezhernando C, Sowa G, et al. Quantitative proteomics of caveolin-1-regulated proteins: characterization of polymerase i and transcript release factor/CAVIN-1 IN endothelial cells. Mol Cell Proteomics Mcp. 2010;9:2109. [DOI] [PMC free article] [PubMed] [Google Scholar]
- [39].Li Y, Xu S, Mihaylova MM, et al. AMPK phosphorylates and inhibits SREBP activity to attenuate hepatic steatosis and atherosclerosis in diet-induced insulin-resistant mice. Cell Metab. 2011;13:376–388. [DOI] [PMC free article] [PubMed] [Google Scholar]
- [40].Semenkovich CF. Insulin resistance and atherosclerosis. J Clin Invest. 2006;116:1813–1822. [DOI] [PMC free article] [PubMed] [Google Scholar]
- [41].Kobayashi S, Xu X, Chen K, et al. Suppression of autophagy is protective in high glucose-induced cardiomyocyte injury. Autophagy. 2012;8:577. [DOI] [PMC free article] [PubMed] [Google Scholar]
- [42].Ebato C, Uchida T, Arakawa M, et al. Autophagy is important in islet homeostasis and compensatory increase of beta cell mass in response to high-fat diet. Cell Metab. 2008;8:325. [DOI] [PubMed] [Google Scholar]
- [43].He C, Zhu H, Li H, et al. Dissociation of Bcl-2–Beclin1 complex by activated AMPK enhances cardiac autophagy and protects against cardiomyocyte apoptosis in diabetes. Diabetes. 2013;62:1270–1281. [DOI] [PMC free article] [PubMed] [Google Scholar]
- [44].Joungmok K, Mondira K, Benoit V, et al. and mTOR regulate autophagy through direct phosphorylation of Ulk1. Nat Cell Biol. 2011;13:132–141. [DOI] [PMC free article] [PubMed] [Google Scholar]
- [45].Shiroto T, Romero N, Sugiyama T, et al. Caveolin-1 is a critical determinant of autophagy, metabolic switching, and oxidative stress in vascular endothelium. PLoS One. 2014;9:e87871. [DOI] [PMC free article] [PubMed] [Google Scholar]
- [46].Chen Z-H, Cao J-F, Zhou J-S, et al. Interaction of caveolin-1 with ATG12-ATG5 system suppresses autophagy in lung epithelial cells. Am J Physiol Lung Cell Mol Physiol. 2014;306:L1016–L25. [DOI] [PMC free article] [PubMed] [Google Scholar]
- [47].Chen Z-H, Lam HC, Jin Y, et al. Autophagy protein microtubule-associated protein 1 light chain-3B (LC3B) activates extrinsic apoptosis during cigarette smoke-induced emphysema. Proc Nat Acad Sci. 2010;107:18880–18885. [DOI] [PMC free article] [PubMed] [Google Scholar]
- [48].Lee SJ, Smith A, Guo L, et al. Autophagic protein LC3B confers resistance against hypoxia-induced pulmonary hypertension. Am J Respir Crit Care Med. 2011;183:649–658. [DOI] [PMC free article] [PubMed] [Google Scholar]
- [49].Luo X, Wang D, Zhu X, et al. Autophagic degradation of caveolin-1 promotes liver sinusoidal endothelial cells defenestration. Cell Death Dis. 2018;9:576. [DOI] [PMC free article] [PubMed] [Google Scholar]
- [50].Jin Y, Liu S, Ma Q, et al. Berberine enhances the AMPK activation and autophagy and mitigates high glucose-induced apoptosis of mouse podocytes. Eur J Pharmacol. 2016;794:106–114. [DOI] [PubMed] [Google Scholar]
- [51].Zhuo L, Fu B, Bai X, et al. NAD blocks high glucose induced mesangial hypertrophy via activation of the sirtuins-AMPK-mTOR pathway. Cell Physiol Biochem. 2011;27:681–690. [DOI] [PubMed] [Google Scholar]
- [52].Joshi B, Bastiani M, Strugnell SS, et al. Phosphocaveolin-1 is a mechanotransducer that induces caveola biogenesis via Egr1 transcriptional regulation (vol 199, pg 425, 2012). J Cell Biol. 2013;200:681. [DOI] [PMC free article] [PubMed] [Google Scholar]
- [53].Cheung AL. Isolation and culture of human umbilical vein endothelial cells (HUVEC). Curr Protoc Microbiol. 2007;4(1):A.4B.1-A.4B.8. [DOI] [PubMed] [Google Scholar]
- [54].Xing S, Yang X, Li W, et al. Salidroside stimulates mitochondrial biogenesis and protects against H(2)O(2)-induced endothelial dysfunction. Oxid Med Cell Longev. 2014;2014:904834. [DOI] [PMC free article] [PubMed] [Google Scholar]
- [55].Cankova Z, Huang J-D, Kruth HS, et al. Passage of low-density lipoproteins through Bruch’s membrane and choroid. Exp Eye Res. 2011;93:947–955. [DOI] [PMC free article] [PubMed] [Google Scholar]
- [56].Schägger H. Tricine–SDS-PAGE. Nat Protoc. 2006;1:16–22. [DOI] [PubMed] [Google Scholar]
- [57].Haider SR, Reid HJ, Sharp BL. Tricine-SDS-PAGE. In: Protein electrophoresis: methods and protocols. 2012;869:81–91. [DOI] [PubMed] [Google Scholar]
- [58].Zhang R, Zhu F, Ren J, et al. Beclin1/PI3K-mediated autophagy prevents hypoxia-induced apoptosis in EAhy926 cell line. Cancer Biother Radiopharm. 2011;26:335–343. [DOI] [PubMed] [Google Scholar]
- [59].Slot JW, Geuze HJ. Cryosectioning and immunolabeling. Nat Protoc. 2007;2:2480–2491. [DOI] [PubMed] [Google Scholar]
Associated Data
This section collects any data citations, data availability statements, or supplementary materials included in this article.