Abstract
Thromboelastography (TEG) is regularly used for monitoring abnormalities of the coagulation system in patients with sepsis. However, it is unclear whether TEG parameters are associated with sepsis-induced coagulopathy (SIC). Thus, we aimed to assess the diagnostic value of TEG for SIC. The medical records of patients who underwent TEG from January 2016 to December 2016 were analyzed retrospectively. The patients were divided into sepsis group and non-sepsis group. Baseline patient characteristics and coagulation function indexes were compared. Receiver–operating characteristic curve analysis was used to determine predictors of SIC. A total of 167 patients were included, of whom 84 had sepsis. The clot formation speed (K) was significantly higher(P < 0.001), and the maximum amplitude (MA) and angle were significantly lower (both P < 0.001) in the sepsis group than that in non-sepsis group. Patients with SIC had higher Sepsis-related Organ Failure Assessment scores than those patients without SIC (P < 0.001). The area under the curve of K for diagnosing SIC was 0.910. The area under the curve of angle and MA for excluding SIC was 0.895 and 0.882, respectively. Thus, TEG parameters have good diagnostic value for SIC.
Keywords: thromboelastography, sepsis, coagulopathy, diagnosis, maximum amplitude
Introduction
Sepsis, which is defined as life-threatening organ dysfunction caused by a dysregulated host response to infection, kills millions of people globally each year.1 The host response in sepsis is characterized by extensive activation of immune cells and alterations in the coagulation system.2 The interaction between the coagulation system, inflammatory reactions, and the immune system during sepsis has attracted much attention.3,4
As previous studies of sepsis found coagulopathy to be quite common in individuals with sepsis, a new concept of sepsis-induced coagulopathy (SIC) was put forward to address the importance of coagulopathy in the pathogenesis of sepsis.5 A new scoring system has been proposed to define SIC, which includes platelet count, international normalized ratio, and the Sequential Organ Failure Assessment (SOFA) score. Research has confirmed that the definition of SIC comprehensively indicates the coagulation dysfunction in sepsis.6,7 However, some studies have shown that thromboelastography (TEG) parameters may reflect abnormalities in the coagulation condition closer to the actual situation of patients (e.g. possibility of bleeding) than routine coagulation tests.8,9
It is not known whether TEG parameters can be used to diagnose SIC, nor their value as predictors of long-term survival in patients with sepsis. Thus, we have designed this study to assess the diagnostic value of TEG parameters for SIC and the correlation between TEG parameters and long-term survival in patients with sepsis.
Materials and Methods
Study Design and Patients
We conducted a retrospective study that included all consecutive patients who underwent TEG in Nanfang Hospital in Guangzhou Province, China, from January 2016 to December 2016. Patients aged 18 years who had undergone TEG were included in the cohort. The exclusion criteria included the unavailability of clinical data, patient refusal to provide information and patients on anticoagulation. First, we divided our cohort into a sepsis group and a non-sepsis group based on the Sepsis 3.0 definition.1 Second, we divided the sepsis group into a SIC group and a non-SIC group based on the SIC definition.5 We interviewed the patient’s family members or the patient by phone to investigate the patient’s status 2 years later and to obtain consent. This study was performed in accordance with the ethical standards of the Helsinki Declaration and was approved by Southern Medical University Ethics Committee.
Clinical Data and Thromboelastography
Clinical data on each patient were retrospectively collected using a standardized form. The form included the following information: ID, age, sex, TEG results and date, diagnosis, blood biochemical test results, and infection parameters (white blood cell count, procalcitonin level, and C-reactive protein level), organ failure and disease severity scores (SOFA score, Acute Physiology and Chronic Health Evaluation [APACHE] II score, and Disseminated Intravascular Coagulation [DIC] score). The TEG examination was prescribed by the clinician based on the patient’s clinical condition. The operation of TEG was standardized. Blood samples were sent for inspection 1 hour after blood collection, and blood samples drawn over 2 hours were collected again to avoid result error. The instrument used was Haemonetics TEG5000 of the United States. The timing of the measurement of all the other variable parameters was within 24 hours of the TEG examination. Follow-up data included the date and cause of death censored at 2 years. The recorded TEG variables included reaction time (R), clot formation speed (K), angle, and maximum amplitude (MA).
Statistical Analysis
Continuous variables were presented as median (interquartile range) or mean (± standard deviation) and compared as appropriate. Categorical variables were presented as frequencies with percentages (95% confidence interval [CI]), and compared as appropriate. The value of TEG parameters in evaluating the diagnosis of SIC was analyzed using receiver-operating characteristic (ROC) curve analysis. ROC curve analysis and the Kaplan-Meier survival estimate curve analysis were used to analyze the value of TEG parameters in predicting 2-year survival. The analyses were performed using the SPSS Base Version 19.0 statistical software package (IBM Corp, Armonk, NY, USA).
Results
Clinical Baseline Data
We enrolled 167 patients, of whom 69 were female and 98 were male. Patients ranged in age from 18 to 93 years, with a median age of 56 years. There were 84 patients in the sepsis group and 83 patients in the non-sepsis group. The baseline clinical data are shown in Supplemental Table S1.
Comparison of Clinical Indicators Between the Sepsis Group and the Non-Sepsis Group
The patients in the sepsis group were older than those in the non-sepsis group but the difference between the groups was not statistically significant. Compared to the non-sepsis group, the sepsis group had significantly higher levels of inflammatory markers, including the white blood cell count and neutrophil percentage, SOFA score, and APACHE II score, while the number of platelets was significantly lower in the sepsis group. The results of the comparison of the clinical indicators between the 2 groups are shown in Table 1.
Table 1.
Clinical Indicators Between the Sepsis Group and the Non-Sepsis Group.
| Clinical indicators | Sepsis | Non-sepsis | Statistics | P |
|---|---|---|---|---|
| Age (year) | 57.00 (26.75) | 54.00 (31.00) | 2.814 | 0.10 |
| White blood cell count (×109/l) | 9.02 (7.34) | 7.40 (3.82) | 6.267 | 0.014 |
| Neutrophil percentage (%) | 83.40 (17.00) | 68.80 (23.00) | 14.456 | 0.000 |
| Percentage of lymphocytes (%) | 9.70 (14.00) | 22.50 (19.00) | 32.433 | 0.000 |
| Platelet (×109/l) | 69.50 (130.25) | 218.00 (141.00) | 33.464 | 0.000 |
| Hemoglobin (g/l) | 80.00 (29.00) | 120.00 (36.00) | 67.989 | 0.000 |
| Total bilirubin (umol/l) | 31.00 (69.00) | 7.90 (7.75) | 9.331 | 0.003 |
| albumin (g/l) | 28.10 (10.00) | 34.55 (14.15) | 3.943 | 0.049 |
| Creatinine (umol/l) | 138.00 (153.00) | 77.50 (97.75) | 0.002 | 0.966 |
| SOFA | 8.00 (7.75) | 1.00 (3.00) | 115.638 | 0.000 |
| APACHE Ⅱ | 23.50 (20.50) | 6.00 (5.00) | 110.033 | 0.000 |
Comparison of Coagulation Function Indices Between the Sepsis Group and the Non-Sepsis Group
The fibrinogen level was lower in the sepsis group than the non-sepsis group but this difference was not statistically significant. Compared to the non-sepsis group, patients in the sepsis group had a significantly longer prothrombin time (PT) and partial thromboplastin time (APTT), significantly higher R and K values, a significantly lower MA and angle, and a significantly higher DIC score. The results of the comparison of the coagulation function indexes between the 2 groups are shown in Table 2.
Table 2.
Comparison of Coagulation Function Indexes Between the Sepsis and Non-Sepsis Group.
| Observation index | Sepsis | Non-sepsis | Statistics | P |
|---|---|---|---|---|
| PT (s) | 16.70 (8.15) | 12.30 (3.10) | 9.248 | 0.003 |
| APTT (s) | 48.70 (37.10) | 35.20 (11.35) | 15.553 | 0.003 |
| INR | 1.47 (0.72) | 1.10 (0.27) | 22.127 | 0.000 |
| FIB (g/l) | 2.16 (3.03) | 3.00 (2.12) | 3.837 | 0.052 |
| R | 6.55 (4.70) | 5.80 (2.90) | 10.967 | 0.001 |
| K | 3.20 (3.35) | 1.80 (1.02) | 12.989 | 0.000 |
| Angle | 52.70 (25.40) | 65.60 (12.00) | 20.547 | 0.000 |
| MA | 47.00 (26.03) | 64.70 (15.70) | 25.174 | 0.000 |
| DIC score | 4.00 (2.00) | 0.00 (3.00) | 77.073 | 0.000 |
Correlation Analysis Comparing the Coagulation Function Indexes and the SOFA Score in Patients with Sepsis
In a subgroup analysis restricted to patients with sepsis, Spearman correlation analysis showed that PT, prothrombin time international normalized ratio (INR), and K were positively correlated with SOFA score (correlation coefficients: 0.559, 0.590 and 0.623, respectively; all P < 0.01), but the correlations between APTT, fibrinogen, R and the SOFA score were all <0.5. Contrastingly, MA and angle were negatively correlated with the SOFA score (correlation coefficients: −0.614 and −0.546, respectively; both P < 0.01).
Comparison of Coagulation and Organ Function Indexes Between the SIC Group and the Non-SIC Group
There were 59 patients with SIC and 25 patients with non-SIC in the sepsis group. We found no significant difference in PT between the SIC group and non-SIC group. Compared to those in non-SIC group, the APTT, INR, R, and K were significantly longer, the angle and MA were significantly lower and the SOFA score was significantly higher in the SIC group. The results of the comparison of the coagulation function indexes and the SOFA score between the SIC group and the non-SIC group are shown in Table 3.
Table 3.
Comparison of Coagulation and Organ Function Indexes Between the SIC and Non-SIC Group.
| Observation index | SIC | Non-SIC | Statistics | P |
|---|---|---|---|---|
| PT (s) | 18.20 (7.40) | 13.20 (4.15) | 2.555 | 0.114 |
| APTT (s) | 53.50 (43.70) | 40.10 (20.15) | 67.305 | 0.005 |
| INR | 1.63 (0.65) | 1.17 (0.34) | 8.526 | 0.005 |
| FIB (g/l) | 1.74 (1.12) | 4.37 (2.40) | 31.848 | 0.000 |
| R | 7.10 (6.20) | 5.90 (2.00) | 2.639 | 0.108 |
| K | 3.80 (4.05) | 1.60 (0.90) | 11.715 | 0.001 |
| Angle | 49.10 (21.90) | 67.20 (11.40) | 42.443 | 0.000 |
| MA | 43.50 (16.00) | 68.20 (15.65) | 45.006 | 0.000 |
| DIC score | 5.00 (2.00) | 3.00 (3.00) | 45.703 | 0.000 |
| SOFA | 10.00 (6.00) | 3.00 (4.50) | 42.340 | 0.000 |
Receiver-Operating Characteristic Curve Analysis of the Thromboelastography Parameters for Diagnosing Sepsis-Induced Coagulopathy
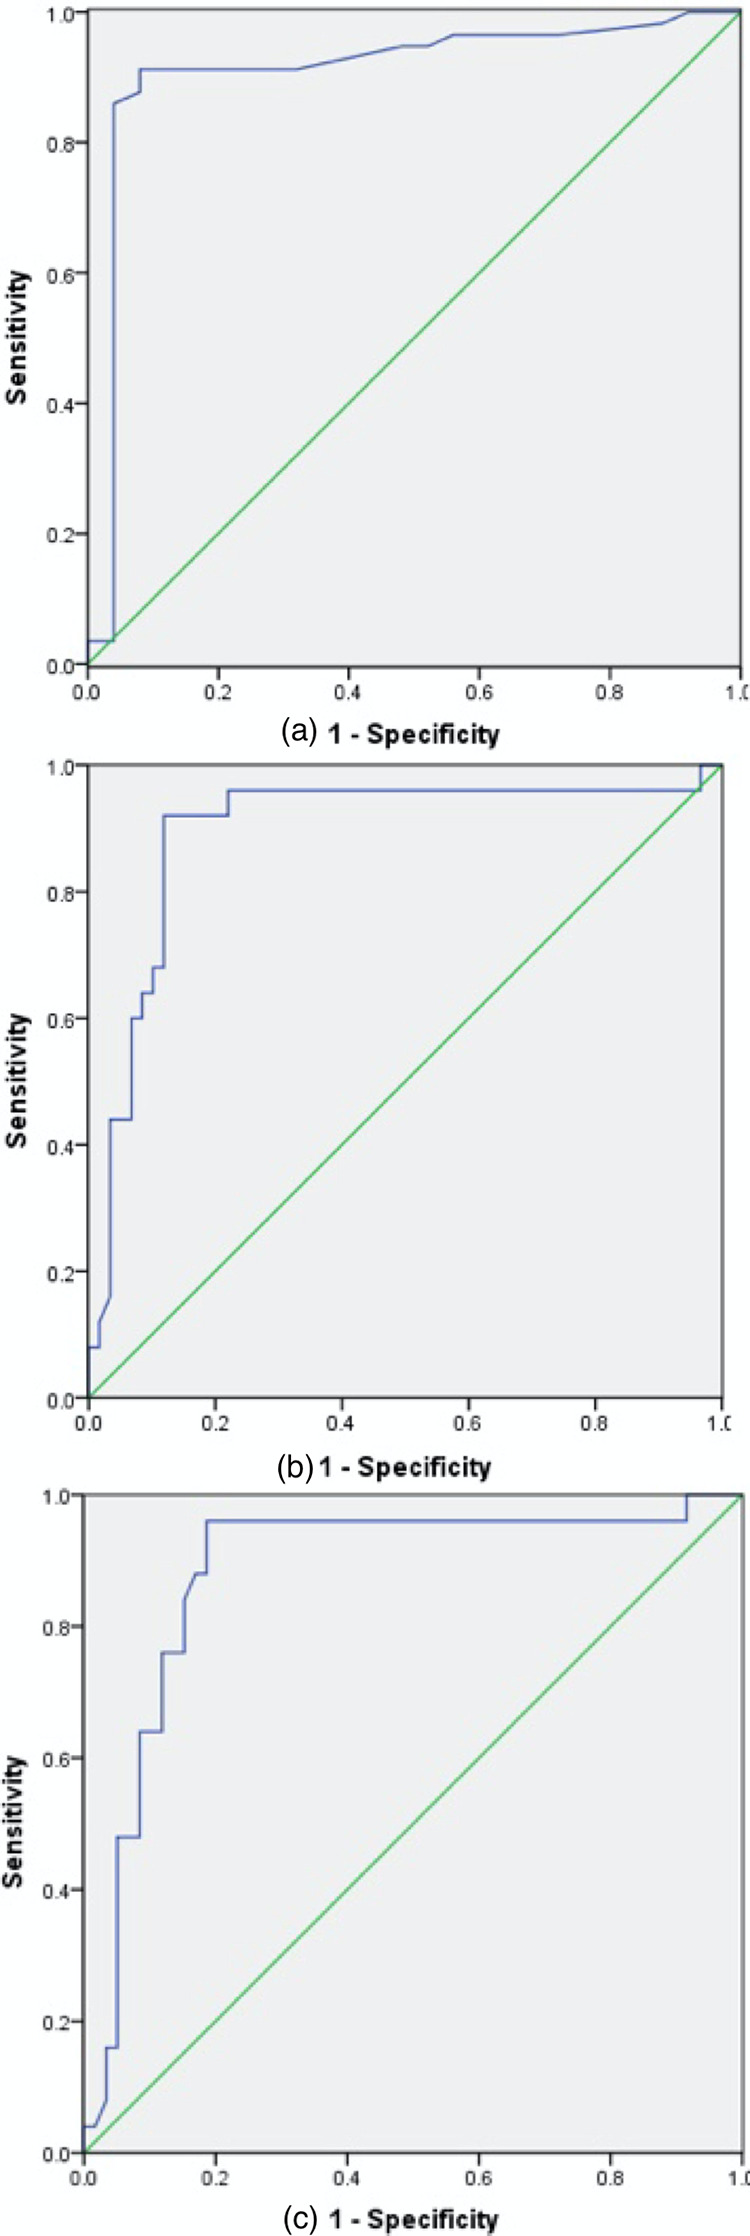
ROC curve analysis of the use of K for diagnosing SIC revealed an area under the curve of 0.910 (95% CI: 0.825–0.994); diagnostic threshold of 2.1, sensitivity of 91.2%, specificity of 92.0%, and an approximate index of 0.832 (Figure 1A).The areas under the curve of angle and MA for excluding SIC were 0.895 and 0.882 (95% CI: 0.808–0.981 and 0.795–0.969), respectively; the thresholds were 61.55 and 54.00, respectively. The sensitivity of angle was 92.0%, specificity was 88.1%, and the approximate index was 0.801 (Figure 1B). The sensitivity of MA was 96.0%, specificity was 81.4%, and the approximate index was 0.774 (Figure 1C). R was unable to diagnose SIC.
Figure 1.

Receiver-operating characteristic curve analysis of the thromboelastography parameters for diagnosing sepsis-induced coagulopathy. (a) K diagnosed sepsis-induced coagulopathy. (b) Angle excluded sepsis-induced coagulopathy. (c) MA excluded sepsis-induced coagulopathy.
Receiver-Operating Characteristic Curve Analysis of Thromboelastography Indicators as Predictors of 2-Year Survival of the Patients With Sepsis
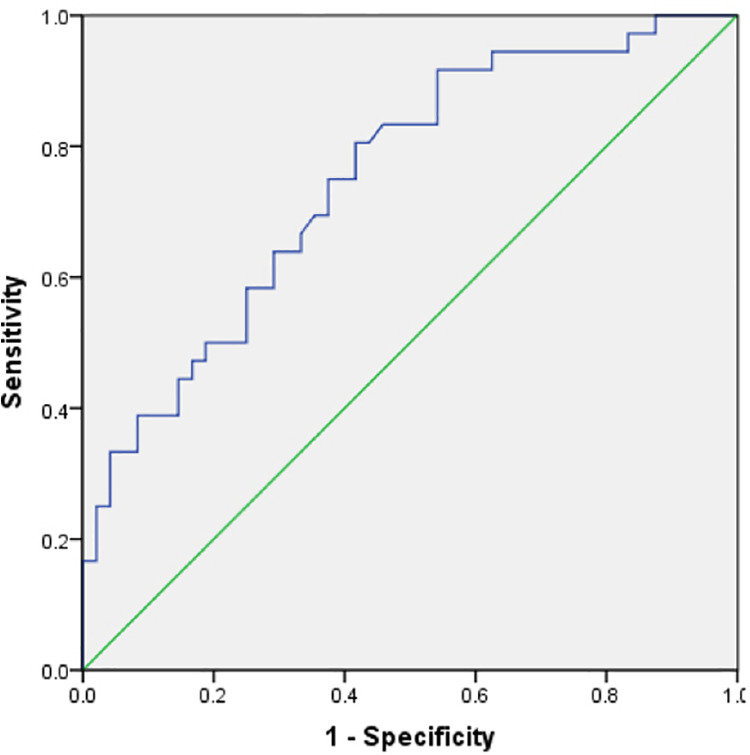
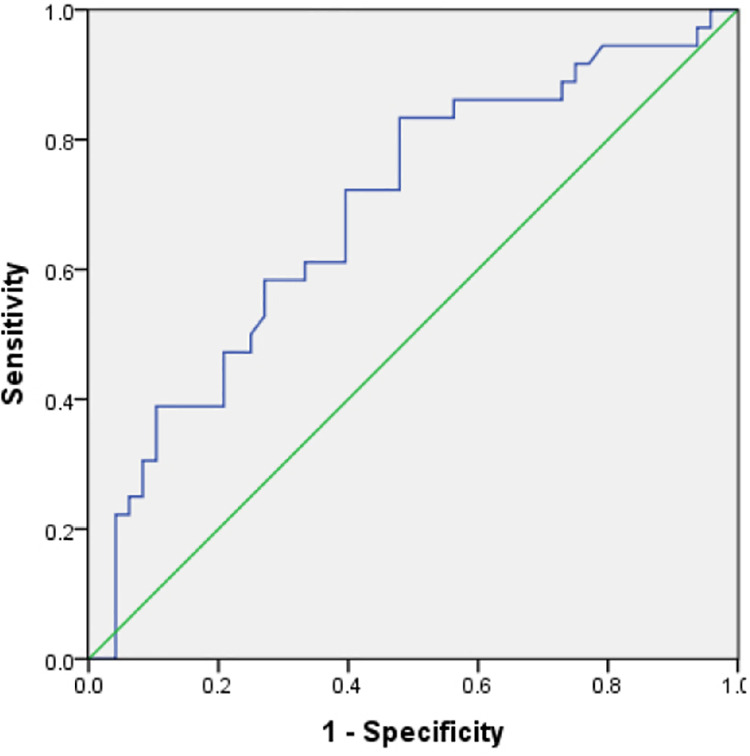
The areas under the curve of angle and MA for predicting 2-year survival of patients with sepsis were 0.750 and 0.692 (95% CI: 0.646–0.854, and 0.577–0.806), respectively; the diagnostic thresholds were 51.30 and 43.65, respectively. The diagnostic sensitivity of angle was 80.6%, specificity was 58.3%, and approximate index was 0.389 (Figure 2). The diagnostic sensitivity of MA was 83.3%, specificity was 52.1%, and the approximate index was 0.354 (Figure 3). R and K did not predict 2-year survival of patients with sepsis.
Figure 2.

Angle predicted 2-year survival of patients with sepsis.
Figure 3.

MA predicted 2-year survival of patients with sepsis.
Kaplan-Meier Survival Analysis of Thromboelastography Parameters for Predicting the 2-Year Survival of Patients With Sepsis
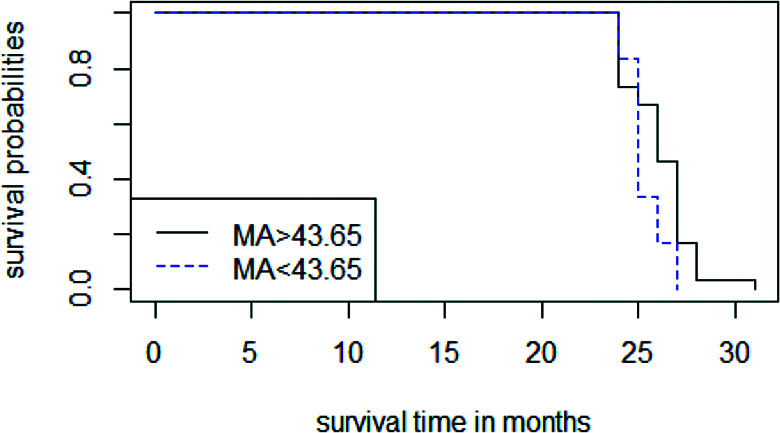
Of the 84 patients with sepsis, 48 died within 2 years. Of these 48 patients, 31 died of multiple organ failure, 3 died of hemorrhagic shock, 7 died of cardiac failure, and 7 died of unknown causes. The Kaplan-Meier analysis revealed that there was as significant difference in 2-year survival according to MA (P = 0.04), while the difference in survival according to angle was not significant. The Kaplan-Meier survival curve for MA is shown in Figure 4.
Figure 4.

The Kaplan-Meier survival estimate curve for MA.
Discussion
Our study results suggest that coagulation dysfunction is common in patients with sepsis, whether it is diagnosed by traditional methods or by thromboelastography. The abnormal coagulation function revealed by thromboelastography is closely related to the severity of the sepsis, which is consistent with the recent report.10 Our study is the first to document that the K of TEG is highly accurate for the diagnosis of SIC, while angle and MA of TEG are highly accurate for the exclusion of SIC.
In this study, we found that patients with sepsis had higher levels of inflammatory markers and more severe organ dysfunction than the patients without sepsis.11,12 Regarding the TEG indicators, patients with sepsis had high K values whereas lower values for angle and MA than patients without sepsis. This shows that a hypocoagulable state is common in patients with sepsis. Although TEG parameters in septic patients or patients with SIC can range from hypercoagulable to a hypocoagulable state, a hypocoagulable profile on admission was shown to be an independent risk factor for 30-day mortality while the presence of hypercoagulability did not predict outcome,13 which indicates that a hypocoagulable state is more harmful to the body function. Our findings are consistent with the results of previous studies.10 We also found that abnormal coagulation function is closely related to the SOFA score, suggesting that coagulation abnormalities and organ dysfunction interact in individuals with sepsis. A study by Prakash et al.14 had similar results.
To note the importance of coagulation dysfunction in sepsis, SIC was proposed for clinician to diagnose the coagulopathy. The standard method of diagnosing SIC includes platelet count, INR, and SOFA score.5 Several studies have found that patients who meet the diagnostic criteria for DIC also meet the diagnostic criteria for SIC, while only half of patients with SIC meet the diagnostic criteria for DIC, and the SIC is associated with more severe organ dysfunction compared to sepsis without SIC.6,7,15 Our results are consistent with the results of previous studies.
Several recent reports have shown that TEG parameters are superior to routine coagulation tests such as INR for diagnosing coagulopathy.9,10 However, we were unable to find any previous reports on the use of TEG for diagnosing SIC. To analyze diagnostic value of K for diagnosing SIC, we performed ROC curve analysis and found that the area under the curve for predicting SIC was 0.910, and the sensitivity and specificity were high. Additionally, the area under the ROC curve of angle and MA for excluding SIC were 0.895 and 0.882, respectively, and these parameters also had high sensitivity and specificity for diagnosing non-SIC. These results indicate that TEG is an effective method for diagnosing SIC.
A recent study has shown that coagulation indicators (e.g. international normalized ratio) correlates with 1-year mortality of patients with sepsis.16 However, it is still unclear whether TEG correlates with long-term survival in patients with sepsis. To further determine the association between TEG and long-term survival in patients with sepsis, we followed up all sepsis patients for 2 years and carried out ROC curve and Kaplan-Meier survival analyses. ROC curve showed that both angle and MA predicted 2-year survival of patients with sepsis, while R and K did not. Interestingly, Kaplan-Meier survival analysis showed that only MA predicted the 2-year survival of patients with sepsis. These results suggest that that MA is of value for predicting 2-year survival in patients with sepsis. This result may be attributable to platelets, which play a significant role in thrombosis, chronic inflammation, and the immune system in sepsis.17,18
There are some limitations in our study. First, we did not analyze the difference of TEG parameters among patients with diverse infected sites and types of bacterial infection in this study. Therefore, the effect of different sites of infection and different types of bacterial infection on the relationship between TEG parameters and sepsis requires further investigation. Second, our sample size is relatively small, so our study has limited statistical power.
In summary, thromboelastography variables are closely related to SIC and may have diagnostic value. This suggests that TEG may be a reliable alternative to standard diagnostic methods for diagnosing SIC. Furthermore, MA is a good predictor of 2-year survival among patients with sepsis. Our results demonstrate that TEG is of value in the diagnosis of sepsis and predicting survival among patients with sepsis. These results require validation from additional studies with a larger sample size.
Supplemental Material
Supplemental_Table_S1._Clinical_Baseline_Characteristics for The Value of Thromboelastography in the Diagnosis of Sepsis-Induced Coagulopathy by Cuizhu Luo, Hongbin Hu, Jian Gong, Yun Zhou, Zhongqing Chen and Shumin Cai in Clinical and Applied Thrombosis/Hemostasis
Footnotes
Authors’ Note: Hongbin Hu is the joint first author and contributed equally to this work as Cuizhu Luo. This study was performed in accordance with the ethical standards of the Helsinki Declaration and was approved by Southern Medical University Ethics Committee. All patients, or a family member provided informed consent.
Declaration of Conflicting Interests: The author(s) declared no potential conflicts of interest with respect to the research, authorship, and/or publication of this article.
Funding: The author(s) disclosed receipt of the following financial support for the research, authorship, and/or publication of this article: This work was supported by the Natural Science Foundation of China Grant 81871604; the Natural Science Foundation of Guangdong Province, China, Grants 2017A030313590.
ORCID iDs: Cuizhu Luo  https://orcid.org/0000-0002-4635-9831
Shumin Cai  https://orcid.org/0000-0002-8735-1000
Supplemental Material: Supplemental material for this article is available online.
References
- 1. Singer M, Deutschman CS, Seymour CW, et al. The third international consensus definitions for sepsis and septic shock (sepsis-3). JAMA. 2016;315(8):801–810. [DOI] [PMC free article] [PubMed] [Google Scholar]
- 2. Timsit JF, Ruppe E, Ferrer R. Focus on sepsis: new concepts and findings in sepsis care. Int Care Med. 2018;44(11):1997–1999. [DOI] [PubMed] [Google Scholar]
- 3. Levi M, Poll T. Coagulation in patients with severe sepsis. Sem Thromb Hem. 2015;41(1):9–15. [DOI] [PubMed] [Google Scholar]
- 4. Samuels JM, Moore HB, Moore EE. Coagulopathy in severe sepsis: interconnectivity of coagulation and the immune system. Surg Infect. 2018;19(2):208–215. [DOI] [PMC free article] [PubMed] [Google Scholar]
- 5. Iba T, Levy JH, Warkentin TE, et al. Diagnosis and management of sepsis-induced coagulopathy and disseminated intravascular coagulation. JTH. 2019;17(11):1989–1994. [DOI] [PubMed] [Google Scholar]
- 6. Iba T, Arakawa M, Di Nisio M, et al. Newly proposed sepsis-induced coagulopathy precedes international society on thrombosis and haemostasis overt-disseminated intravascular coagulation and predicts high mortality. J Int Care Med. 2018;35(7):643–649. [DOI] [PubMed] [Google Scholar]
- 7. Ding R, Wang Z, Lin Y, Liu B, Zhang Z, Ma X. Comparison of a new criteria for sepsis-induced coagulopathy and international society on thrombosis and haemostasis disseminated intravascular coagulation score in critically ill patients with sepsis 3.0: a retrospective study. Blood Coagul Fibrinol. 2018;29(6):551–558. [DOI] [PMC free article] [PubMed] [Google Scholar]
- 8. Andersen MG, Hvas CL, Tonnesen E, Hvas AM. Thromboelastometry as a supplementary tool for evaluation of hemostasis in severe sepsis and septic shock. Acta Anaesthesiol Scand. 2014;58(5):525–533. [DOI] [PubMed] [Google Scholar]
- 9. Wang Z, Li J, Cao Q, Wang L, Shan F, Zhang H. Comparison between thromboelastography and conventional coagulation tests in surgical patients with localized prostate cancer. Clin Appl Thromb Hemost. 2018;24(5):755–763. [DOI] [PMC free article] [PubMed] [Google Scholar]
- 10. Haase N, Ostrowski SR, Wetterslev J, et al. Thromboelastography in patients with severe sepsis: a prospective cohort study. Int Care Med. 2015;41(1):77–85. [DOI] [PubMed] [Google Scholar]
- 11. Abrams ST, Morton B, Alhamdi Y, et al. A Novel assay for neutrophil extracellular trap formation independently predicts disseminated intravascular coagulation and mortality in critically ill patients. Am J Respir Crit Care Med. 2019;200(7):869–880. [DOI] [PMC free article] [PubMed] [Google Scholar]
- 12. Zhi DY, Lin J, Zhuang HZ, Bae EH, Ma SK, Kim SW. Acute kidney injury in critically ill patients with sepsis: clinical characteristics and outcomes. J Invest Surg. 2019;32(8):689–696. [DOI] [PubMed] [Google Scholar]
- 13. Muller MC, Meijers JC, Vroom MB, Juffermans NP. Utility of thromboelastography and/or thromboelastometry in adults with sepsis: a systematic review. Critical care (London, England). 2014;18(1):R30. [DOI] [PMC free article] [PubMed] [Google Scholar]
- 14. Prakash S, Verghese S, Roxby D, Dixon D, Bihari S, Bersten A. Changes in fibrinolysis and severity of organ failure in sepsis: a prospective observational study using point-of-care test—ROTEM. J Cri Care. 2015;30(2):264–270. [DOI] [PubMed] [Google Scholar]
- 15. Yamakawa K, Yoshimura J, Ito T, Hayakawa M, Hamasaki T, Fujimi S. External validation of the two newly proposed criteria for assessing coagulopathy in sepsis. Throm Haemos. 2019;119(2):203–212. [DOI] [PubMed] [Google Scholar]
- 16. Zheng R, Pan H, Wang JF, Yu XS, Chen ZQ, Pan JY. The association of coagulation indicators with in-hospital mortality and 1-year mortality of patients with sepsis at ICU admissions: a retrospective cohort study. Int J Clin Chem. 2020;504:109–118. [DOI] [PubMed] [Google Scholar]
- 17. van Meijden PEJ, Heemskerk JWM. Platelet biology and functions: new concepts and clinical perspectives. Nat Rev Card. 2019;16(3):166–179. [DOI] [PubMed] [Google Scholar]
- 18. Pigozzi L, Aron JP, Ball J, Cecconi M. Understanding platelet dysfunction in sepsis. Int Care Med. 2016;42(4):583–586. [DOI] [PubMed] [Google Scholar]
Associated Data
This section collects any data citations, data availability statements, or supplementary materials included in this article.
Supplementary Materials
Supplemental_Table_S1._Clinical_Baseline_Characteristics for The Value of Thromboelastography in the Diagnosis of Sepsis-Induced Coagulopathy by Cuizhu Luo, Hongbin Hu, Jian Gong, Yun Zhou, Zhongqing Chen and Shumin Cai in Clinical and Applied Thrombosis/Hemostasis


