Abstract
Objective
This prospective study aimed to establish the valproic acid (VPA) population pharmacokinetic model in Chinese patients and realise personalised medication on the basis of population pharmacokinetics.
Methods
The patients’ clinical information and VPA plasma concentrations were collected from The General Hospital of Taiyuan Iron & Steel (Group) Corporation (TISCO). Nonlinear mixed-effect modelling was used to build the population pharmacokinetic model. To characterise the pharmacokinetic data, a one-compartment pharmacokinetic model with first-order absorption and elimination was used. The first-order conditional estimation with η-ε interaction was applied throughout the model-developing procedure. The absorption rate constant (Ka) was fixed at 2.38 hour−1, and the impact of covariates on clearance and apparent volume of distribution were also explored. Medical records of 60 inpatients were reviewed prospectively and the objective function value (OFV) of the base model and final model were 851.813 and 817.622, respectively.
Results
Gender was identified as the covariate that had a significant impact on the volume of distribution, and albumin and CYP2C19 genotypes influenced clearance.
Conclusion
Bootstrap and VPC indicated that a reliable model had been developed that was based on the simulation results, and a simple-to-use dosage regimen table was created to guide clinicians for VPA drug dosing.
Keywords: Population pharmacokinetics, valproic acid, epilepsy, CYP2C19, gender, albumin, personalised medication
Introduction
Valproic acid (VPA) is an antiepileptic drug (AED) that is used to treat seizures, and the ‘International League against Epilepsy’ as well as other authoritative guidelines recommend VPA as the first choice to treat patients with epilepsy and bipolar disorder.1 VPA’s therapeutic window is narrow (50–100 µg/mL), and accurate treatment of VPA is challenging because of its individual variability in pharmacokinetics. Therefore, it would be necessary to perform ‘therapeutic drug monitoring (TDM)’, to create an individualised dosing regimen. The challenge for physicians is ‘how to adjust the dosage’ because underdosing might evoke epilepsy, whereas overdosing may increase toxicity effects.
The aim of population pharmacokinetics (PPK) is to determine the variability of drug concentrations among individuals within a group of patients (i.e. the population).2 The characteristics of many patients (covariates), such as the state of the disease, demographics, concomitant medications, or the presence of renal or hepatic impairment, can all have an effect on drug pharmacokinetics. Therefore, it is essential to understand this variability to help guide safe and effective dosing regimens.3
Analysis of PPK involves collecting a small number of pharmacokinetic samples from many patients and then building mathematical models to describe the resulting data. Using sparse pharmacokinetic sampling, only a limited number of samples are taken from any given patient. An appropriate sampling design and model selection, and the resulting pharmacokinetic data can be pooled and analysed to support conclusions about pharmacokinetic variability and the influence of covariates.
Many VPA models have been suggested in recent years, but the results that are predicted are not always ideal.1,4–8 This may be caused by several factors, such as demographics, the number of samples, and/or the dosage form, and the effect of gene polymorphism on VPA metabolism has not been considered. Various studies have demonstrated that CYP2C19 genetic variations play a vital role in VPA plasma concentration variability in both paediatric and adult patients.4
The aim of this study is to investigate the impact of metabolic enzyme gene polymorphism and patient characteristics on VPA pharmacokinetic parameters in a PPK model for Chinese patients to provide personalised medicine.
Materials and methods
Patient enrolment and sample collection
This prospective study was approved by the Ethics Committee, General Hospital of Taiyuan Iron & Steel (Group) Corporation (TISCO), Shanxi Province, Taiyuan, China (ID: 201705), and was performed in accordance with Good Clinical Practice guidelines. Written informed consent was obtained from all patients or a healthcare proxy. Steady-state serum concentration data were collected from Chinese patients with seizures who were treated using standard VPA dosing regimens (i.e. oral: 500 mg [immediate release tablets/solutions], twice per day; intravenous: 400 mg, twice per day) at The Hospital of TISCO, China, from January to December 2018. Both oral and intravenous routes of administration were used in this study.
Patients had to meet the following criteria for inclusion before they were enrolled: ≥18 years old, treated with VPA with TDM, and male or female. Patients with any of the following conditions were excluded: hepatic dysfunction, used Chinese traditional medicine, AEDs containing VPA, poor compliance, incomplete clinical information, pregnancy, or had taken other medications that affect VPA concentrations (i.e., phenobarbital or carbamazepine).
Demographic information, including age, gender, weight and medication details (VPA dosing history, medication history, genotypes of enzymes, and laboratory tests), was recorded.
Determination of VPA concentration
To measure serum VPA concentrations (Combas-311; Roche, Mannheim, Germany), homogenised enzyme immunoassays were used. The calibration curve range of this assay was between 2.8 and 150 µg/mL; the lowest measurable concentration was 2.8 µg/mL, and the coefficient of variation was <5%.
CYP2C19 polymorphisms were determined using qRT-PCR
DNA from the enrolled patients was purified using a TIANamp Genomic DNA Kit (TIANGEN, Beijing, China). Genetic polymorphisms of CYP2C19*2 G618A, CYP2C19*3 G636A, and CYP2C19*17 C806T were identified using 7500 Real-Time PCR Instrument (ABI, T-Space, Singapore).
Base model
A first-order conditional estimation with η-ε interaction (FOCE-ELS) was used to build the population model (Phoenix NLME, Certara, Inc., Princeton, NJ, USA).9 As reported earlier, VPA pharmacokinetics data in sparse blood conformed to the one-compartment model. Because the population pharmacokinetic model was developed using sparse data, and nothing was observed in the absorption phase, and there is no information to identify the absorption rate constant Ka. Thus, it is necessary to fix Ka to 2.38 hour−1, in accordance with the references.10 On the basis of existing research on pharmacokinetics on the subject of VPA, it can be assumed that individual parameters conformed to log (normal distribution of the positive values), which are typical in population parameters.11
| (1) |
Here, is the th pharmacokinetic parameter of the th person, is the typical population value in the th pharmacokinetic parameter, represents the inter-individual random error of the individual parameter for the population parameter , and its value conforms to a normal distribution with a zero centre and variance .
The residual error is evaluated by the proportional error.
| (2) |
Here, Cobs and Cpred are observational and model prediction values, respectively, and ε is an intra- and inter-laboratory random error that conforms to a normal distribution with a zero centre and variance σ.
Final model
Programmes such as the Phoenix NLME (Certara, Inc.) use the principle of extending the least–square method in search of a group of population pharmacokinetic parameters that minimise the target function. The values of the target functions between the same models are conformed approximately to the χ2 distribution. When df = 1, χ20.05,1 = 3.84, χ20.005,1 = 7.78, and χ20.001,1 = 10.83, i.e. where the number of parameters between the two models is 1, there is a significant difference when ΔOFV >3.84 at P < 0.05; ΔOFV >7.78 at P < 0.005; and ΔOFV >10.83 at P < 0.001.
After constructing the basic model, the covariates, including age, gender, body weight, height, body mass index (BMI), alanine aminotransferase (ALT), aspartate aminotransferase (AST), total protein (TP), albumin (ALB), globulin (GLB), and serum creatinine (SCR), combined medication, and CYP2C19 gene polymorphism, were used to establish a stepwise full regression model. Where a covariate is being added to the model, it should be retained by the model if an OFV reduction value is >3.84, which indicates that the covariate had a significant effect (P<0.05). A full regression model was established using all covariates with significant effects, and then covariates were subtracted one by one from the full-regression model. To examine the necessity of the covariate in the model, more stringent statistical criteria (df=1, χ20.001,1=10.83) were used. If the change in the OFV value >10.83, the existence of the covariate was considered to be significant, and it was retained in the model, meaning that to obtain the final model, the full regression model was inversely culled.
Model evaluation and validation
‘Goodness-of-fit’ plots also performed a crucial role in checking for data fitting in the pharmacokinetic models. For the purpose of observation and prediction against time, an overall perspective of model performance can be evaluated. This includes scatter plots for observation and prediction against time, observation versus prediction, conditional weighted residuals (CWRES) versus prediction, and CWERS versus time through these plots.12
To validate the final model,13 bootstrap and visual predictive checks (VPC) were used; by random sampling (with replacement) two thousand bootstrap replicates were constructed from the original dataset. For each bootstrap replicate model, parameters were estimated, and the resulting values were used to estimate medians and 95% confidence intervals (the range from the 2.5th to the 97.5th percentiles of the results from individual replicates). The final model parameters were then compared with the bootstrap results. If no significant difference was observed between the data, the estimates for the final model was considered to be precise and stable. For VPCs, 1000 Monte Carlo simulations of the pharmacokinetic dataset were generated using Phoenix NLME software (Certara, Inc.). These simulations were then compared with the observations by superimposing the median and 90% prediction interval (PI; i.e., 5th and 95th percentile) of the observed data with the median and 90% PI of the simulations. The model was considered to be precise if the observed concentration data were distributed approximately within 90% PI.
Model simulation
The aim of this simulation was to provide patients with guidance for VPA dosing.14 A main concern about VPA dosages is the trough concentration, and the goal was to have VPA trough concentrations within 50 to 100 µg/mL. Patients were divided into different subgroups on the basis of the incorporated covariates. The Phoenix NLME software (Certara, Inc.) was used to conduct simulations to achieve an optimal individualised dosing regimen for different patient subgroups, and we subsequently developed a simple and practical dosage regimen table.15
Results
Baseline information
Sixty patients received VPA therapy whilst 98 observations were enrolled in this study. The demographics and laboratory results, including gender, age (year), body weight (kg), BMI (kg/m2), height (cm), SCR (µmol/L), TP (g/L), ALB (g/L), GLB (g/L), ALT (U/L), AST (U/L), and concomitant medications (carbamazepine, lamotrigine, meropenem, and imipenem), were all extracted from the medical records. CYP2C19 genetic testing was also performed for all 60 patients, and this baseline information is illustrated in Table 1.
Table 1.
Patients’ baseline information.
| Characteristics | Number or mean ± SD | Median (range) |
|---|---|---|
| No. of patients | 60 | – |
| No. of observations | 98 | – |
| Dose (mg) | – | 500 (200–1200) |
| Gender (M/F) | 44/16 | – |
| Age (year) | 60 ± 11.8 | 59 (22–88) |
| Body weight (kg) | 66.5 ± 12.1 | 66.5 (40–90) |
| Body mass index (kg/m2) | 23.0 ± 3.1 | 23.3 (15.6–28.7) |
| Height (cm) | 170 ± 6.8 | 172 (155–182) |
| Serum creatinine (µmol/L) | 66.5 ± 23.6 | 66.5 (23.6–145) |
| Total protein (g/L) | 65.9 ± 7.5 | 64.6 (7.5–81.8) |
| Albumin (g/L) | 38.9 ± 6.4 | 38.7 (25.6–53.6) |
| Globulin (g/L) | 27.1 ± 4.7 | 28.6 (4.6–36.9) |
| Alanine transaminase (U/L) | 34.3 ± 33.8 | 27.1 (5.7–214.5) |
| Aspartate transaminase (U/L) | 31.4 ± 21.0 | 26.8 (9.6–115.8) |
| CYP2C19 genotype | ||
| *1/*1 | 36 | – |
| *1/*2+*1/*3+*2/*3 | 24 | – |
| Concomitant medications | ||
| Carbamazepine | 1 | – |
| Lamotrigine | 1 | – |
| Meropenem | 1 | – |
| Imipenem | 1 | – |
M, male; F, female; SD, standard deviation.
Final pharmacokinetic model
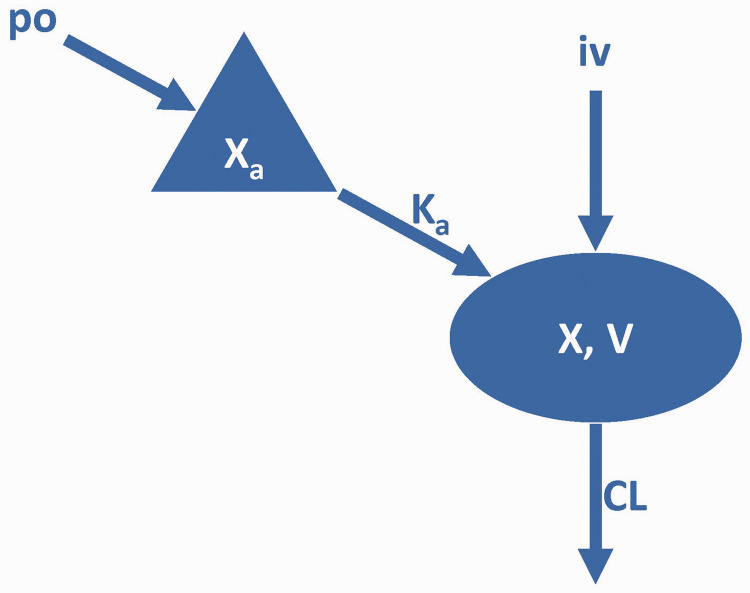
Previous studies have shown that VPA in vivo can be more appropriately described by the one-compartment model (Figure 1).5,16–18 The gender of a patient was seen to significantly influence the volume of distribution (V). The ALB and CYP2C19 genotypes were strongly associated with clearance (CL). The inclusion of covariates explains some of the random inter-individual variability (IIV) in the population parameters. This is indicated by a reduction from 54.74% and 51.55% in the base model to 31.01% and 44.06% in the final model for V and CL, respectively.
Figure 1.
Schematic diagram showing the VPA pharmacokinetic model.
VPA, valproic acid; po, oral; IV, intravenous; Xa, drug amount in the absorption compartment; X, drug amounts in the central compartment.
The pharmacokinetic parameter definitions can be found in Table 2.
The final model with the three covariates is as follows:
If CYP2C19*1/*1, then
| (3) |
If CYP2C19*1/*2 or *1/*3 or *2/*3 or *2/*2 or *3/*3, then
| (4) |
where the gender of the patient is female, then
| (5) |
where the gender of the patient is male, then
| (6) |
Regarding the final population parameters, the relative standard error (RSE), IIV, and residual errors are summarised in Table 2. These estimates show an acceptable precision (RSE% <40%).
Table 2.
The parameters of final population pharmacokinetic model and bootstrap results.
|
Model estimates |
Bootstrap results |
||||||
|---|---|---|---|---|---|---|---|
| Parameter(unit) | Estimate | RSE% | 95% CI | IIV(CV%) | Shrinkage(%) | Median | 95%CI |
| If CYP2C19*1/*1: CL (L/h) = 0.64 × (ALB/38.7)−1.06 × eηCLIf CYP2C19*1/*2 or *1/*3 or *2/*3 or *2/*2 or *3/*3: CL (L/h) = 0.64 × (ALB/38.7)−1.06 × e−0.45 eηCLIf sex is female: V (L) = 22.15 × eηVIf sex is male: V (L) = 22.15 × e0.78 × eηV | |||||||
| CL (L/hour) | 0.64 | 7.37 | 0.55 to 0.74 | 44.66 | 10.73% | 0.66 | 0.59 to 0.72 |
| V (L) | 22.15 | 10.68 | 17.45 to 26.85 | 31.01 | 53.07% | 22.05 | 18.54 to 35.02 |
| Ka (/hour) | 2.38 (FIXED) | 0 | – | – | – | 2.38 (FIXED) | – |
| fALB-CL | −1.06 | 38.11 | −1.87 to −0.26 | – | – | −1.25 | −1.82 to −0.53 |
| fCYP2C19-CL | −0.45 | 22.46 | −0.66 to −0.25 | – | – | −0.42 | −0.69 to −0.38 |
| fGNDR-V | 0.78 | 20.98 | 0.45 to 1.10 | – | – | 0.68 | 0.20 to 0.93 |
| Proportional error | 11.75 | 12.36 | 8.86 to 14.63 | – | 11.81 | 9.06 to 14.24 | |
V, volume of distribution, CL, clearance, RSE, relative standard error; IIV, inter-individual variability; CV, coefficient of variation; CYP, cytochrome P450 enzyme; 95%CI, 95% confidence interval; F, factor; ALB, albumin; GNDR, gender.
Model evaluation
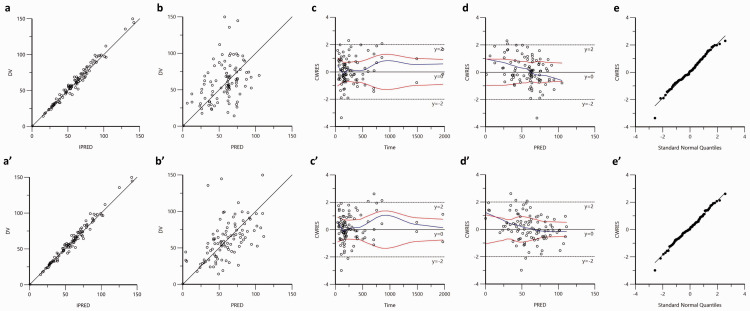
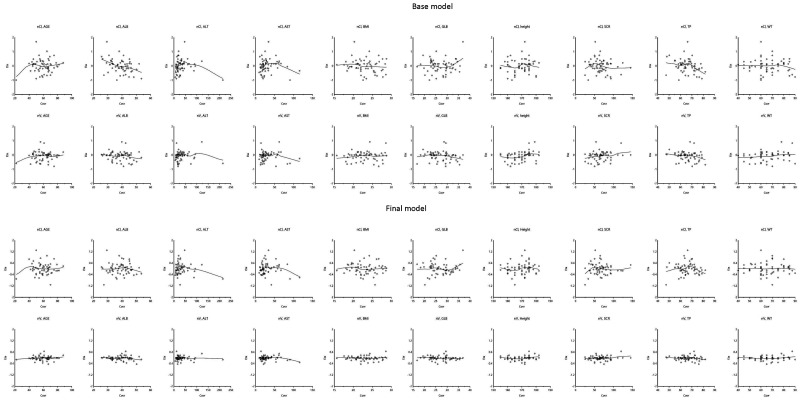
The OFV decreased by 34.191 (from 851.813 to 817.622) in the final population model compared with the base model. Goodness-of-fit plots of base and final model can be found in Figure 2; there was no systematic bias observed for either the base (Figure 2a–2e) or final models (Figure 2aʹ–2eʹ). Incorporation of ALB, gender, and CYP2C19 genotype into the final model gave predictions that were closer to the observations whilst the diagnostic plots improved significantly. The significant relationship between the etas (η; interindividual variability) of parameters (CL and V) and covariates is visible in the base model; this relationship disappears in the final model, which suggests that there is a significant improvement of the final model.
Figure 2.
Model evaluation of the VPA baseline (a, b, c, and d) as well as the final (aʹ, bʹ, cʹ, and dʹ) pharmacokinetic models.
The ‘a and a’: observation (dependent value, DV) against individual prediction (IPRED); the solid lines are identity lines y = x.
‘b and b’: DV against prediction (PRED); the solid lines are identity lines y = x.
‘c and c’: conditional weighted residual (CWRES) versus time after last dose. The blue lines are the locally weighted scatter plot smoothing, and red lines represent absolute regression lines.
‘d and d’: CWRES versus PRED; the blue lines are the locally weighted scatter plot smoothing, and red lines represent absolute regression lines.
‘e and e’: quantile–quantile (QQ) plots of CWRES.
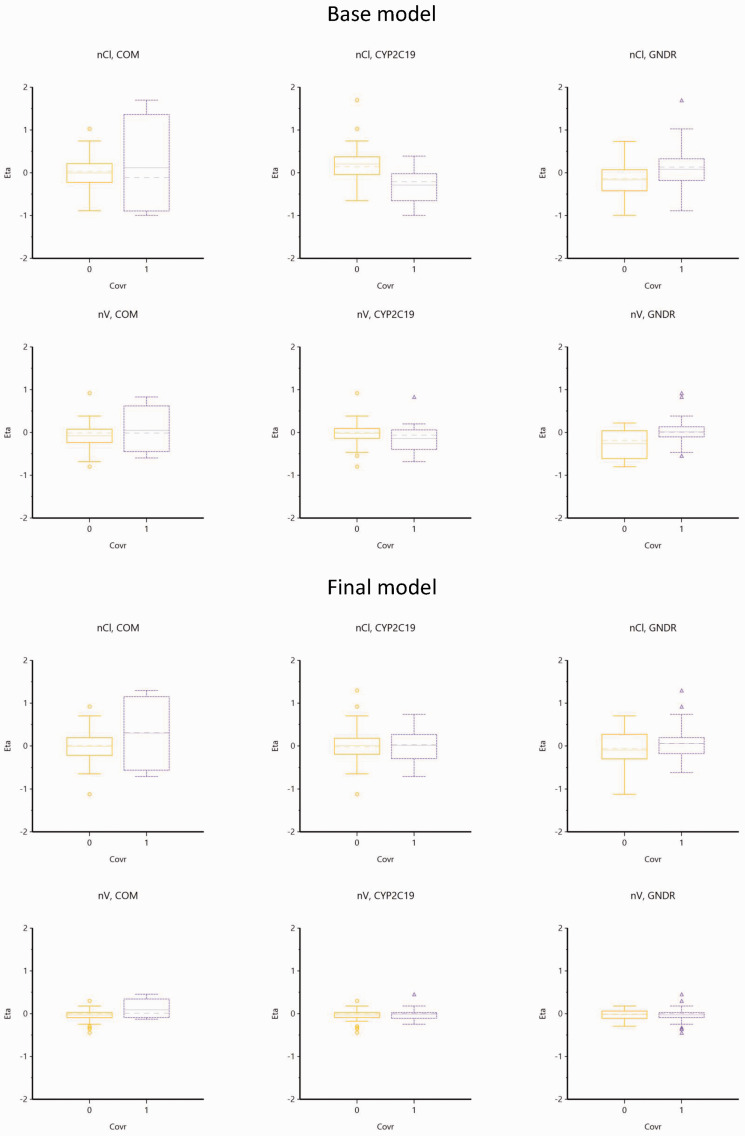
Figure 3 and Figure 4 are representations of the relationship of etas (η) and all the potential covariates.
Figure 3.
Scatter plots of etas and potential covariates in base and final models.
The blue lines are the locally weighted scatter plot smoothing.
Figure 4.
Box plots display the relationship between etas and potential covariates.
COM, 0; Single; 1, drug combination.
CYP2C19, 1, CYP2C19*1/*1; 2, CYP2C19*1/*2 or CYP2C19*1/*3 or CYP2C19*2/*2 or CYP2C19*3/*3 or CYP2C19*2/*3.
GNDR, 0, female, 1, male.
Model validation
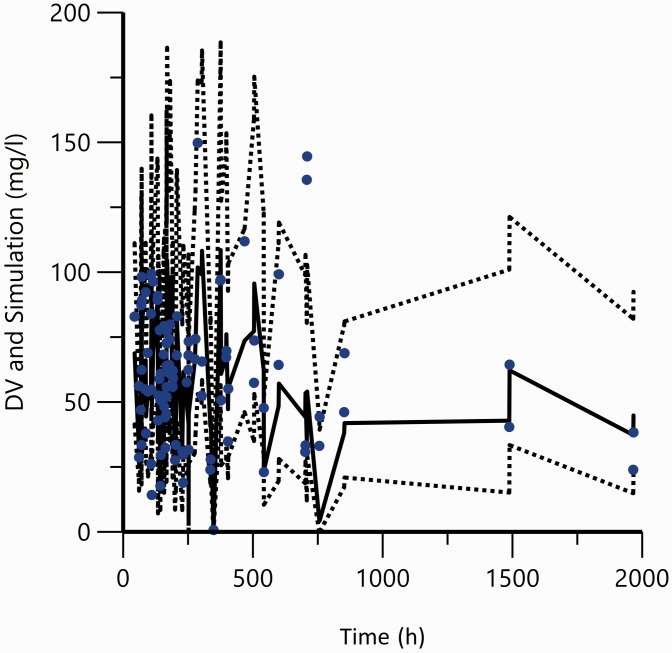
In the bootstrap analysis, 1976/2000 runs (98.8%) successfully converged. Based on the original dataset (Table 2), the medians of the parameter values estimated from the bootstrap were in agreement with the final parameters. This indicates the stability and robustness of the final pharmacokinetic model. VPCs with 2000 replicates for simulated VPA concentrations versus time, displayed a good harmony between simulations and observations (Figure 5). This suggests the presence of adequate predictive properties in the final population model.
Figure 5.
Visual predictive check plots of final population pharmacokinetic model.
Dots are the actual observations. The solid line represents predicted 50th percentile and the dotted lines are the 5th and 95th percentiles from the simulated observations. The 90% prediction interval is the area between the 5th and 95th percentiles.
Model simulation
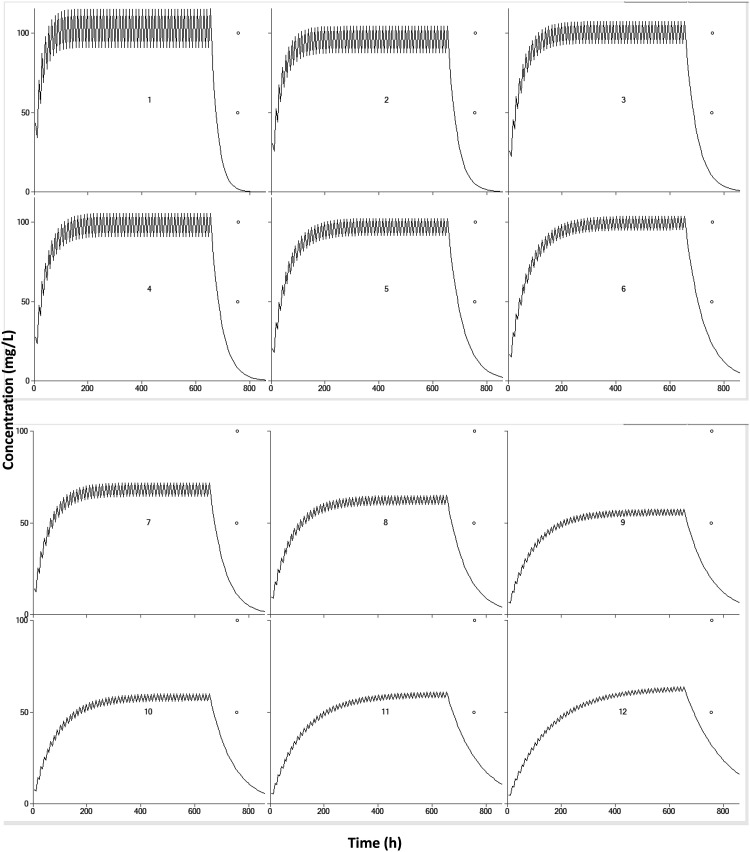
Monte Carlo simulations were conducted with the goal of obtaining trough concentration within 50 to 100 µg/ml during therapy. V does not affect maintaining the dose of the drug. Patients were, therefore, categorised by ALB level and CYP2C19 genotypes. VPA was administered orally twice daily. Table 3 has lists of the final dosing regimens. Whilst the maintenance dose decreased, the ALB level increased, and therefore, a higher dose was needed for patients with CYP2C19*1/*1 compared with patients with CYP2C19*1/*2, CYP2C19*1/*3, CYP2C19*2/*2, CYP2C19*3/*3, or CYP2C19*2/*3. The graphical representations to simulate the pharmacokinetic characteristics of the special population combined with clinical treatment are listed in Figure 6.
Table 3.
Maintenance dose (mg, twice daily) based on the CYP2C19 genotypes and albumin level.
| Genotypes |
Albumin (g/l) |
||
|---|---|---|---|
| 25–35 | 35–45 | 45–55 | |
| CYP2C19*1/*1 | 750–1200 | 500–800 | 350–650 |
| CYP2C19*1/*2 or *1/*3 or *2/*3 or *2/*3 or *2/*3 | 400–700 | 300–500 | 250–400 |
Figure 6.
Simulated concentrations versus time plots at different maintenance dose (milligrams, twice daily) based on the CYP2C19 genotypes and albumin level from Table 3.
1: 1200, 7: 750
2: 800, 8: 500
3: 650, 9: 350
4: 700, 10: 400
5: 500, 11: 300
6: 400, 12: 250.
Discussion
A summary of the reports that were published over the past 5 years on the covariates that affect VPA concentration is presented (Table S1). Most reports used PPK,1,4,5,7,16–19 whilst only one report intensively collected samples in adults using the two-compartment model.1 Both had sparse pharmacokinetic data and were fitted using a one-compartment model. To date, the reported Kas of VPA are, respectively, 2.38 hour−1,10 2.64 hour−1,3,7 and 1.9 hour−1.4,20,21 We tried all of them in the modelling process, and the goodness-of-fit was best when Ka was fixed to 2.38 hour−1. Furthermore, this value was estimated based on the Chinese population and we used immediate release tablets/solutions instead of sustained-release tablets in this research, and thus, we thought that this was suitable for our pharmacokinetic data. The genetic factors affecting VPA pharmacokinetics/metabolism in vivo include ABCC2, CYP2A6, CYP2C9, CYP2C19, LEPR, the UGT series genes, and the SCN series genes.4,7,8,17,22,23 The following physiological factors were included: weight, age, gender, height, and body surface area.5 Pathological factors included the epilepsy type and liver and kidney function, whilst other factors that were included comprised medication and total daily dose. Introducing VPA into the body means that there are two forms that are present in the blood, unbound and protein-bound, which are in dynamic equilibrium in the body. Only unbound drugs can be metabolised; VPA is a high protein-binding drug, particularly with albumin. More drugs are found to be present in an unbound form where the albumin content in the blood decreases, thereby increasing the CL rate. This study reports, for the first time, that albumin levels have a significant effect on VPA CL and recommends that the patients’ albumin levels should be checked before dosing.
In a previous study, Jiang et al.24 found that CYP2C19 and CYP2C9 genotypes influenced the PK variability of VPA. Small differences compared with normal CL/F were observed, as follows: 0.3697, 0.3670, and 0.3644 L/hour for wild type, heterozygous, and homozygous genotypes, respectively. However, no significant effects of CYP2C9 and CYP2C19 genotypes on VPA PPK were found in many studies.4,25,26
This study also detected the polymorphisms CYP2C19*2, *3 and *17 in patients; CYP2C19 rs4244285 (c.681G>A), which is the defining polymorphism of the CYP2C19*2 allele, is a synonymous G>A transition in exon 5 that creates an aberrant splice site. Any changes in this genetic polymorphism would alter the mRNA reading frame and subsequently result in a truncated, non-functional protein.27 CYP2C19 rs4986893 (c.636G>A), the defining polymorphism of the CYP2C19*3 allele, is a G>A transition in exon 4, which results in a premature termination codon at amino acid 212 (p.W212X).28 Cyp2c19*3 allele frequencies were lower than 1% in most populations, whilst it is more widespread in Asians (2% to 9%).29 CYP2C19 rs12248560 (c.-806C>T) is the defining polymorphism of the CYP2C19*17 allele, and it is also a C>T transition into a promoter that creates a consensus binding site for the GATA transcription factor family to increase CYP2C19 expression and activity.30–32
Patients can be classified as ultrarapid (UM), extensive (EM), intermediate (IM), or poor metabolisers (PM) based simply on the ability of metabolising CYP2C19 substrates. EM individuals are homozygous for the CYP2C19*1 allele, which is related to functional CYP2C19-mediated metabolism. The IM genotype includes one each of the wild-type allele and variant allele, which encodes reduced or absent enzyme functions (e.g., *1/*2, *1/*3); this resulted in decreased CYP2C19 activity.33 PM individuals have two loss-of-function alleles (e.g., *2/*2, *2/*3, *3/*3), which result in markedly reduced or absent CYP2C19 activity.33,34 In this study patients were separated into two groups: extensive metabolisers (*1/*1), and non-extensive metabolisers (*1/*2, *1/*3, *2/*2, *2/*3, *3/*3).
During the modelling process (Table S2), the patient’s gender was found to have a significant effect on V, but the effect on CL was small. V can affect the loading dose, but it has little effect on the maintenance dose. During the simulation, it was found that where a patient was given VPA for the first time, the effect of gender on the trough concentration was significant and was reached only after multiple administrations. Once VPA steady-state levels were achieved, the impact of gender on the trough concentration became negligible. Because VPA is usually given on a long-term basis, a patient’s gender was not taken into consideration in the model simulation, meaning that this medication regimen is applicable to both men and women (Table 3).
Concomitant medications are important factors that are known to significantly affect the behaviour of VPA in vivo, such as in combination with aztreonam, imipenem, and meropenem. These medications may decrease VPA concentrations and evoke seizures. It is necessary to perform the following: clinical monitoring, TDM, and timely adjustment of anticonvulsant drug dose during the anti-infective treatment. TDM should also be continued even after antibiotic cessation. The induction of hepatic metabolism by carbamazepine can reduce plasma concentration in VPA. In combination with felbamate, the blood concentration of VPA is increased, which may cause the risk of an overdose; but the induction of hepatic metabolism by phenobarbital or primidone reduces the plasma VPA concentration. However, only four patients who were involved in the study took additional drugs that could affect the VPA concentration. This proportion was too small, and it led to the failure of the study to identify the effect of the combination on the drug pharmacokinetic process in VPA.
The study has the following limitations: (1) There was no sample size calculation, and the limited number of samples may affect the statistical significance of the results. Because the sample size was small, the sampling points were sparse. To validate the results a larger clinical trial is necessary; (2) In many clinical cases, it is necessary to combine VPA with other drugs but the relevant covariates were not included in our model. Therefore, the results do not apply to patients with combined drug treatments that interact with VPA; and (3) There are other genetic variants that could potentially affect the metabolism and CL of VPA. However this study only detected CYP2C19. Larger numbers of genetic tests are required to detect other critical genetic variants that affect VPA pharmacodynamic in vivo.
In conclusion, this study enrolled epilepsy patients of Chinese ethnicity and nonlinear mixed-effect modelling was used to construct a population pharmacokinetic model of VPA in Chinese patients. This was done by screening out the fact that gender could affect V, whereas the CYP2C19 genotype and albumin levels can affect drug CL for VPA. On the basis of the simulation results of the model, a table of individualised medications that were based on genotype and albumin levels was constructed to help physicians to implement these regimens.
Supplemental Material
Supplemental material, sj-pdf-1-imr-10.1177_0300060520952281 for Impact of gender, albumin, and CYP2C19 polymorphisms on valproic acid in Chinese patients: a population pharmacokinetic model by Jinlin Guo, Yayu Huo, Fang Li, Yuanping Li, Zhaojun Guo, Huaqing Han and Yuhong Zhou in Journal of International Medical Research
Declaration of conflicting interest
The authors declare that there is no conflict of interest.
Funding
The authors disclosed receipt of the following financial support for the research, authorship, and/or publication of this article: Funding for this research was obtained from the scientific research fund of Taiyuan Iron & Steel (Group) Corporation (ID: 201714).
ORCID iDs
Jinlin Guo https://orcid.org/0000-0001-8756-1190
Supplemental material
Supplemental material for this article is available online.
References
- 1.Jawien W, Wilimowska J, Klys M, et al. Population pharmacokinetic modelling of valproic acid and its selected metabolites in acute VPA poisoning. Pharmacol Rep 2017; 69: 340–349. DOI: 10.1016/j.pharep.2016.12.003. [DOI] [PubMed] [Google Scholar]
- 2.Bi J, Li X, Liu J, et al. Population pharmacokinetics of peginterferon alpha2a in patients with chronic hepatitis B. Sci Rep 2017; 7: 7893. DOI: 10.1038/s41598-017-08205-5. [DOI] [PMC free article] [PubMed] [Google Scholar]
- 3.Ding J, Wang Y, Lin W, et al. A population pharmacokinetic model of valproic acid in pediatric patients with epilepsy: a non-linear pharmacokinetic model based on protein-binding saturation. Clin Pharmacokinet 2015; 54: 305–317. DOI: 10.1007/s40262-014-0212-8. [DOI] [PubMed] [Google Scholar]
- 4.Xu S, Chen Y, Zhao M, et al. Population pharmacokinetics of valproic acid in epileptic children: Effects of clinical and genetic factors. Eur J Pharm Sci 2018; 122: 170–178. DOI: 10.1016/j.ejps.2018.06.033. [DOI] [PubMed] [Google Scholar]
- 5.Rodrigues C, Chhun S, Chiron C, et al. A population pharmacokinetic model taking into account protein binding for the sustained-release granule formulation of valproic acid in children with epilepsy. Eur J Clin Pharmacol 2018; 74: 793–803. DOI: 10.1007/s00228-018-2444-2. [DOI] [PubMed] [Google Scholar]
- 6.Methaneethorn J. A systematic review of population pharmacokinetics of valproic acid. Br J Clin Pharmacol 2018; 84: 816–834. DOI: 10.1111/bcp.13510. [DOI] [PMC free article] [PubMed] [Google Scholar]
- 7.Mei S, Feng W, Zhu L, et al. Effect of CYP2C19, UGT1A8, and UGT2B7 on valproic acid clearance in children with epilepsy: a population pharmacokinetic model. Eur J Clin Pharmacol 2018; 74: 1029–1036. DOI: 10.1007/s00228-018-2440-6. [DOI] [PubMed] [Google Scholar]
- 8.Chen J, Su QB, Tao YQ, et al. ABCC2 rs2273697 is associated with valproic acid concentrations in patients with epilepsy on valproic acid monotherapy. Pharmazie 2018; 73: 279–282. DOI: 10.1691/ph.2018.7344. [DOI] [PubMed] [Google Scholar]
- 9.Li X, Sun S, Ling X, et al. Plasma and cerebrospinal fluid population pharmacokinetics of vancomycin in postoperative neurosurgical patients after combined intravenous and intraventricular administration. Eur J Clin Pharmacol 2017; 73: 1599–1607. DOI: 10.1007/s00228-017-2313-4. [DOI] [PubMed] [Google Scholar]
- 10.Dechun J, Li W, Wei L. . Population pharmacokinetics of valproate in children with epilepsy by NONMEM. Chinese Pharmaceutical Journal 2007; 42: 291–294, 317. Research Paper. [Google Scholar]
- 11.Li X, Wu Y, Sun S, et al. Population pharmacokinetics of vancomycin in postoperative neurosurgical patients and the application in dosing recommendation. J Pharm Sci 2016; 105: 3425–3431. DOI: 10.1016/j.xphs.2016.08.012. [DOI] [PubMed] [Google Scholar]
- 12.Li X, Sun S, Wang Q, et al. Population pharmacokinetics of combined intravenous and local intrathecal administration of meropenem in aneurysm patients with suspected intracranial infections after craniotomy. Eur J Drug Metab Pharmacokinet 2018; 43: 45–53. DOI: 10.1007/s13318-017-0422-1. [DOI] [PubMed] [Google Scholar]
- 13.Li X, Wu Y, Sun S, et al. Factors influencing norvancomycin concentration in plasma and cerebrospinal fluid in patients after craniotomy and dosing guideline: a population approach. Clin Ther 2018; 40: 74–82.e1. DOI: 10.1016/j.clinthera.2017.11.005. [DOI] [PubMed] [Google Scholar]
- 14.Li X, Wang X, Wu Y, et al. Plasma and cerebrospinal fluid population pharmacokinetic modeling and simulation of meropenem after intravenous and intrathecal administration in postoperative neurosurgical patients. Diagn Microbiol Infect Dis 2019; 93: 386–392. DOI: 10.1016/j.diagmicrobio.2018.08.003. [DOI] [PubMed] [Google Scholar]
- 15.Wang H, Li X, Sun S, et al. Population pharmacokinetics and dosing simulations of ceftazidime in Chinese neonates. J Pharm Sci 2018; 107: 1416–1422. DOI: 10.1016/j.xphs.2017.12.018. [DOI] [PubMed] [Google Scholar]
- 16.Methaneethorn J. Population pharmacokinetics of valproic acid in patients with mania: implication for individualized dosing regimens. Clin Ther 2017; 39: 1171–1181. DOI: 10.1016/j.clinthera.2017.04.005. [DOI] [PubMed] [Google Scholar]
- 17.Nakashima H, Oniki K, Nishimura M, et al. Determination of the optimal concentration of valproic acid in patients with epilepsy: a population pharmacokinetic-pharmacodynamic analysis. PLoS One 2015; 10: e0141266. DOI: 10.1371/journal.pone.0141266. [DOI] [PMC free article] [PubMed] [Google Scholar]
- 18.Schoemaker R, Wade JR, Stockis A. Brivaracetam population pharmacokinetics in children with epilepsy aged 1 month to 16 years. Eur J Clin Pharmacol 2017; 73: 727–733. DOI: 10.1007/s00228-017-2230-6. [DOI] [PMC free article] [PubMed] [Google Scholar]
- 19.Xu S, Liu L, Chen Y, et al. Population pharmacokinetics of lamotrigine co-administered with valproic acid in Chinese epileptic children using nonlinear mixed effects modeling. Eur J Clin Pharmacol 2018; 74: 583–591. DOI: 10.1007/s00228-018-2414-8. [DOI] [PubMed] [Google Scholar]
- 20.Botha JH, Gray AL, Miller R. A model for estimating individualized valproate clearance values in children. J Clin Pharmacol 1995; 35: 1020–1024. DOI: 10.1002/j.1552-4604.1995.tb04020.x. [DOI] [PubMed] [Google Scholar]
- 21.Serrano BB, Garcia Sanchez MJ, Otero MJ, et al. Valproate population pharmacokinetics in children. J Clin Pharm Ther 1999; 24: 73–80. DOI: 10.1046/j.1365-2710.1999.00202.x. [DOI] [PubMed] [Google Scholar]
- 22.Du Z, Jiao Y, Shi L. Association of UGT2B7 and UGT1A4 polymorphisms with serum concentration of antiepileptic drugs in children. Med Sci Monit 2016; 22: 4107–4113. DOI: 10.12659/msm.897626. [DOI] [PMC free article] [PubMed] [Google Scholar]
- 23.Zhao M, Zhang T, Li G, et al. Associations of CYP2C9 and CYP2A6 polymorphisms with the concentrations of valproate and its hepatotoxin metabolites and valproate-induced hepatotoxicity. Basic Clin Pharmacol Toxicol 2017; 121: 138–143. DOI: 10.1111/bcpt.12776. [DOI] [PubMed] [Google Scholar]
- 24.Jiang D, Bai X, Zhang Q, et al. Effects of CYP2C19 and CYP2C9 genotypes on pharmacokinetic variability of valproic acid in Chinese epileptic patients: nonlinear mixed-effect modeling. Eur J Clin Pharmacol 2009; 65: 1187–1193. DOI: 10.1007/s00228-009-0712-x. [DOI] [PubMed] [Google Scholar]
- 25.Guo Y, Hu C, He X, et al. Effects of UGT1A6, UGT2B7, and CYP2C9 genotypes on plasma concentrations of valproic acid in Chinese children with epilepsy. Drug Metab Pharmacokinet 2012; 27: 536–542. DOI: 10.2133/dmpk.dmpk-11-nt-144. [DOI] [PubMed] [Google Scholar]
- 26.Smith RL, Haslemo T, Refsum H, et al. Impact of age, gender and CYP2C9/2C19 genotypes on dose-adjusted steady-state serum concentrations of valproic acid-a large-scale study based on naturalistic therapeutic drug monitoring data. Eur J Clin Pharmacol 2016; 72: 1099–1104. DOI: 10.1007/s00228-016-2087-0. [DOI] [PubMed] [Google Scholar]
- 27.De Morais SM, Wilkinson GR, Blaisdell J, et al. The major genetic defect responsible for the polymorphism of S-mephenytoin metabolism in humans. J Biol Chem 1994; 269: 15419–15422. [PubMed] [Google Scholar]
- 28.De Morais SM, Wilkinson GR, Blaisdell J, et al. Identification of a new genetic defect responsible for the polymorphism of (S)-mephenytoin metabolism in Japanese. Mol Pharmacol 1994; 46: 594–598. [PubMed] [Google Scholar]
- 29.Scott SA, Sangkuhl K, Gardner EE, et al. Clinical Pharmacogenetics Implementation Consortium guidelines for cytochrome P450-2C19 (CYP2C19) genotype and clopidogrel therapy. Clin Pharmacol Ther 2011; 90: 328–332. DOI: 10.1038/clpt.2011.132. [DOI] [PMC free article] [PubMed] [Google Scholar]
- 30.Sim SC, Risinger C, Dahl ML, et al. A common novel CYP2C19 gene variant causes ultrarapid drug metabolism relevant for the drug response to proton pump inhibitors and antidepressants. Clin Pharmacol Ther 2006; 79: 103–113. DOI: 10.1016/j.clpt.2005.10.002. [DOI] [PubMed] [Google Scholar]
- 31.Rudberg I, Mohebi B, Hermann M, et al. Impact of the ultrarapid CYP2C19*17 allele on serum concentration of escitalopram in psychiatric patients. Clin Pharmacol Ther 2008; 83: 322–327. DOI: 10.1038/sj.clpt.6100291. [DOI] [PubMed] [Google Scholar]
- 32.Sibbing D, Koch W, Gebhard D, et al. Cytochrome 2C19*17 allelic variant, platelet aggregation, bleeding events, and stent thrombosis in clopidogrel-treated patients with coronary stent placement. Circulation 2010; 121: 512–518. DOI: 10.1161/CIRCULATIONAHA.109.885194. [DOI] [PubMed] [Google Scholar]
- 33.Desta Z, Zhao X, Shin JG, et al. Clinical significance of the cytochrome P450 2C19 genetic polymorphism. Clin Pharmacokinet 2002; 41: 913–958. DOI: 10.2165/00003088-200241120-00002. [DOI] [PubMed] [Google Scholar]
- 34.Brosen K, De Morais SM, Meyer UA, et al. A multifamily study on the relationship between CYP2C19 genotype and s-mephenytoin oxidation phenotype. Pharmacogenetics 1995; 5: 312–317. [DOI] [PubMed] [Google Scholar]
Associated Data
This section collects any data citations, data availability statements, or supplementary materials included in this article.
Supplementary Materials
Supplemental material, sj-pdf-1-imr-10.1177_0300060520952281 for Impact of gender, albumin, and CYP2C19 polymorphisms on valproic acid in Chinese patients: a population pharmacokinetic model by Jinlin Guo, Yayu Huo, Fang Li, Yuanping Li, Zhaojun Guo, Huaqing Han and Yuhong Zhou in Journal of International Medical Research


