Abstract
Conventional type 1 dendritic cells (cDC1s1) are thought to perform antigen cross-presentation required to prime CD8 T cells2,3, while cDC2 are considered specialized for priming CD4 T cells4,5. CD4 T cells are also thought to help CD8 T cell responses through a variety of mechanisms6–11, including a model in which CD4 T cells ‘license’ cDC1 for CD8 T cell priming12. However, this model has not been directly tested in vivo or in the setting of a help-dependent tumour rejection. Here, we generated an Xcr1-Cre mouse strain to evaluate the cellular interactions that mediate tumour rejection in a model requiring CD4 and CD8 T cells. As expected, tumour rejection required cDC1, and expression of MHC-I by cDC1. Unexpectedly, early priming of CD4 T cell against tumour-derived antigens also required cDC1, which was not simply due to a role in antigen transport to lymph nodes for processing by cDC2, since selective deletion of MHC-II in cDC1 also prevented early CD4 T cell priming. Further, deletion of either MHC-II or CD40 in cDC1 impaired tumour rejection, consistent with a role for cognate CD4 T cell interactions and CD40 signaling in cDC1 licensing. Finally, CD40 signaling in cDC1 was critical not only for CD8 T cell priming, but also for initial CD4 T cell activation. Thus, in the setting of tumour-derived antigens, cDC1 function as an autonomous platform capable of antigen processing and priming for both CD4 and CD8 T cells and directly orchestrating their cross-talk required for optimal anti-tumour immunity.
Main
CD4 T cell help for CD8 T cell responses has been suggested to be mediated by CD40-dependent licensing of APCs7,8,13. cDC1 were suggested as the target of CD4 T cell help by in vitro analysis14 and intravital imaging during viral infection15,16. Other mechanisms to explain CD4 T cell help include production of IL-211, prevention of TRAIL expression by CD8 T cells10 and direct activation of CD40 signaling in CD8 T cells9. But despite extensive analysis, the requirement for cDC1 in mediating CD4 T cell help in vivo has not been directly established.
Previous studies suggested that CD4 T cells are primed predominantly by cDC2, based on their superior MHC-II antigen presentation of soluble ovalbumin (OVA) or OVA coupled to antibodies targeted to Fc or other surface receptors4,17. In agreement, Irf4–/– mice, which exhibit impaired cDC2 migration18, show reduced CD4 T responses in the intestine and lung to allergens or fungal infections19,20. However, for cell-associated antigens, some studies21,22 report lower MHC-II processing by cDC2 compared with cDC1. A recent study in a tumour model observed that cDC2 induce CD4 T cell proliferation at an advanced stage of tumour growth, but did not examine the ability of these CD4 T cells to provide help for CD8 T cell responses5. In summary, it is not known whether cDC1 or cDC2 are responsible for priming CD4 T cells that help anti-tumour CD8 T cell responses.
CD4 T cells support anti-tumour responses during primary and secondary challenge
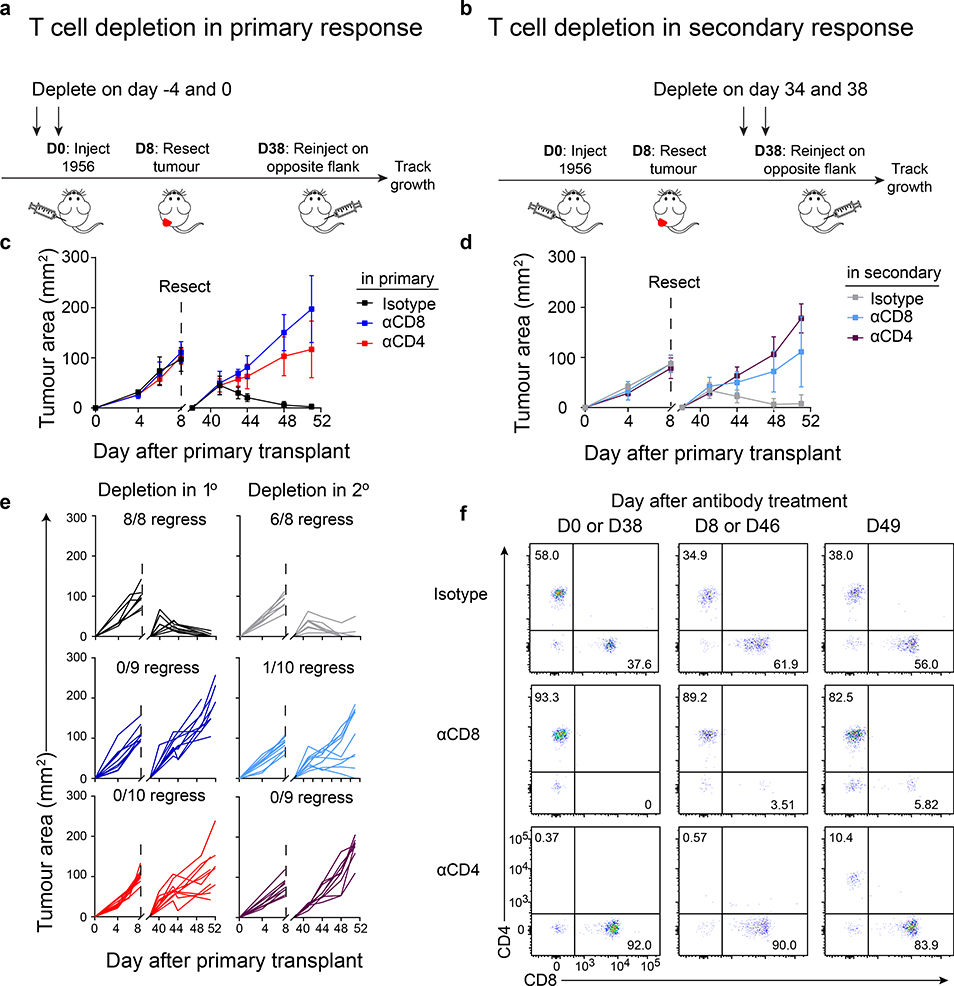
CD4 T cells are required for generating and maintaining CD8 T cell memory in response to pathogens23,24. To determine the role of CD4 T cells in anti-tumour immunity, we used a methylcholanthrene (MCA)-induced progressor fibrosarcoma (1956) that is not initially rejected in wild type mice (WT), but is known to induce immunological memory25. Tumours were implanted for 8 days to induce memory and were surgically resected (Fig. 1a,b). T cell memory was indicated by the subsequent rejection of tumours on the contralateral flank. Upon secondary challenge, tumour rejection was prevented by the depletion of CD8 T cells during either primary or secondary challenge (Fig. 1c–e), consistent with formation of CD8 T cell memory25. Depletion of CD4 T cells during the primary tumour challenge prevented tumour rejection during the secondary challenge (Fig. 1c,e). Likewise, depletion of CD4 T cells during secondary tumour challenge also prevented tumour rejection (Fig. 1d,e). Further, CD4 T cells were required early in the tumour immune response since CD4 T cells returned at approximately one week after depletion (Fig. 1f). Unlike results with L. monocytogenes infection in which CD4 T cell help was not required for CD8 T cell recall responses23, our results are in agreement with the recent finding that MHC-II tumour epitopes are potentially required at the tumour site to augment CD8 T cell-dependent tumour rejection26,27.
Figure 1. CD4 T cells are required during primary and secondary tumour responses.
a, Schematic of T cell depletions during primary tumour response.
b, Schematic of T cell depletions during secondary tumour response.
c, Tumour growth curves of mice depleted of CD4 or CD8 T cells during the primary 1956 tumour implantation. Data represent mean ± S.D. pooled biologically independent samples from two independent experiments (n=8 istotype, n=9 αCD8, n=10 αCD4).
d, Tumour growth curves of mice depleted of CD4 or CD8 T cells during the secondary 1956 tumour implantation. Data represent mean ± S.D. pooled biologically independent samples from two independent experiments (n=8 istotype, n=10 αCD8, n=9 αCD4).
e, Individual mouse tumour growth curves of CD4 or CD8 T cells depleted in the (left) primary or (right) secondary 1956 tumour implantation.
f, Peripheral blood T cell populations after CD4 or CD8 depletion.
cDC1 are required to prime CD4 T cell responses to cell-associated tumour antigens
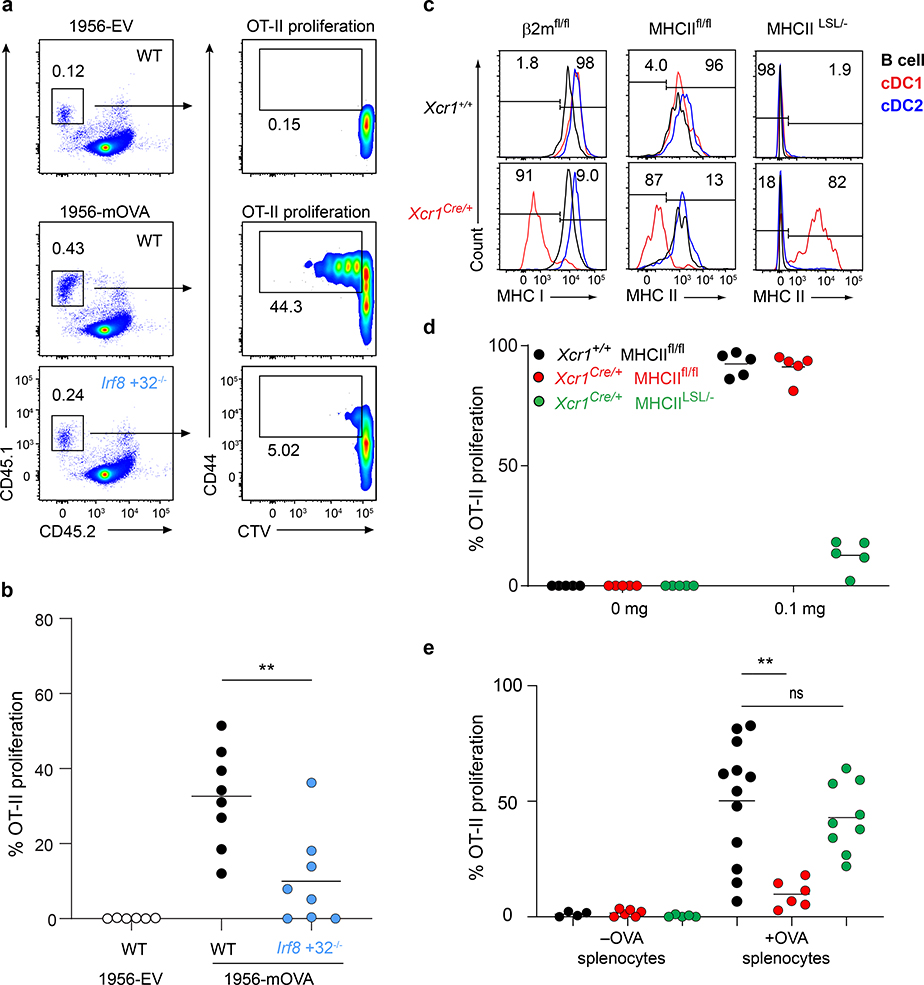
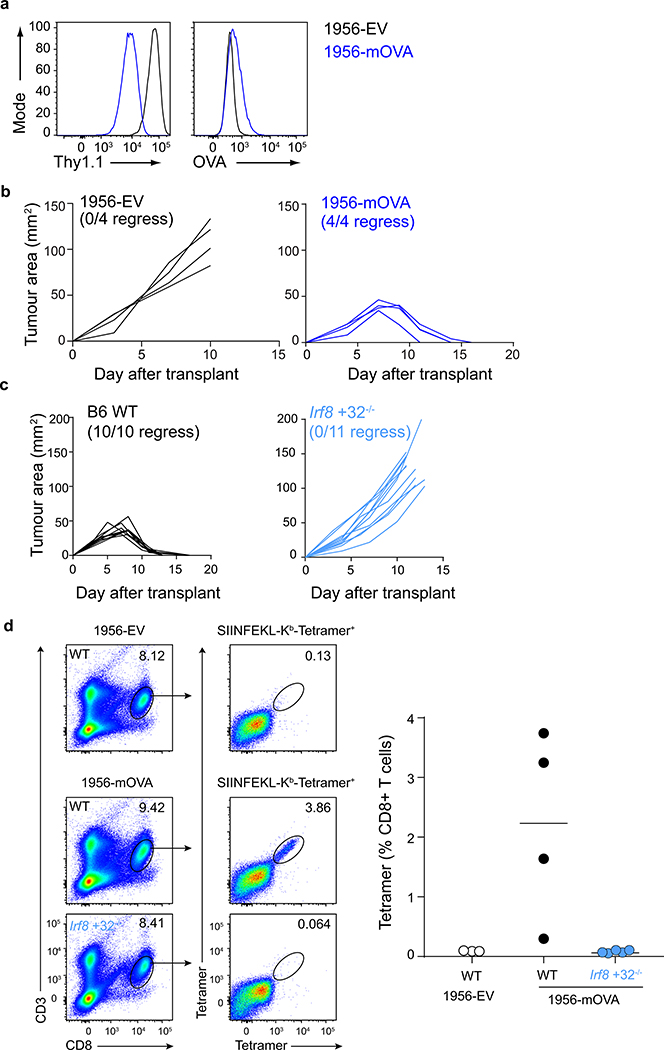
The role of cDC1 in priming CD4 T cells is unclear, with some studies showing inherently less efficient MHC-II antigen presentation compared with cDC2 cells4,5,17, while others suggesting an important role in CD4 T cell priming21,28. To evaluate CD4 T cell priming in the setting of tumour rejection, we examined T cell responses to a modified 1956 fibrosarcoma that expresses membrane-associated OVA (1956-mOVA)29 or an empty vector (1956-EV) control (Extended Data Fig. 1a). The expression of mOVA converts 1956 into a regressor tumour that is cleared by WT mice (Extended Data Fig. 1b). This rejection is dependent on CD8 T cells, since Irf8 +32−/− mice, which lack cDC130, failed to reject 1956-mOVA tumours (Extended Data Fig. 1c). Further, SIINFEKL-H-2Kb tetramer+ CD8 T cells expanded in WT mice in response to 1956-mOVA, but were absent in mice lacking cDC1 (Extended Data Fig. 1d). We next examined early CD4 T cell proliferation in response to 1956-mOVA (Fig. 2a,b) by transferring OVA-specific OT-II transgenic CD4 T cells into tumour-bearing mice. OT-II cells underwent cell division in tumour-draining lymph nodes in WT mice, consistent with recognition of OVA323–339 pMHC-II complexes on some APC. By contrast, the proliferation of OT-II cells was markedly reduced in Irf8 +32−/− mice lacking cDC1 (Fig. 2a,b). In summary, in the context of the 1956-mOVA tumour model, cDC1 acts as the primary APC for early presentation to naïve CD4 T cells.
Figure 2. cDC1 are superior at presenting cell-associated material.
a, Representative flow plots of percent proliferated OT-II transferred into WT B6 and Irf8 +32−/− mice injected with 106 1956-EV or 106 1956-mOVA.
b, Graph of percent proliferated OT-II in a. Data are pooled biologically independent samples from three independent experiments (n=6 for WT 1956-EV, n=8 for all other groups). ** p=0.007 (unpaired, two-tailed Mann-Whitney test).
c, (Top) Xcr1+/+ and (bottom) Xcr1Cre/+ splenic APCs stained for MHC-I and MHC-II expression from (left) β2mfl/fl, (middle) MHCIIfl/fl, and (right) MHCIILSL/- mice.
d, Graph of percent proliferated OT-II transferred into Xcr1+/+ MHCIIfl/fl, Xcr1Cre/+ MHCIIfl/fl, and Xcr1Cre/+ MHCIILSL/- immunized with soluble OVA on day 0. Data are pooled biologically independent samples from two independent experiments (n=5 for all groups).
e, Graph of percent proliferated OT-II transferred into Xcr1+/+ MHCIIfl/fl, Xcr1Cre/+ MHCIIfl/fl, and Xcr1Cre/+ MHCIILSL/- immunized with cell-associated OVA on day 0. Data are pooled biologically independent samples from four independent experiments (n=4 for Xcr1+/+ MHCIIfl/fl -OVA, n=6 for Xcr1Cre/+ MHCIIfl/fl -OVA, n= 5 for Xcr1Cre/+ MHCIILSL/- -OVA, n=12 for Xcr1+/+ MHCIIfl/fl +OVA, n=6 for Xcr1Cre/+ MHCIIfl/fl +OVA, n=9 for Xcr1Cre/+ MHCIILSL/- +OVA). ** p=0.002 (unpaired, two-tailed Mann-Whitney test).
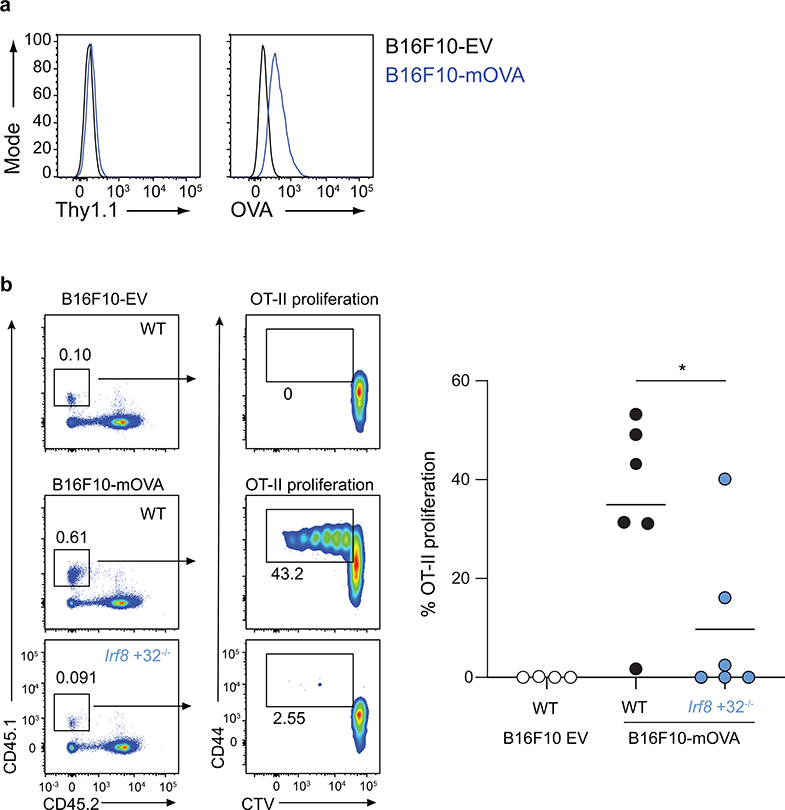
To test this result in another tumour model, we generated a B16F10 melanoma cell line that stably expresses membrane-associated OVA (B16F10-mOVA), and as a control, B16F10 cells that express only the empty retroviral vector (B16F10-EV) (Extended Data Fig. 2a). We examined in vivo CD4 T cell proliferation in response to B16F10-mOVA using adoptively transferred OT-II T cells into tumour-bearing mice (Extended Data Fig. 2b). Again, early OT-II proliferation was robust after transfer into WT mice, but was markedly reduced in Irf8 +32−/− mice that lack cDC1, similar to results using 1956-mOVA tumours (Fig. 2a,b). These results suggest that cDC1 may generally function as APCs for CD4 T cells in response to cell-associated tumour antigens.
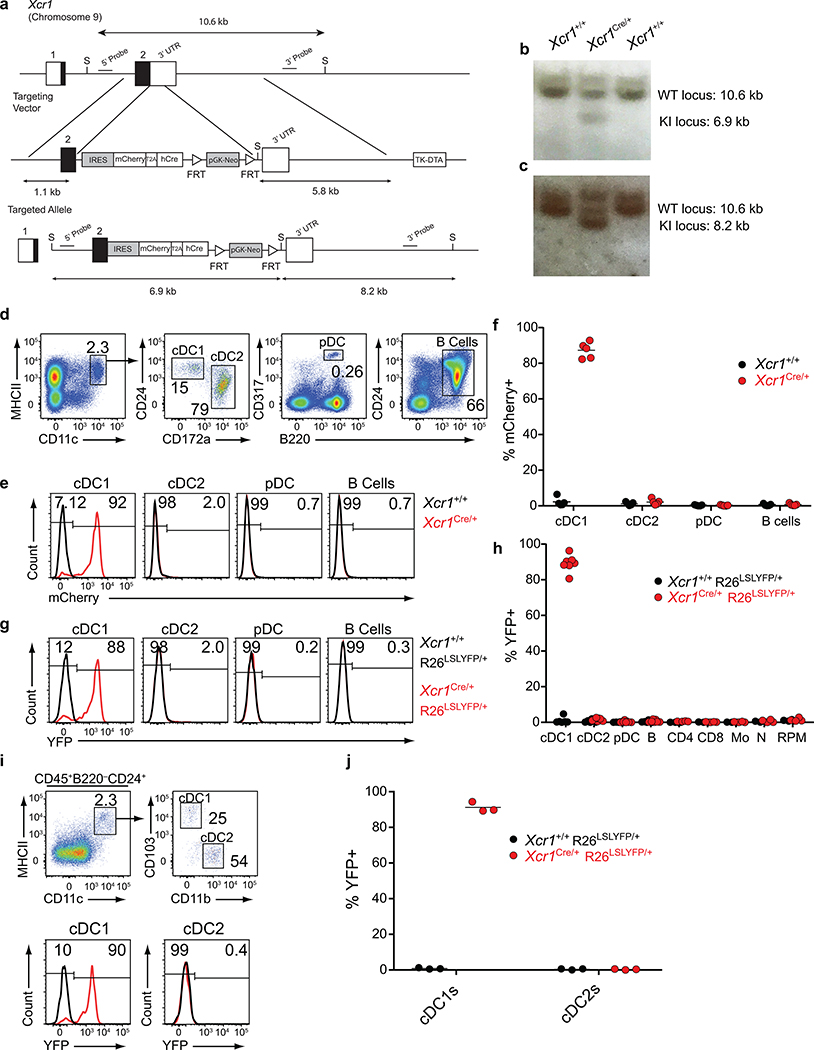
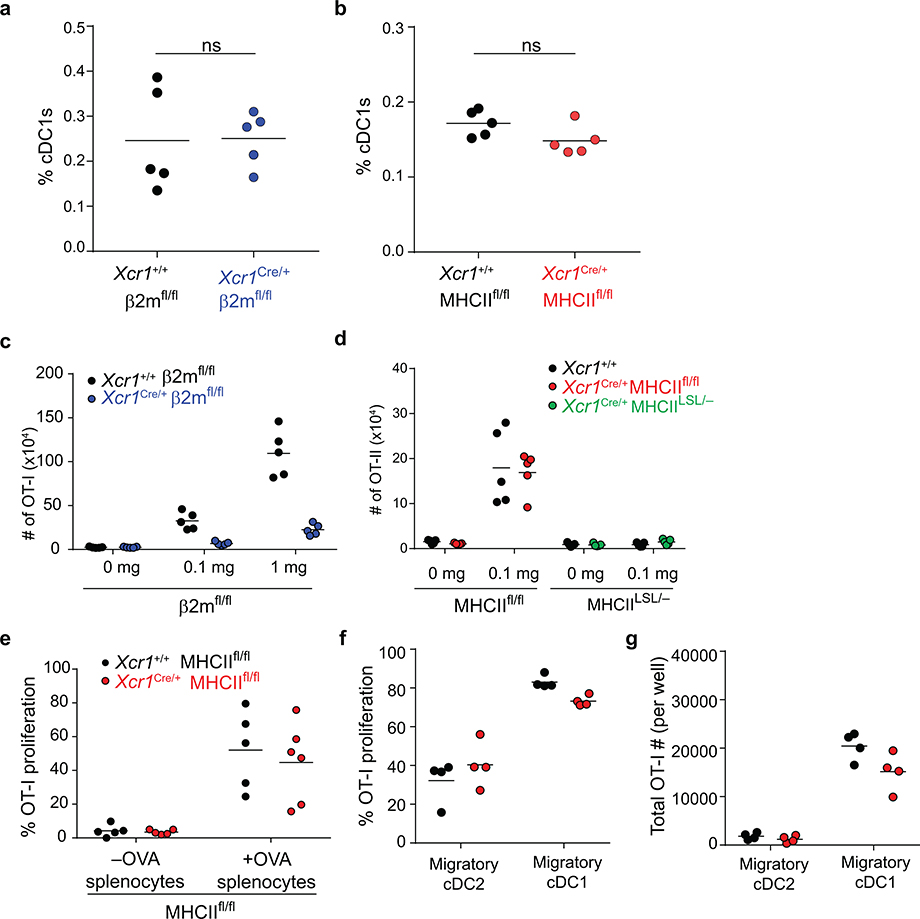
Our finding that cDC1 are required for CD4 T cell priming could result from a possible role to transport antigens to draining lymph nodes, where antigens could be transferred to cDC2 for presentation to CD4 T cells. In this case, MHC-II expression by cDC1 should be dispensable for CD4 T cell priming. To test this, we generated an Xcr1Cre mouse strain to allow for conditional inactivation of MHC-II expression specifically in cDC1 (Extended Data Fig. 3a–c). In mice with one Xcr1Cre allele (Xcr1Cre/+), mCherry and Cre activity, as reported by Rosa26-lox stop lox-eYFP (R26LSLYFP)31, are expressed specifically in cDC1, but not in cDC2 or other immune lineages (Extended Data Fig. 3d–j). Xcr1Cre efficiently deleted MHC-I and MHC-II surface expression from cDC1, but not other lineages, when crossed with floxed alleles of β2-microglobulin (β2mfl)32 and H2-Ab1 (MHCIIfl)33, respectively (Fig. 2c, Extended Data Figures 4–6). Further, by crossing Xcr1Cre with H2-Ab1 stopf/f (MHCIILSL)34, we achieved MHC-II expression exclusively by cDC1, but not by other lineages (Fig. 2c). In mice lacking either MHC-I or MHC-II specifically on the cDC1, cDC1 development was normal (Extended Data Fig. 6a, b).
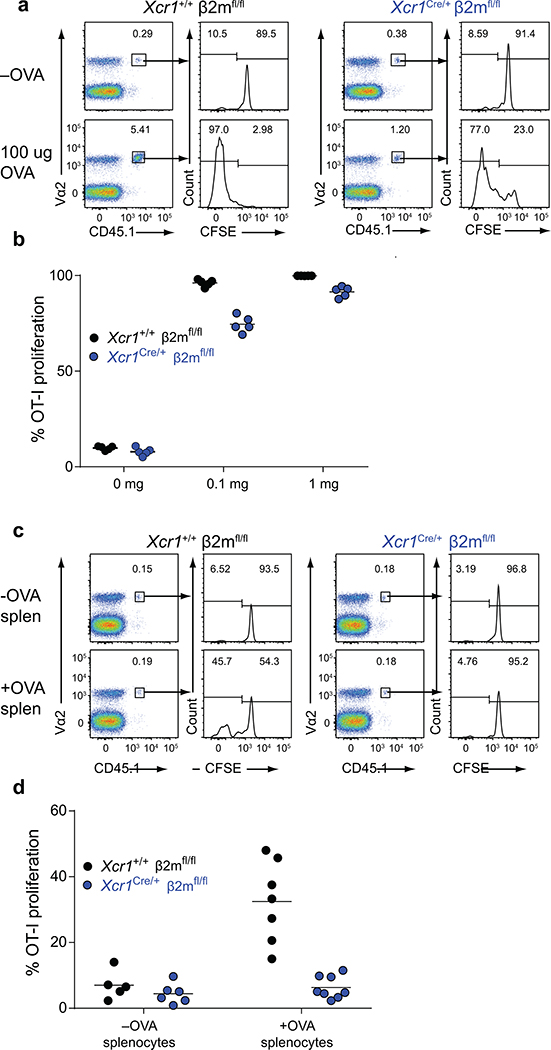
As a control, we first examined mice lacking MHC-I expression on cDC1. We first transferred OVA-specific OT-I transgenic CD8 T cells and immunized with different forms of antigen. In this setting, OT-I proliferation was only partially reduced in response to soluble OVA in Xcr1Cre/+ β2mfl/fl compared to Xcr1+/+ β2mfl/fl mice, but was completely absent in Xcr1Cre/+ β2mfl/fl mice in response to cell associated antigens (Extended Data Fig. 4, and Extended Data Fig. 6c), in agreement with our recent report that cDC2 efficiently cross-present soluble, but not cell-associated, antigens in vivo22.
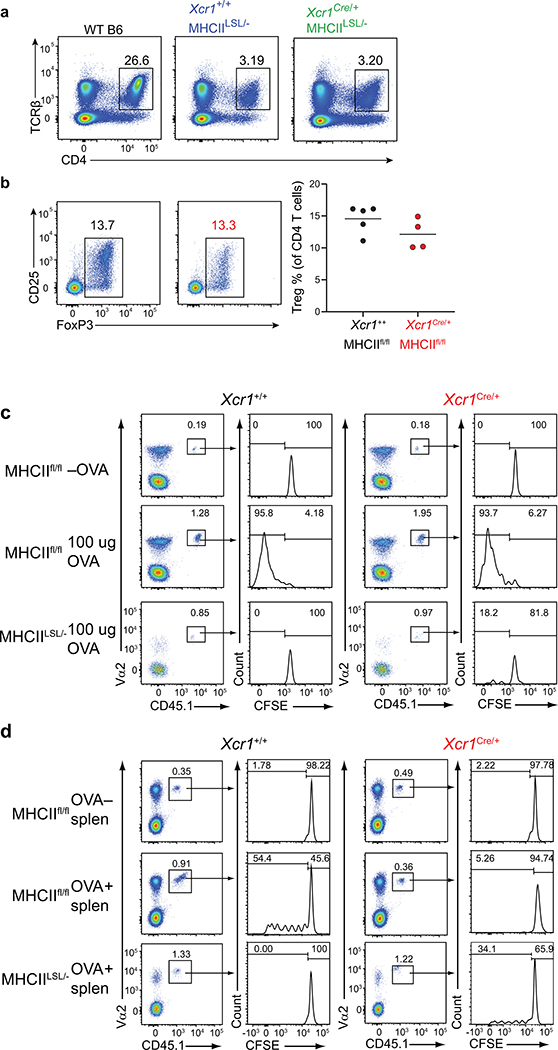
We next evaluated OT-II proliferation in Xcr1Cre/+ MHCIIfl/fl mice (Fig. 2d,e). OT-II cells proliferated in response to soluble OVA equivalently in Xcr1Cre/+ MHCIIfl/fl mice and WT (Xcr1+/+ MHCIIfl/fl) mice (Fig. 2d, and Extended Data Fig. 5c). In contrast, OT-II cell proliferation was substantially reduced in response to cell-associated antigen in Xcr1Cre/+ MHCIIfl/fl mice compared to control WT mice (Fig. 2e, and Extended Data Fig. 5d). These results suggest that MHC-II expression on cDC1 is needed for optimal CD4 T cell priming to cell-associated antigens. As a control, we found that OT-I proliferation in response to cell-associated OVA was similar in Xcr1Cre/+ MHCIIfl/fl mice compared to control WT mice (Extended Data Fig. 6e). Moreover, Xcr1Cre/+ MHCIILSL/- mice, which express MHC-II exclusively on cDC1, can induce OT-II proliferation in response to cell-associated OVA, but not to soluble OVA (Fig. 2d–e, and Extended Data Fig. 6d), suggesting that MHC-II expression by cDC1 is sufficient for CD4 responses to cell-associated antigens.
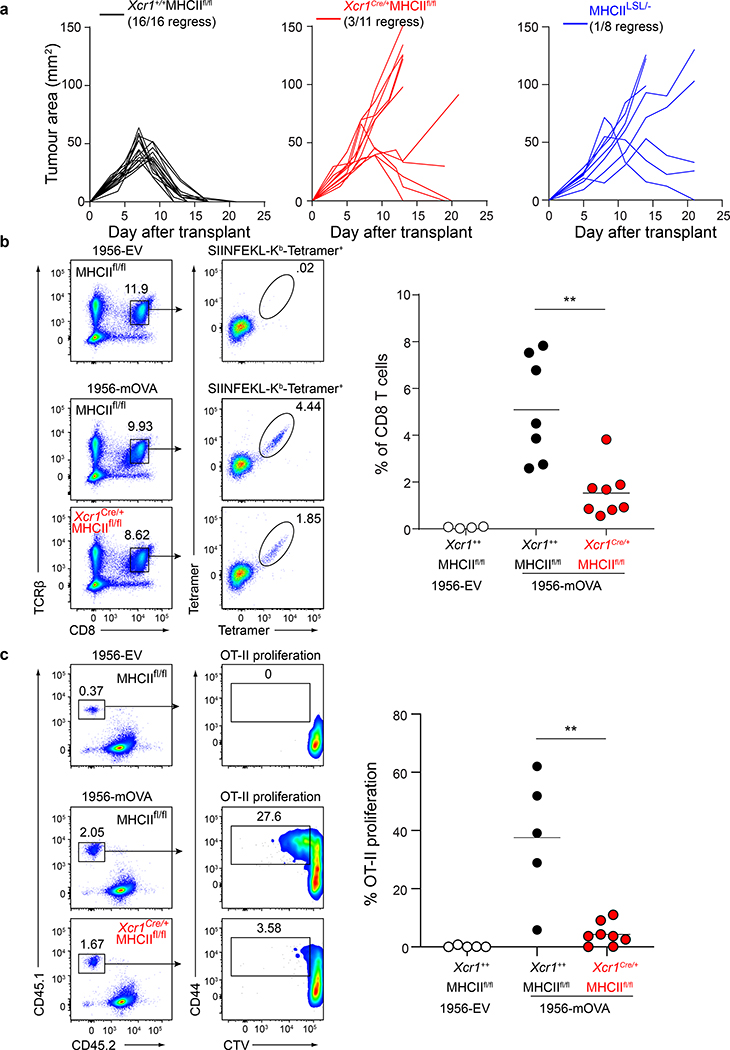
We next asked whether these results apply for tumour-derived antigens (Fig. 3). As a control, we confirmed that Xcr1+/+ MHCIIfl/fl (WT) mice, which express MHC-II normally on cDC1, can reject 1956-mOVA, as expected (Fig. 3a). In contrast, Xcr1Cre/+ MHCIIfl/fl mice, lacking MHC-II expression on cDC1, failed to reject 1956-mOVA tumours (Fig. 3a). MHCIILSL/- mice lack MHCII expression, including on thymic epithelial cells, and consequently lack mature CD4 T cells (Extended Data Fig. 5a). We found that MHCIILSL/- mice also fail to reject 1956-mOVA tumours (Fig. 3a), consistent with a requirement for CD4 T cell help in generating CD8 T cell responses sufficient for tumour rejection. Moreover, the numbers of T regulatory cells (Tregs) were unchanged between Xcr1Cre/+ MHCIIfl/fl mice and control MHCIIfl/fl mice (Extended Data Fig. 5b), although we are not able to measure tumour-specific endogenous Treg numbers in this system. In summary, rejection of the 1956-mOVA tumour requires expression of MHC-II by cDC1.
Figure 3. cDC1 expression of MHC-II is required for tumour rejection.
a, Tumour growth curves of (left) Xcr1+/+ MHCIIfl/fl, (middle) Xcr1Cre/+ MHCIIfl/fl mice, and (right) MHCIILSL/- injected with 106 1956-mOVA.
b, Xcr1+/+ MHCIIfl/fl and Xcr1Cre/+ MHCIIfl/fl mice injected with 106 1956-EV or 106 1956-mOVA. Spleens stained for presence of SIINFEKL-Kb-tetramer+ CD8 T cells. (Left) Representative flow plots of percentage of tetramer+ CD8 T cells. (Right) Graph of tetramer+ CD8 T cells as a percentage of all CD8 T cells. Data are pooled biologically independent samples from two independent experiments (n=4 for Xcr1+/+ MHCIIfl/fl 1956-EV, n=7 for Xcr1+/+ MHCIIfl/fl, n=8 for Xcr1Cre/+ MHCIIfl/fl). ** p=0.001 (unpaired, two-tailed Mann-Whitney test).
c, Xcr1+/+ MHCIIfl/fl and Xcr1Cre/+ MHCIIfl/fl mice injected with 106 1956-EV or 106 1956-mOVA (Left) Representative flow plots of OT-II T cells 3 days after transfer. (Right) Graph of percent proliferated OT-II transferred. Data are pooled biologically independent samples from two independent experiments (n=8 for Xcr1Cre/+ MHCIIfl/fl, n=5 for all other groups). ** p=0.006 (unpaired, two-tailed Mann-Whitney test).
In addition, we found that optimal priming of both CD8 and CD4 T cells induced against the 1956-mOVA tumour is regulated by expression of MHC-II by cDC1. First, we find that Xcr1Cre/+ MHCIIfl/fl mice had significantly reduced expansion of SIINFEKL-H-2Kb tetramer+ endogenous CD8 T cells in response to 1956-mOVA tumours compared with control mice (Fig. 3b), showing that a direct interaction between CD4 T cells and the cDC1 regulates the CD8 T cell response in tumour rejection. Moreover, we found that early priming of CD4 T cells in vivo during response to tumour-derived antigens requires direct interactions with the cDC1, rather than cDC2 (Fig. 3c). Robust OT-II proliferation was observed in tumour-draining lymph nodes in WT mice implanted with 1956-mOVA whereas there was a significant reduction in OT-II proliferation in Xcr1Cre/+ MHCIIfl/fl mice (Fig. 3c). OT-I proliferation in vivo was not reduced after transfer into tumour bearing Xcr1Cre/+ MHCIIfl/fl mice, nor after co-culture ex vivo with cDC1 harvested from tumour-draining lymph nodes compared to controls (Extended Data Fig. 6e–g). This ex vivo result suggests that MHCII on cDC1 is not required for MHCI-restricted antigen presentation during the initial tumour immune response, but is required for in vivo expansion or persistence of activated CD8 T cells. In summary, in the setting of cell-associated tumour antigens, early CD4 T cell priming depends primarily on cDC1, while in the setting of soluble antigens, priming depends primarily on cDC2 cells.
CD40 signaling in cDC1 is required for optimal activation of both CD8 and CD4 T cells
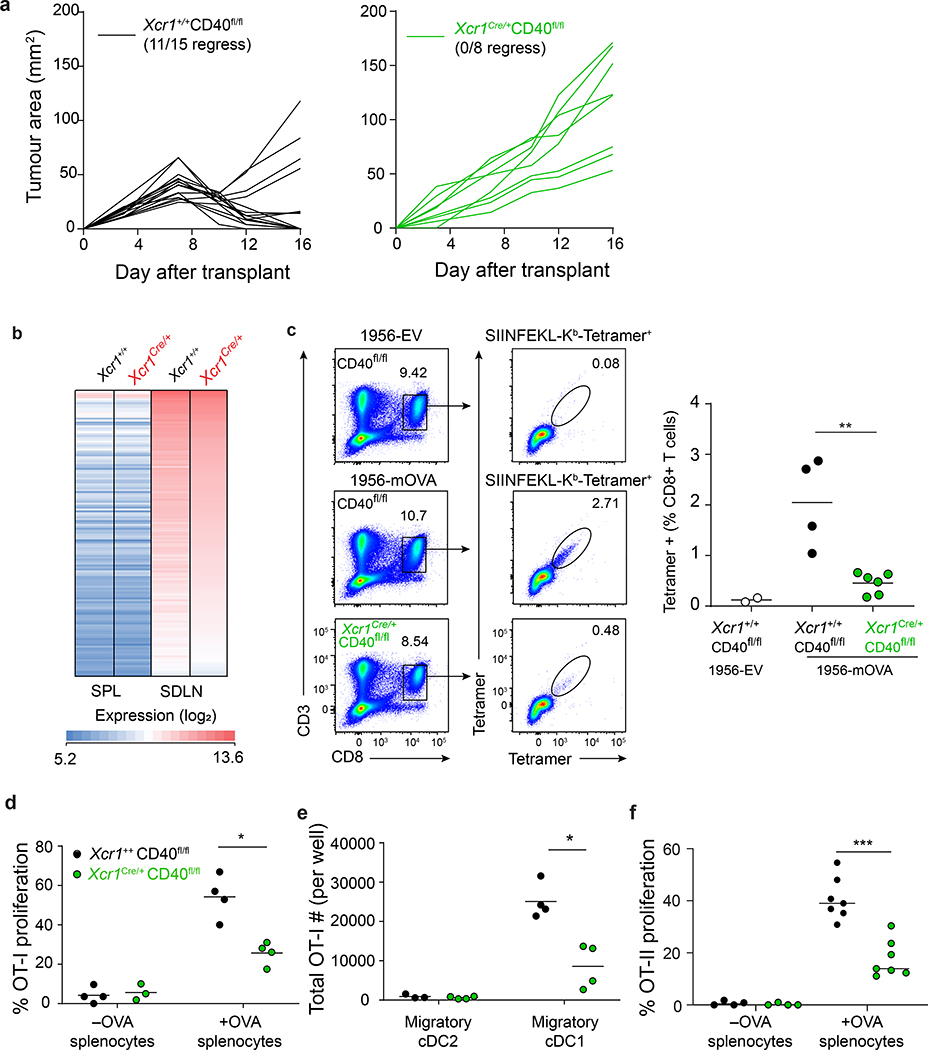
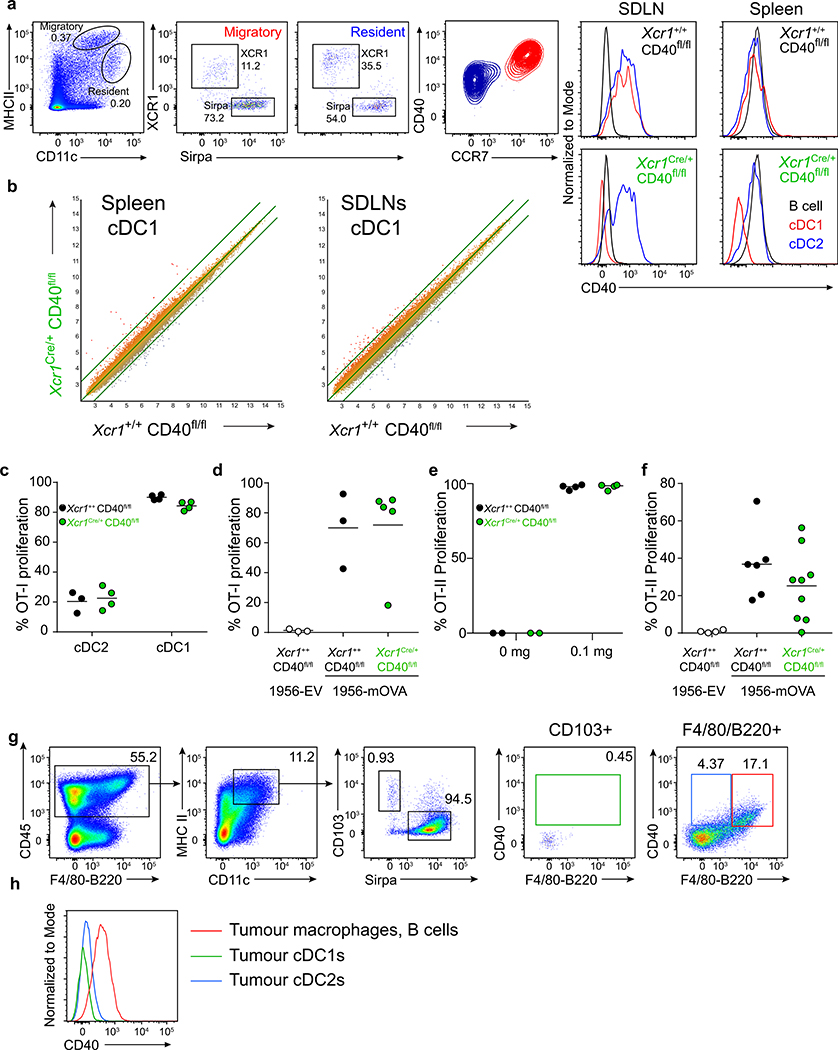
CD4 T cell help has been suggested to operate by CD40 signaling on cDC135. To test this for tumour rejection, we generated Xcr1Cre/+ CD40fl/fl mice, in which CD40 is absent on cDC1, but expressed normally on cDC2 and B cells (Extended Data Fig. 7a). Control Xcr1+/+ CD40fl/fl (WT) mice reject 1956-mOVA, as expected, but Xcr1Cre/+ CD40fl/fl mice fail to reject 1956-mOVA (Fig. 4a). This failure is not caused by defects in cDC1 development, since Xcr1Cre/+ CD40fl/fl mice have normal cDC1 numbers with a normal transcriptional signature (Fig. 4b and Extended Data Fig. 7b). In particular, cDC1 isolated from either the spleen or lymph nodes of Xcr1Cre/+ CD40fl/fl mice had similar gene expression signatures to their WT counterparts, and retained the expected differences in gene expression previously reported between these two locations36.
Figure 4. cDC1 expression of CD40 is required for tumour rejection.
a, Tumour growth curves of (left) Xcr1+/+ CD40fl/fl and (right) Xcr1Cre/+ CD40fl/fl mice injected with 106 1956-mOVA.
b, Log2 expression of 148 genes with an increased expression of at least six-fold in skin draining LN (SDLN) cDC1 relative to splenic cDC1 (results averaged from biological triplicates).
c, Xcr1+/+ CD40fl/fl and Xcr1Cre/+ CD40fl/fl mice injected with 106 1956-EV or 106 1956-mOVA cells. Spleens stained for the presence of SIINFEKL-Kb tetramer+ CD8+ T cells. Representative flow plots of percentage of tetramer+ CD8 T cells. (Left) Representative flow plots of percentage of tetramer+ CD8 T cells. (Right) Graph of tetramer+ CD8 T cells as a percentage of all CD8 T cells. Data represent pooled biologically independent samples from two independent experiments (n=2 for Xcr1+/+ CD40fl/fl 1956-EV, n=4 for Xcr1+/+ CD40fl/fl, and n=6 for Xcr1Cre/+ CD40fl/fl). ** p=0.01 (unpaired, two-tailed Mann-Whitney test).
d, Graph of percent proliferated OT-I transferred into Xcr1+/+ CD40fl/fl, Xcr1Cre/+ CD40fl/fl immunized with cell-associated OVA on day 0. Data are pooled independent samples from two independent experiments (n=3 for Xcr1Cre/+ CD40fl/fl –OVA, n=4 for all other groups). *p=0.029 (unpaired, two-tailed Mann-Whitney test).
e, Graph of absolute number of proliferated OT-I per well after 72 h culture with ex vivo migratory cDC2 or cDC1 harvested from tumour-draining lymph nodes 1956-mOVA bearing mice. Data are pooled biologically independent samples from two independent experiments (n=3 for Xcr1+/+ CD40fl/fl Migratory cDC2, and n=4 for all other groups). *p=0.029 (unpaired, two-tailed Mann-Whitney test).
f, Graph of percent proliferated OT-II transferred into Xcr1+/+ CD40fl/fl, Xcr1Cre/+ CD40fl/fl immunized with cell-associated OVA on day 0. Data are pooled biologically independent samples from three independent experiments (n=4 for -OVA groups and n=7 for all other groups). ***p=0.006 (unpaired, two-tailed Mann-Whitney test).
The observed defect in 1956-mOVA tumour rejection observed in Xcr1Cre/+ CD40fl/fl mice correlates with a greatly reduced expansion of endogenous CD8 T cells positive for SIINFEKL-H-2Kb tetramer+ (Fig. 4c). In addition, CD40 expression by cDC1 was also required to support normal in vivo proliferation of OT-I T cells in response to immunization with cell-associated OVA (Fig. 4d). By contrast, in vivo OT-I T cell proliferation was not reduced after transfer into tumour bearing Xcr1Cre/+ CD40fl/fl mice compared to controls, nor after ex vivo co-culture with Xcr1Cre/+ CD40fl/fl cDC1 harvested from tumour-draining lymph nodes compared with WT cDC1 (Extended Data Fig. 7c,d). These results suggest that CD40 on cDC1 is not required for initial antigen presentation during a tumour immune response. However, the number of OT-I CD8 T cells surviving three days after ex vivo co-culture with tumour draining cDC1 was reduced with Xcr1Cre/+ CD40fl/fl cDC1s compared to controls (Fig. 4e). Altogether, these results suggest that CD40 signaling in cDC1 functions to enhance the expansion and/or persistence of endogenous antigen-specific CD8 T cells during tumour rejection.
We next used in vivo OT-II proliferation to examine the effect of CD40 signaling in cDC1 on CD4 T cells. After immunization with cell-associated OVA, we observed substantially less in vivo OT-II proliferation in Xcr1Cre/+ CD40fl/fl mice compared with WT (Xcr1+/+ CD40fl/fl) mice (Fig. 4f). This difference in OT-II proliferation was not seen after immunization with soluble OVA (Extended Data Fig. 7e) or inoculation with 1956-mOVA tumours (Extended Data Fig. 7f). This result may be expected, since cDC2 present soluble OVA to CD4 T cells and continue to express CD40 in Xcr1Cre/+ CD40fl/fl mice. Further, the degree of OT-II proliferation occurring in Xcr1Cre/+ CD40fl/fl and WT mice is not comparable in the 1956-mOVA tumour system, since the former fail to reject tumours, while the latter reject tumours, causing unequal antigen burdens. Nonetheless, using immunization with equal amounts of cell-associated antigen (Fig. 4f), there is reduced in vivo OT-II proliferation in mice lacking CD40 expression on cDC1.
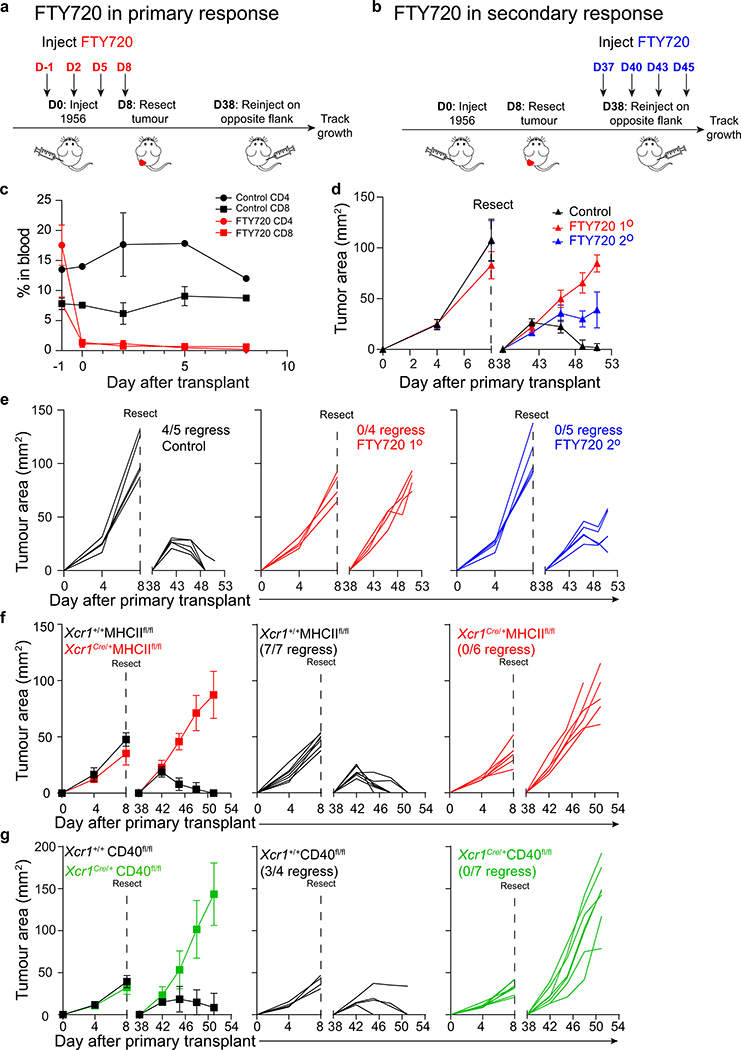
Recent work suggests that CD4 T cells may act at the tumour site after priming to promote rejection26, although the mechanism is unclear. To examine this, we administered FTY72037 to block T cell exit from lymphoid organs both during both primary and secondary challenge with the 1956 fibrosarcoma (Extended Data Fig. 8a, b). However, FTY720 treatment reduced emergence of both CD4 and CD8 T cells from lymphoid tissues (Extended Data Fig. 8c), preventing this approach from being conclusive in interrogating the peripheral role of CD4 T cells. Nonetheless, we find that administration of FTY720 during the primary tumour challenge caused the failure of tumour rejection upon secondary challenge (Extended Data Fig. 8d,e). Similarly, administration of FTY720 during the secondary tumour challenge (Extended Data Fig. 8b) also caused the failure to reject tumours (Extended Data Fig. 8d,e). In addition, Xcr1Cre/+ MHCIIfl/fl and Xcr1Cre/+ CD40fl/fl mice each fail to reject secondary inoculation with the 1956 fibrosarcoma (Extended Data Fig. 8f, g). In lymph nodes (LNs), CD40 was expressed by migratory, but not resident, cDC1 (Extended Data Fig. 7a), as reported36. In contrast, we find very few cDC1 within the tumour microenvironment, where CD40 was expressed largely by B cells and macrophages (Extended Data Fig. 7g and h). These results suggest that CD40 signaling in cDC1 may have its primary effect in LNs, rather than at the tumour. Conceivably, the role of CD4 T cells in the tumour may be in activating tumour associated macrophages, but this issue will require further study.
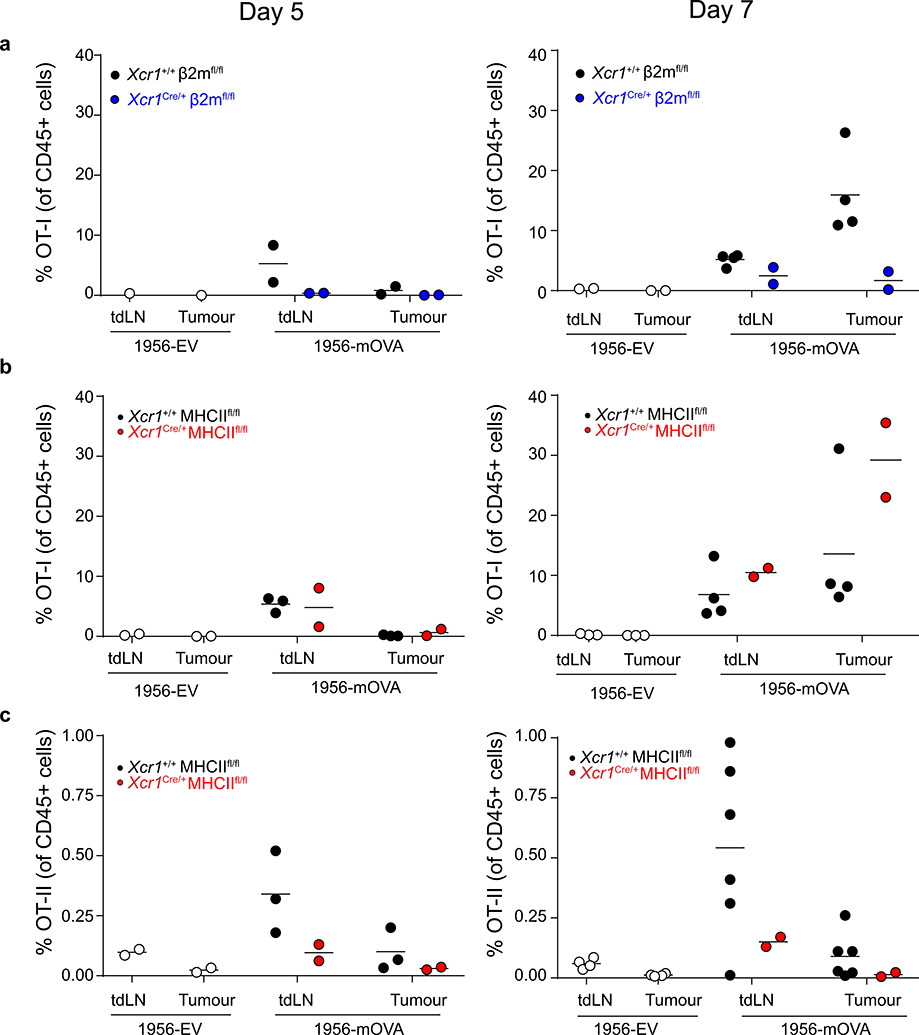
Finally, we used OT-I and OT-II T cells to examine the requirement of MHC-I and MHC-II on cDC1 for entry into 1956-mOVA tumours (Extended Data Fig. 9). OT-I T cells entered tumours in WT mice as expected but failed to enter in Xcr1Cre/+ β2mfl/fl mice (Extended Data Fig. 9a). By contrast, OT-I T cells entered tumours normally, but OT-II T cells failed to enter tumours in Xcr1Cre/+ MHCIIfl/fl mice (Extended Data Fig. 9b, c). Thus, despite the presence of other cells within the tumour expressing MHCII (Extended Data Fig. 7g), the entry of CD4 T cells into tumours seems sensitive to the relatively rare cDC1 in this location.
Discussion
Our results provide the first in vivo demonstration that CD4 T cells must directly engage cDC1 via antigen:MHC-II interactions to induce cDC1-specific CD40 signaling required for optimal CD8 T cell responses. First, using Irf8 +32–/– mice30 that eliminate cDC1 development without disrupting Batf3, we verified that cDC1 are exclusively responsible for priming anti-tumour CD8 T cells, but unexpectedly found that in the context of tumour-derived antigens, cDC1 are also required for early priming of CD4 T cells. This result contrasts with recent models suggesting that CD4 T cells are initially activated by cDC2 and subsequently re-engage antigen:MHC presented by cDC1 for licensing5,12,38. However, these models were based on studies indicating that cDC2 are superior in MHC-II antigen processing after delivery of antigen to DCs in vivo using antibodies4,17,39. Conceivably, the uptake and processing pathways of tumour-derived antigens may differ from delivery via antibodies. For example, expression of the cDC1-specific receptor for filamentous actin CLEC9A40,41 may provide them with superior MHC-II processing in the context of tumour-derived antigens.
Naïve CD4 T cells constitutively express intracellular CD40L42 and so may immediately license cDC1 for CD8 T cell priming upon simultaneous presentation of tumour-derive antigens by MHC-I and MHC-II. The possibility of non-cognate cDC licensing was suggested recently by analysis of mice expressing transpeptidase sortase A fused to CD40L43. 12 hours after immunization with peptide-loaded DCs, enzymatic labeling of CD40 on DCs required their expression of MHC-II, but after 48 hours, was independent of MHC-II expression43. However, this study did not test the functional consequences of these interactions. In our study, both the loss of MHC-II and CD40 caused a failure in rejection of tumours, suggesting that functional interactions between CD4 T cells and cDC1 require cognate antigen recognition at some stage, although conceivably our model could incorporate late licensing via CD40 without cognate recognition.
Methods
Generation of Xcr1-mCherry-hCre
Oligonucleotide primers used in the construction are described in Supplementary Table 1 The 3’ and 5 ‘ homology arms were amplified by PCR from C57BL/6 genomic DNA using Phusion High-Fidelity DNA polymerase (New England Biolabs, Inc.) using primers XCR1–5’ HA FOR and XCR1–5’ HA REV to generate a 5’ homology arm of 1142 bp, and XCR1–3’ HA FOR and XCR1–3’ HA REV 2 to generate a 3’ homology arm of 5495 bp. The vector backbone was amplified from the pENTR lox rNeo vector44 as two overlapping fragments containing the attL2 and attL1 sites using the primers pENTR attL2 FOR and pENTR attL2 REV, and pENTR attL1 FOR and pENTR attL1 REV, respectively. The IRES was generated from the vector Spi-C-IRES-GFP45 and the primers IRES pGK-Neo FOR and IRES pGK-Neo REV. An mCherry-Cre fragment was amplified from mCherry-T2A-hCre vector46 using primers mCherry-T2A FOR and mCherry-T2A REV. Vector backbone, IRES and mCherry-Cre fragments were combined by Gibson assembly to generate the intermediate IRES-mCherry-T2A-hCre pENTR LoxP-Neo plasmid. A Frt-flanked rNeo fragment was produced by EcoRI digestion of pENTR FRT-rNeo46 was inserted into this plasmid to make the intermediate IRES-mCherry-T2A-hCre pENTR Frt-rNeo. The 5’ and 3’ homology arms were sequentially inserted into this intermediate as SacI fragments. Finally, the plasmid containing the both homology arms was digested with PvuI, and a DTA fragment, amplified from pDEST-DTA-MLS{Iiizumi, 2006 3669 /id} using primers pDEST DTA FOR and pDEST DTA REV, was inserted by Gibson assembly to yield the final IRES-mCherry-T2A-hCre targeting construct. The linearized targeting construct was electroporated into JM8.N4 ES cells and targeted clones were screened by Southern blot analysis of SacI-digested genomic DNA. Correctly targeted clones were injected into blastocysts as described46. Southern probes were amplified using 5’ XCR1 FOR and 5’XCR1- REV and 3’XCR1 FOR and 3’XCR1 REV. Germline transmission and progeny genotype was performed by PCR using the primers XCR1 IMC FOR, XCR1 IMC REV or XCR1 IMC IRES REV to generate amplicons of 165 bp (mutant) or 301 bp (wild type).
Mice
Irf8 +32–/– were generated in house and described previously30. IAβbstopf/f (MHCIILSL)34 mice were provided by Gregory Wu (Washington University, St. Louis, MO). Mice harboring floxed alleles of β2-microglobulin (β2mfl)32 were provided by Wayne Yokoyama (Washington University, St. Louis, MO). MHCI TKO mice (Kb−/−Db−/−β2m−/−) were originally provided by T. Hansen (Washington University, St. Louis, MO) 47. C57BL/6J (B6), MHCIIfl (B6.129X1-H2-Ab1tm1Koni/J), C57BL/6-Tg(TcraTcrb)1100Mb/J (OT-I), C57BL/6- Tg(TcraTcrb)425Cbn/J (OT-II), B6.129X1-Gt(ROSA)26Sortm1(EYFP)Cos/J (R26LSLYFP), B6.SJL-Ptprca Pepcb/BoyJ (CD45.1) B6.129S4-Gt(ROSA)26Sortm1(FLP1)Dym/RainJ (R26FLP) were purchased from The Jackson Laboratory. CD45.1 mice were bred to OT-I and OT-II to produce CD45.1 OT-I and CD45.1 OT-II, respectively. The Cd40tm1a(KOMP)Wtsi mouse used for this project was generated by the trans-NIH Knock-Out Mouse Project (KOMP) and obtained from the KOMP Repository (www.komp.org). NIH grants to Velocigene at Regeneron Inc (U01HG004085) and the CSD Consortium (U01HG004080) funded the generation of gene-targeted ES cells for 8500 genes in the KOMP Program and archived and distributed by the KOMP Repository at UC Davis and CHORI (U42RR024244 ). The Cd40tm1a(KOMP)Wtsi trapping cassette “SA-βgeo-pA” (splice acceptor-beta-geo-polyA) flanked by Flp-recombinase target FRT sites was converted to a conditional allele by breeding to R26FLP mice. The resulting mice lack the gene trap cassette leaving two loxP sites flanking exons 2–4 of Cd40 (CD40fl). The resultant CD40fl mice were subsequently used in experiments where indicated. Xcr1Cre mice with germline deletion of MHCI, MHCII, or CD40 were excluded from our study.
All in vivo experiments were performed in our specific-pathogen free facility and both sexes were used between the ages of 8 and 16 weeks. All animals were maintained on 12-hour light cycles and housed at 70ºF and 50% humidity. All experiments were performed in accordance with procedures approved by the AAALAC-accredited Animal Studies Committee of Washington University in St Louis and were in compliance with all relevant ethical regulations.
Tumour lines and growth experiments
The MCA-induced fibrosarcoma 1956 was a gift from Robert Schreiber (Washington University School of Medicine). It was generated in a female C57BL/6 mouse, tested for mycoplasma, and banked at low passage as previously described 25. The B16F10 (ATCC® CRL6475™) melanoma was purchased from ATCC. Tumour cells derived from frozen stocks were propagated for 1 week with one intervening passage in vitro in Iscove’s modified Dulbecco’s media (IMDM) or RPMI media supplemented with 10% FCS (HyClone), washed three times with PBS, and resuspended at a density of 6.67 × 10⁶ cells/mL in endotoxin-free PBS. Mice were subcutaneously injected into the flanks with 106 tumour cells. Tumour growth was measured with a caliper and tumour area was calculated by the multiplication of two perpendicular diameters. In accordance with our IACUC-approved protocol, maximal tumour diameter was 20 mm in one direction and in no experiments was this limit exceeded.
For tumour memory experiments, 106 1956 cells were injected subcutaneously into C57BL/6 mice. Tumours were resected after 8 days. 30 days later, 106 1956 cells were injected subcutaneously into the contralateral flanks. For T cell depletions, 250 μg of depleting CD4 (YTS 191.1) or CD8 (YTS 169.4) antibodies (BioXcell) were injected intraperitoneallv(IP) on day −4 and day 0 during the primary response or injected IP on day 34 and day 38 during the secondary response. For treatment with FTY720 (Sigma-Aldrich), a stock concentration of 5 mg/mL in DMSO was diluted to 125 μg/mL in PBS directly before injection. Mice were injected IP with 25 μg FTY720 or PBS/DMSO on day −1 and every subsequent 3 days during the primary response or injected IP on day 37 and every subsequent 3 days during the secondary response.
An immunogenic fibrosarcoma expressing membrane ovalbumin was generated from the MCA-induced progressor fibrosarcoma 1956 (1956-mOVA). The mOVA fragment isolated from pCI-neo-mOVA (Addgene #25099) was ligated into MSCV-IRES-Thy1.1 vector48 to generate MSCV-mOVA-IRES-Thy1.1. 1956 tumour cells were retrovirally transduced with this vector and were sorted for expression of Thy1.1. Individual clones of 1956-mOVA were generated by limited dilution cloning and were tested for growth in C57BL/6 mice. Clone 1 was selected by expression of Thy1.1 and surface OVA (Millipore AB1225) using flow cytometry. The control fibrosarcoma expressing Thy1.1 (1956-EV) was generated from 1956 by retroviral transduction of the MSCV-IRES-Thy1.1 vector. Individual clones of 1956-EV were generated by limited dilution cloning and were tested for growth in C57BL/6 mice. Clone 3 was selected by expression of Thy1.1 using flow cytometry. The B16F10 melanoma was engineered to express membrane ovalbumin using the same MSCV-mOVA-IRES-Thy1.1 vector. B16F10 tumour cells were retrovirally transduced with this vector and were sorted for expression of Thy1.1. However, over time in culture, the cells lost expression of Thy1.1 but retained expression of mOVA. Clone 2 was selected by expression of surface OVA (Millipore AB1225) using flow cytometry. Bulk B16F10 cells transduced with MSCV-IRES-Thy1.1 (B16F10-EV) were used as control tumour cells.
DC preparation
Lymphoid and non-lymphoid organ DCs were harvested and prepared as described previously30. Briefly, spleens and inguinal skin-draining LNs were minced and digested in 5 ml of IMDM +10% FCS (cIMDM) with 250 μg/ml of collagenase B (Roche) and 30 U/ml of DNaseI (Sigma-Aldrich) for 45 min at 37 °C with stirring. Lungs were minced and digested in 5 ml of cIMDM with 4 mg/ml of collagenase D (Roche) and 30 U/ml of DNaseI (Sigma-Aldrich) for 1.5 h at 37 °C with stirring. Tumours were minced and digested in serum-free IMDM with 125 μg/ml Liberase (Roche) and 30 U/mL of DNaseI (Sigma-Aldrich) for 45 minutes at 37 °C with stirring. After digestion was complete, single-cell suspensions from all organs were passed through 70-μm strainers and red blood cells were lysed with ammonium chloride–potassium bicarbonate (ACK) lysis buffer. Cells were subsequently counted with a Vi-CELL analyzer (Beckman Coulter) and 3–5×10⁶ cells were used per antibody staining reaction.
Soluble and cell-associated T cell proliferation assay
CD45.1 OT-II TCR transgenic mouse lymph nodes and spleens were harvested and dispersed into single-cell suspensions by mechanical separation. Cells were then stained with biotinylated Ter119, CD8b, I-A/I-E, and Ly6G antibodies for 20 min at 4°C. CD45.1 OT-I TCR transgenic mouse lymph nodes and spleens were harvested and dispersed into single cell suspensions by mechanical separation. Cells were then stained with biotinylated Ter119, CD4, I-A/I-E, and Ly6G antibodies for 20 min at 4°C. Cells were washed incubated with MagniSort™ SAV negative selection beads (Invitrogen) according to manufacturer’s protocol. Cells were magnetically separated and sorted as B220-CD8- TCRβ+CD4+CD45.1+Vα2+ (OT-II) or as B220-CD8+ TCRβ+CD4-CD45.1+Vα2+ (OT-I). Cells were labeled with either 1 μM CFSE or Cell Trace Violet (Thermo Fisher Scientific) proliferation dyes. Labeled OT-I cells (5 × 10⁵) or OT-II cells (106) were transferred intravenously into mice one day before immunization with either 100 μg soluble or cell-associated OVA. Cell-associated OVA was produced by isolating either MHCI TKO splenocytes (OT-I proliferation assays) or MHCII LSL/- splenocytes (OT-II proliferation assays) and osmotically loading with 10mg/ml soluble ovalbumin (Worthington Biochemical Corporation). Cells were irradiated at 1350rad and 5 × 10⁵ MHC-I TKO cells or 2 × 10⁶ MHCII LSL/- cells were injected intravenously into mice. After 3 days, spleens were harvested, mashed, and analyzed for proliferation dye dilution of transferred CD45.1 OT-I or OT-II cells.
CD8 T cell tetramer staining
Spleens were harvested 10 days after tumour transplantation, digested in collagenase B (0.25 mg/mL) and DNAse1 (30 u/mL) in complete IMDM (Iscove’s modified Dulbecco’s medium with10% FCS, 2ME, penicillin/streptomycin, NEAA, and glutamine) for 40 minutes at 37C with stirring and subjected to ACK lysis. SIINFEKL- H2-Kb biotinylated monomers were purchased from the immunomonitoring core lab at the Bursky center for human immunology and immunotherapy programs. The peptide–MHC-I complexes refolded with an ultraviolet-cleavable conditional ligand were prepared as described with modifications49. Briefly, recombinant the H-2Kb heavy chain and the human β2 microglobulin light chain were produced in Escherichia coli, isolated as inclusion bodies, and dissolved in 4 M urea, 20 mM Tris pH 8.0. MHC Class I refolding reactions were performed by dialyzing a molar ratio of heavy chain:light chain:peptide of 1:1:8 against 10 mM potassium phosphate, pH 7.4 for 48 h. Refolded peptide-MHC class I complexes were captured by ion exchange (HiTrap Q HP, GE), biotinylated, and purified by gel filtration FPLC. Ultraviolet-induced ligand exchange and combinatorial encoding of MHC Class I multimers was performed as described50. Then, the peptide-MHC multimers were incubated with BV605 and BV710 conjugated streptavidin (SA) at a concentration of 1:5 for 30 minutes at 4°C protected from light in separate reactions. SA-labeled tetramers were then incubated with 25 uM D-biotin for 20 min at 4°C protected from light to quench free fluorochrome labeled SA. 3 × 10⁶ splenocytes were incubated with 10% BSA 2mM EDTA phosphate buffered saline (PBS) supplemented with 10% 2.4g2 supernatant for 5 min at 4°C. Fluorochrome-conjugated tetramers were added to the splenocytes at a concentration of 3:50 and incubated at 37°C for 30 minutes. Surface antibodies were added without washing and stained for another 30 minutes at 4°C.
Tumour-specific in vivo T cell priming assay
CD45.1 OT-II or OT-I TCR transgenic cells were isolated as stated above. Cells were washed incubated with MagniSort™ SAV negative selection beads (Invitrogen) according to manufacturer’s protocol. Cells were magnetically separated and sorted as B220- CD8- TCRβ+ CD4+ CD45.1+ Vα2+ (OT-II) or B220- CD8+ TCRβ+ CD4- CD45.1+ Vα2+ (OT-I). Cells were labeled with either 1 μM CFSE or Cell Trace™ Violet (Thermo Fisher Scientific) proliferation dyes. One million labeled OT-II or OT-I cells were transferred intravenously into mice on day 2 after tumour implantation. Tumour draining lymph nodes were harvested on day 5 after tumour implantation (3 days-after T cell transfer) and assayed for dye dilution. Tumours were harvested on day 5 or day 7 after implantation (3 or 5 days after T cell transfer) and assayed for accumulation as a percentage of total CD45+ cells.
Expression microarray analysis
Xcr1+/+ and Xcr1Cre/+ CD40fl/fl spleens and skin-draining lymph nodes were harvested and digested in collagenase B (0.25 mg/mL) and DNAse1 (30 u/mL) in complete IMDM (Iscove’s modified Dulbecco’s medium with 10% FCS, 2ME, penicillin/streptomycin, NEAA, and glutamine) for 40 minutes at 37°C with stirring. Cells were then stained with biotinylated CD3, CD19, Ter119, and Ly6G antibodies for 20 min at 4°C. Cells were washed and then incubated with MagniSort™ SAV negative selection beads (Invitrogen) according to manufacturer’s protocol. After magnetic depletion, cells were sorted as B220- MHCIIhi CD11cint XCR1+ CD172α−. RNA from sorted DC populations was extracted with a NucleoSpin RNA XS Kit (Machery-Nagel), and was then amplified with WT Pico System (Affymetrix, Inc.) and hybridized to GeneChip Mouse Gene 1.0 ST microarrays (Affymetrix, Inc.) for 18 h at 45 °C in a GeneChip Hybridization Oven 640. The data were analyzed using the Affymetrix GeneChip Command Console. Microarray expression data were processed using Command Console (Affymetrix, Inc.) and the raw (.CEL) files generated were analyzed using Expression Console software with Affymetrix default Robust Multichip Analysis Gene analysis settings (Affymetrix, Inc.). Probe summarization (Robust Multichip Analysis), quality control analysis and probe annotation were performed according to recommended guidelines (Expression Console Software, Affymetrix, Inc.). Data were normalized by robust multiarray average summarization and underwent quartile normalization with ArrayStar software (DNASTAR).
Ex vivo tumour-draining DC coculture:T cell priming assay
Mice were injected subcutaneously with 2 × 10⁶ 1956-mOVA cells on each flank. On day 6 after tumour implantation, tumour-draining lymph nodes were harvested and digested in collagenase B (0.25 mg/mL) and DNAse1 (30 u/mL) in complete IMDM (Iscove’s modified Dulbecco’s medium with 10% FCS, 2ME, penicillin/streptomycin, NEAA, and glutamine) for 40 minutes at 37°C with stirring. Cells were then stained with biotinylated CD3, CD19, Ter119, and Ly6G antibodies for 20 min at 4°C. Cells were washed and then incubated with MagniSort™ SAV negative selection beads (Invitrogen) according to manufacturer’s protocol. After magnetic depletion, cells were sorted as migratory cDC1s (B220- MHCIIhi CD11cint XCR1+ CD172α-) or migratory cDC2s (B220- MHCIIhi CD11cint XCR1- CD172α+) into I10F. CD45.1 OT-I TCR transgenic cells were isolated as stated above. Cells were washed incubated with MagniSort™ SAV negative selection beads (Invitrogen) according to manufacturer’s protocol. Cells were magnetically separated and sorted as B220- CD8+ TCRβ+ CD4- CD45.1+ Vα2+ CD44lo CD62Lhi. Cells were labeled with either 1 μM CFSE or Cell Trace Violet (Thermo Fisher Scientific) proliferation dyes. OT-I cells were co-cultured in complete IMDM with migratory cDC1 or cDC2 at a ratio of 10:1 in 96-well round bottom plate (Corning) at 37°C. After 72 hours, cells were washed and stained with antibodies for evaluation of proliferation and expansion.
Antibodies and Flow Cytometry
Flow cytometry and cell sorting were completed on a FACS CantoII or FACS Aria Fusion instrument (BD) and analyzed using FlowJo analysis software (Tree Star). Staining was performed at 4ºC in the presence of Fc block (2.4G2) in magnetic-activated cell-sorting (MACS) buffer (PBS + .5% BSA + 2mM EDTA). The following antibodies were used; from BD Biosciences: CD117 (2B8), CD135 (A2F10.1), Ly6C (AL-21), MHCI (AF6–88.5), CD4 (RM4–5), CD8α (53–6.7), CD8β (53–5.8), CD11b (M1/70), B220 (RA3–6B2), CD64 (X54–5/7.1), CD19 (1D3), CD95 (Jo2), CD3 (145–2C11), CD45 (30-F11); from Tonbo Biosciences: MHCII (M5/114.15.2), CD44 (IM7), CD45.1 (A20), CD45.2 (104), CD11c (N418); from Biolegend: SA-BV605, SA-711, CCR7 (4B12), CD103 (2E7), XCR1 (ZET), CD115 (AFS98), Ter119 (Ter-119), Ly6G (1A8), TCRβ (H57–597), CD3 (145–2C11), CD8 (53–6.7), CD4 (RMA4–5), CD44 (IM7), CD40 (1C10), CD16/32 (93); from eBiosciences: TCRVα2 (B20.1), CD45.1 (A20), CD90.1 (HIS51), CD90.2 (53–2.1), F4/80 (BM8); from Invitrogen: CD172α (P84), CD45 (30F11); from Millipore/sigma: rabbit anti-ovalbumin (AB1225).
Statistics
Statistical analysis was performed using GraphPad Prism software version 8. Unless otherwise noted, Mann-Whitney U test was used to determine significant differences between samples and all center values correspond to the mean.
Data availability
The microarray data generated during the course of this study has been deposited and is available on the GEO database. The microarrays utilized in Figure 4b and Extended data Figure 7b can be accessed with the following accession number: GSE152196. All other primary data and materials that support the findings of this study are available from the corresponding author upon request.
Extended Data
Extended Data Figure 1. cDC1 are required to prime CD4 T cells during the tumour immune response.
a, 1956-EV and 1956-mOVA were stained with antibodies against (left) Thy1.1 and (right) OVA.
b, Tumour growth curves of B6 WT mice injected with 106 (left)1956-EV or (right)1956-mOVA.
c, Tumour growth curves of (left) B6 WT or (right) Irf8 +32−/− mice injected with 106 1956-mOVA.
d, B6 WT or Irf8 +32−/− mice were subcutaneously injected with 106 1956-EV or 106 1956-mOVA. Spleens were isolated and stained for presence of SIINFEKL-Kb-tetramer+ CD8 T cells. (Left) Representative flow plots of percentage of tetramer+ CD8 T cells. (Right) Graph of tetramer+ CD8 T cells as a percentage of all T cells. Data are pooled biologically independent samples from two independent experiments (n=3 for WT EV, n=4 for WT 1956-mOVA, n=5 for Irf8 +32−/− 1956-mOVA).
Extended Data Figure 2. cDC1 are required to prime CD4 T cells during the immune response to B16F10 melanoma.
a, B16F10-EV and B16F10-mOVA were stained with antibodies against (left) Thy1.1 and (right) OVA.
b, B6 WT or Irf8 +32−/− mice were subcutaneously injected with 106 B16F10-EV or 106 B16F10-mOVA. (Left) Representative flow plots of OT-II T cells 3 days after transfer. (Right) Graph of percent proliferated OT-II transferred. Data are pooled biologically independent samples from two independent experiments (n=4 for WT B16F10-EV, n=6 for all other groups).* p=0.04 (unpaired, two-tailed Mann-Whitney test).
Extended Data Figure 3. Validation of mCherry expression and lineage tracing of Xcr1Cre mouse.
a, Schematic diagrams of the mouse Xcr1 WT allele, the targeting vector (IRES-mCherry-T2a-hCRE with FRT flanked pGK-Neo cassettes), and the targeted allele. Filled and open boxes denote coding and noncoding exons of Xcr1, respectively.
b, Southern blot analysis of Xcr1+/+ and Xcr1Cre/+. Genomic DNAs were isolated from mice tails, digested with SalI, electrophoresed, and hybridized with the 5’ radiolabeled probe indicated in a. Southern blot gave a 10.6 and a 6.9 kbp band for WT and targeted allele, respectively. For southern blot source data, see Supplementary Figure 1.
c, Southern blot analysis of Xcr1+/+ and Xcr1Cre/+. Genomic DNAs were isolated from mice tails, digested with SalI, electrophoresed, and hybridized with the 3’ radiolabeled probe indicated in a. Southern blot gave a 10.6 and a 8.2 kbp band for WT and targeted allele, respectively. For southern blot source data, see Supplementary Figure 1.
d, Gating strategy to delineate splenic cell populations.
e, FACs histograms of mCherry expression from subpopulations in d isolated from Xcr1Cre/+ and Xcr1+/+ mice.
f, Graph of mCherry expression in APC populations gated from d isolated from Xcr1Cre/+ and Xcr1+/+ mice. Data are pooled biologically independent samples from two independent experiments (n=5 in all groups).
g, FACs histograms for YFP expression from subpopulations in d isolated from Xcr1Cre/+ R26LSLYFP/+ and Xcr1+/+ R26LSLYFP/+ mice.
h, Graph of YFP expression in splenic cell populations (Mo, monocytes; N, neutrophils; RPM, red pulp macrophages). Data are pooled biologically independent samples from two independent experiments (n=6 for cDC1s, cDC2s, pDCs, and B cells from Xcr1+/+ R26LSLYFP/+ mice, n= 7 for cDC1s, cDC2s, pDCs, and B cells from Xcr1Cre/+ R26LSLYFP/+ mice, and n=4 for all other groups).
i, (Top) Gating strategy to delineate SDLN cell populations. (Bottom) FACs histograms for YFP expression in cDC1 and cDC2 isolated from Xcr1Cre/+ R26LSLYFP/+ and Xcr1+/+ R26LSLYFP/+ mice.
j, Graph of YFP expression from subpopulations in i isolated from Xcr1Cre/+ R26LSLYFP/+ and Xcr1+/+ R26LSLYFP/+ mice. Data are pooled biologically independent samples from two independent experiments (n=3 in all groups).
Extended Data Figure 4. Proliferation of OT-I in Xcr1Cre/+ β2mfl/fl mice receiving soluble or cell-associated OVA.
a, Representative FACs analysis and histograms of CFSE dilution of proliferated OT-I on day 3 after transfer into (left) Xcr1+/+ β2mfl/fl and (right) Xcr1Cre/+ β2mfl/fl immunized with soluble OVA.
b, Graph of percent proliferation of transferred OT-I in mice immunized with soluble OVA. Data are pooled biologically independent samples from two independent experiments (n=5 for all groups).
c, Representative FACs analysis and histograms of CFSE dilution of proliferated OT-I on day 3 after transfer into (left) Xcr1+/+ β2mfl/fl and (right) Xcr1Cre/+ β2mfl/fl immunized with cell-associated OVA.
d, Graph of percent proliferation of transferred OT-I in mice immunized with cell-associated OVA. Data are pooled biologically independent samples from two independent experiments (n=5 Xcr1+/+ β2mfl/fl –OVA, n=6 for Xcr1Cre/+ β2mfl/fl +OVA, n=7 for Xcr1+/+ β2mfl/fl +OVA, and n=8 for Xcr1Cre/+ β2mfl/fl +OVA).
Extended data Figure 5. Proliferation of OT-II in Xcr1Cre /+ MHCIIfl/fl and Xcr1Cre /+ MHCIILSL/- mice immunized with soluble and cell-associated OVA.
a, Representative FACS analysis of splenic CD4 T cell percentage in WT B6, Xcr1+/+ MHCIILSL/-, and Xcr1Cre/+ MHCIILSL/- mice at steady state.
b, (Left) Representative FACS analysis of splenic Treg percentage in Xcr1+/+ MHCIIfl/fl and Xcr1Cre/+ MHCIIfl/fl at steady state. (Right) Graph of splenic Treg percentage as a percentage of all CD4 T cells. Data are pooled biologically independent samples from two independent experiments (n=5 for Xcr1+/+ MHCIIfl/fl, n=4 for Xcr1Cre/+ MHCIIfl/fl).
c, Representative FACs analysis and histograms of CFSE dilution of proliferated OT-II on day 3 after transfer into Xcr1+/+ MHCIIfl/fl, Xcr1Cre/+ MHCIIfl/fl, and Xcr1Cre/+ MHCIILSL/- immunized with soluble OVA.
d, Representative FACs analysis and histograms of CFSE dilution of proliferated OT-II on day 3 after transfer into Xcr1+/+ MHCIIfl/fl, Xcr1Cre/+ MHCIIfl/fl, and Xcr1Cre/+ MHCIILSL/- immunized with cell-associated OVA.
Extended Data Figure 6. Analysis of cDC1 in conditionally deleted mice.
a, Graph of splenic cDC1 percentage in Xcr1+/+ β2mfl/fl and Xcr1Cre/+ β2mfl/fl. Data are pooled biologically independent samples from two independent experiments (n=5 for all groups). p=ns (unpaired, two-tailed Mann-Whitney test).
b, Graph of splenic cDC1 percentage in Xcr1+/+ MHCIIfl/fl and Xcr1Cre/+ MHCIIfl/fl. Data are pooled biologically independent samples from two independent experiments (n=5 for all groups). p=ns (unpaired, two-tailed Mann-Whitney test).
c, Graph of absolute numbers of transferred OT-I in soluble OVA treated Xcr1+/+ β2mfl/fl and Xcr1Cre/+ β2mfl/fl mice. Data are pooled biologically independent samples from two independent experiments (n=5 for all groups).
d, Graph of absolute numbers of transferred OT-II in soluble OVA treated Xcr1+/+ MHCIIfl/fl and Xcr1Cre/+ MHCIIfl/fl mice. Data are pooled biologically independent samples from two independent experiments (n=5 for all groups).
e, Graph of percent proliferated OT-I in cell-associated treated Xcr1+/+ MHCIIfl/fl and Xcr1Cre/+ MHCIIfl/fl mice. Data are pooled biologically independent samples from two independent experiments (n=6 for Xcr1Cre/+ MHCIIfl/fl OVA- and OVA+ and n =5 for all other groups).
f, Graph of percent proliferation of OT-I after 72 h coculture with ex vivo migratory cDC2 or cDC1 harvested from tumour-draining lymph nodes of Xcr1+/+ MHCIIfl/fl or Xcr1Cre/+ MHCIIfl/fl mice injected 6 days earlier with 106 1956-mOVA cells. Cells were cultured at a ratio of 10:1 naïve OT-I: cDCs. Data are pooled independent samples from two independent experiments (n=4 for all groups).
g, Graph of absolute number of proliferated OT-I per well after 72 h coculture with ex vivo migratory cDC2 or cDC1 harvested from tumour-draining lymph nodes of Xcr1+/+ MHCIIfl/fl, Xcr1Cre/+ MHCIIfl/fl mice six days after injection with 106 1956-mOVA. Cells were cultured at 10:1 ratio of naïve OT-I:cDC. Data are pooled independent samples from two independent experiments (n=4 for all groups).
Extended Data Figure 7. CD40 deficiency does not affect cDC1 development.
a, SDLN flow cytometry gating for cDC1 expression of CD40. Migratory cDC1 (CD11cint MHCIIhi; Red) were overlaid for expression with resident cDC1 (CD11chi MHCIIint; Blue). (Top) Xcr1+/+ CD40fl/fl and (bottom) Xcr1Cre/+ CD40fl/fl SDLN and splenic APCs stained for CD40 expression.
b, Gene expression data from Xcr1+/+ CD40fl/fl and Xcr1Cre/+ CD40fl/fl cDC1 from spleens and SDLN. Green lines indicate 2-fold changes.
c, Graph of percent proliferation of OT-I after 72 h coculture with ex vivo migratory cDC2 or cDC1 harvested from tumour-draining lymph nodes of Xcr1+/+ CD40fl/fl or Xcr1Cre/+ CD40fl/fl mice injected 6 days earlier with 106 1956-mOVA cells. Cells were cultured at a ratio of 10:1 naïve OT-I: cDCs. Data are pooled independent samples from two independent experiments (n=3 for Xcr1+/+ CD40fl/fl cDC2s and n=4 for all other groups).
d, Graph of percent proliferation of OT-I in tumour-draining lymph node of tumour-bearing mice 3 days after transfer. Xcr1+/+ CD40fl/fl and Xcr1Cre/+ CD40fl/fl mice were injected with 106 1956-EV or 106 1956-mOVA. Data are pooled independent samples from two independent experiments (n=5 for Xcr1Cre/+ CD40fl/fl1956-mOVA, n=3 for all other groups).
e, Graph of percent proliferation of transferred OT-II in soluble OVA treated Xcr1+/+ CD40fl/fl and Xcr1Cre/+ CD40fl/fl mice. Data are pooled biologically independent samples from two independent experiments (n=2 for 0 mg Xcr1+/+ CD40fl/fl and Xcr1Cre/+ CD40fl/fl and n=4 for all other groups).
f, Graph of percent proliferation of OT-II in tumour-draining lymph node of tumour-bearing mice 3 days after transfer. Xcr1+/+ CD40fl/fl and Xcr1Cre/+ CD40fl/fl mice were injected with 106 1956-EV or 106 1956-mOVA. Data are pooled biologically independent samples from three independent experiments (n=4 for 1956-EV, n=6 for 1956-mOVA Xcr1+/+ CD40fl/fl, and n=9 for 1956-mOVA Xcr1Cre/+ CD40fl/fl).
g, Gating strategy to delineate day 6 1956-mOVA tumour immune cell APC populations.
h, FACs histogram of CD40 expression on gated APC populations from e.
Extended Data Figure 8. T cells are required at tumour site to induce memory.
a, Schematic of FTY720 injection during primary tumour response.
b, Schematic of FTY720 injection during secondary tumour response.
c, Peripheral blood CD4+ and CD8+ T cell percentage in control and FTY720 treated mice. Data represent mean ± S.D. pooled biologically independent samples from two independent experiments (n=2 control, n=5 FTY720).
d, Tumour growth curves of mice injected with FTY720 during the primary or secondary 1956 tumour implantation. Data represent mean ± S.D. pooled biologically independent samples from two independent experiments (n=4 for FTY720 1º and n=5 for all other groups).
e, Individual mouse tumour growth curves of control or FTY720 injected mice.
f, (Left) Tumour growth curves of Xcr1+/+ MHCIIfl/fl and Xcr1Cre/+ MHCIIfl/fl mice during primary and secondary 1956 tumour implantation. Individual mouse tumour growth curves of (middle) Xcr1+/+ MHCIIfl/fl or (right) Xcr1Cre/+ MHCIIfl/fl mice during primary and secondary 1956 tumour implantation. Data represent mean ± S.D. pooled biologically independent samples from two independent experiments (n=7 for Xcr1+/+ MHCIIfl/fl and n=6 for Xcr1Cre/+ MHCIIfl/fl).
g, (Left) Tumour growth curves of Xcr1+/+ CD40fl/fl and Xcr1Cre/+ CD40fl/fl mice during primary and secondary 1956 tumour implantation. Individual mouse tumour growth curves of (middle) Xcr1+/+ CD40fl/fl or (right) Xcr1Cre/+ CD40fl/fl mice during primary and secondary 1956 tumour implantation. Data represent mean ± S.D. pooled biologically independent samples from two independent experiments (n=4 for Xcr1+/+ CD40fl/fl and n=7 for Xcr1Cre/+ CD40fl/fl).
Extended Data Figure 9. OT-II CD4 T cells fail to localize to the tumour in Xcr1Cre/+ MHCIIfl/fl mice.
a, Graph of percent accumulation of transferred OT-I in tumours of Xcr1+/+ β2mfl/fl, Xcr1Cre/+ β2mfl/fl injected with 106 1956-EV or 1956-mOVA on day 0. OT-I cells were transferred intravenously on day 2 and assessed as a percentage of total CD45+ cells on (left) day 5 and (right) day 7. Data represent pooled biologically independent samples from two independent experiments (n=1 for Xcr1+/+ β2mfl/fl tdLN and tumour 1956-EV day 5, n=4 for Xcr1+/+ β2mfl/fl 1956-mOVA tdLN and tumour Day 7 n=2 for all other groups).
b, Graph of percent accumulation of transferred OT-I in tumours of Xcr1+/+ MHCIIfl/fl, Xcr1Cre/+ MHCIIfl/fl injected with 106 1956-EV or 1956-mOVA on day 0. OT-I cells were transferred intravenously on day 2 and assessed as a percentage of total CD45+ cells on (left) day 5 and (right) day 7. Data represent pooled biologically independent samples from two independent experiments (n=4 for Xcr1+/+ MHCIIfl/fl tdLN and tumour 1956-mOVA day 7, n=3 for Xcr1+/+ MHCIIfl/fl tdLN and tumour 1956-mOVA day 5 and for Xcr1+/+ MHCIIfl/fl tdLN and tumour 1956-EV Day 7, n=2 for all other samples ).
c, Graph of percent accumulation of transferred OT-II in tumours of Xcr1+/+ MHCIIfl/fl, Xcr1Cre/+ MHCIIfl/fl injected with 106 1956-EV or 1956-mOVA on day 0. OT-II cells were transferred intravenously on day 2 and assessed as a percentage of total CD45+ cells on (left) day 5 and (right) day 7. Data represent pooled biologically independent samples from two independent experiments (n=6 for Xcr1+/+ MHCIIfl/fl tdLN and tumour 1956-mOVA day 7, n=4 for Xcr1+/+ MHCIIfl/fl tdLN and tumour 1956-EV Day 7, n=3 for Xcr1+/+ MHCIIfl/fl tdLN and tumour 1956-mOVA day 5, n=2 for all other samples).
Supplementary Material
Acknowledgments
K.M.M. was supported by the Howard Hughes Medical Institute and the National Institutes of Health (R01AI150297). R.D.S. was supported by grants from the National Institutes of Health (R01CA190700), The Parker Institute for Cancer Immunotherapy, and a Stand Up To Cancer-Lustgarden Foundation Pancreatic Cancer Foundation Convergence Team Translational Research Grant. W.M.Y. was supported by a grant from the National Institutes of Health (R01AI129545). M.D.B. and V.D. were supported by fellowship grants from the National Institutes of Health (F30DK112466 and F30DK108498, respectively). S.T.F. was supported by a postdoctoral training grant from the National Institutes of Health (T32CA95473).
G.F.W. was supported by the National Institutes health (R01NS106289).
D.J.T. was supported by the National Institutes of Health (T32 AI007163). J.T.D. was supported by the National Institutes of Health (T32CA009621). P.B. is supported by the National Science Foundation (DGE-1143954).
We thank the Genome Technology Access Center, Department of Genetics, Washington University School of Medicine in St. Louis for help with genomic analysis. The Center is supported by Cancer Center Support Grant P30 CA91842 from the National Cancer Institute and by Institute of Clinical and Translational Sciences/Clinical and Translational Science Award UL1 TR000448 from the National Center for Research Resources.
Aspects of studies including tetramer production were performed with assistance by the Immunomonitoring Laboratory (IML), which is supported by the Andrew M. and Jane M. Bursky Center for Human Immunology and Immunotherapy Programs and the Alvin J. Siteman Comprehensive Cancer Center that, in turn, is supported by the National Cancer Institute of the National Institutes of Health Cancer Center Support Grant (P30CA91842) and the Washington University Rheumatic Diseases Research Resource-based Center Grant (P30AR073752).
Footnotes
Competing interests
R.D.S. is a cofounder, scientific advisory board member, stockholder, and royalty recipient of Jounce Therapeutics and Neon Therapeutics and is a scientific advisory board member for A2 Biotherapeutics, BioLegend, Codiak Biosciences, Constellation Pharmaceuticals, NGM Biopharmaceuticals, Sensei Biotherapeutics.
Additional Information
Supplementary Information is available for this paper. Correspondence and requests for materials should be addressed to kmurphy@wustl.edu. Reprints and permissions information is available at www.nature.com/reprints
Bibliography
- 1.Guilliams M et al. Dendritic cells, monocytes and macrophages: a unified nomenclature based on ontogeny. Nat. Rev. Immunol. 14, 571–578 (2014). [DOI] [PMC free article] [PubMed] [Google Scholar]
- 2.Hildner K et al. Batf3 deficiency reveals a critical role for CD8alpha+ dendritic cells in cytotoxic T cell immunity. Science 322, 1097–1100 (2008). [DOI] [PMC free article] [PubMed] [Google Scholar]
- 3.Cancel JC, Crozat K, Dalod M & Mattiuz R Are Conventional Type 1 Dendritic Cells Critical for Protective Antitumor Immunity and How? Front Immunol 10, 9 (2019). [DOI] [PMC free article] [PubMed] [Google Scholar]
- 4.Dudziak D et al. Differential antigen processing by dendritic cell subsets in vivo. Science 315, 107–111 (2007). [DOI] [PubMed] [Google Scholar]
- 5.Binnewies M et al. Unleashing Type-2 Dendritic Cells to Drive Protective Antitumor CD4(+) T Cell Immunity. Cell 177, 556–571 (2019). [DOI] [PMC free article] [PubMed] [Google Scholar]
- 6.Bennett SR, Carbone FR, Karamalis F, Miller JF & Heath WR Induction of a CD8+ cytotoxic T lymphocyte response by cross-priming requires cognate CD4+ T cell help. J Exp. Med 186, 65–70 (1997). [DOI] [PMC free article] [PubMed] [Google Scholar]
- 7.Bennett SR et al. Help for cytotoxic-T-cell responses is mediated by CD40 signalling. Nature 393, 478–480 (1998). [DOI] [PubMed] [Google Scholar]
- 8.Schoenberger SP, Toes RE, van der Voort EI, Offringa R & Melief CJ T-cell help for cytotoxic T lymphocytes is mediated by CD40-CD40L interactions. Nature 393, 480–483 (1998). [DOI] [PubMed] [Google Scholar]
- 9.Bourgeois C, Rocha B & Tanchot C A role for CD40 expression on CD8+ T cells in the generation of CD8+ T cell memory. Science 297, 2060–2063 (2002). [DOI] [PubMed] [Google Scholar]
- 10.Janssen EM et al. CD4+ T-cell help controls CD8+ T-cell memory via TRAIL-mediated activation-induced cell death. Nature 434, 88–93 (2005). [DOI] [PubMed] [Google Scholar]
- 11.Williams MA, Tyznik AJ & Bevan MJ Interleukin-2 signals during priming are required for secondary expansion of CD8+ memory T cells. Nature 441, 890–893 (2006). [DOI] [PMC free article] [PubMed] [Google Scholar]
- 12.Borst J, Ahrends T, Babala N, Melief CJM & Kastenmuller W CD4(+) T cell help in cancer immunology and immunotherapy. Nat Rev Immunol 18, 635–647 (2018). [DOI] [PubMed] [Google Scholar]
- 13.Ridge JP, Di Rosa F & Matzinger P A conditioned dendritic cell can be a temporal bridge between a CD4+ T-helper and a T-killer cell. Nature 393, 474–478 (1998). [DOI] [PubMed] [Google Scholar]
- 14.Smith CM et al. Cognate CD4(+) T cell licensing of dendritic cells in CD8(+) T cell immunity. Nat Immunol 5, 1143–1148 (2004). [DOI] [PubMed] [Google Scholar]
- 15.Eickhoff S et al. Robust Anti-viral Immunity Requires Multiple Distinct T Cell-Dendritic Cell Interactions. Cell 162, 1322–1337 (2015). [DOI] [PMC free article] [PubMed] [Google Scholar]
- 16.Hor JL et al. Spatiotemporally Distinct Interactions with Dendritic Cell Subsets Facilitates CD4+ and CD8+ T Cell Activation to Localized Viral Infection. Immunity 43, 554–565 (2015). [DOI] [PubMed] [Google Scholar]
- 17.Lehmann CHK et al. DC subset-specific induction of T cell responses upon antigen uptake via Fcgamma receptors in vivo. J Exp. Med 214, 1509–1528 (2017). [DOI] [PMC free article] [PubMed] [Google Scholar]
- 18.Bajana S, Roach K, Turner S, Paul J & Kovats S IRF4 promotes cutaneous dendritic cell migration to lymph nodes during homeostasis and inflammation. J. Immunol. 189, 3368–3377 (2012). [DOI] [PMC free article] [PubMed] [Google Scholar]
- 19.Schlitzer A et al. IRF4 Transcription Factor-Dependent CD11b(+) Dendritic Cells in Human and Mouse Control Mucosal IL-17 Cytokine Responses. Immunity 38, 970–983 (2013). [DOI] [PMC free article] [PubMed] [Google Scholar]
- 20.Williams JW et al. Transcription factor IRF4 drives dendritic cells to promote Th2 differentiation. Nat. Commun. 4, 2990 (2013). [DOI] [PMC free article] [PubMed] [Google Scholar]
- 21.Valdez Y et al. Major histocompatibility complex class II presentation of cell-associated antigen is mediated by CD8alpha+ dendritic cells in vivo. J Exp. Med 195, 683–694 (2002). [DOI] [PMC free article] [PubMed] [Google Scholar]
- 22.Theisen DJ et al. WDFY4 is required for cross-presentation in response to viral and tumor antigens. Science 362, 694–699 (2018). [DOI] [PMC free article] [PubMed] [Google Scholar]
- 23.Sun JC & Bevan MJ Defective CD8 T cell memory following acute infection without CD4 T cell help. Science 300, 339–342 (2003). [DOI] [PMC free article] [PubMed] [Google Scholar]
- 24.Sun JC, Williams MA & Bevan MJ CD4+ T cells are required for the maintenance, not programming, of memory CD8+ T cells after acute infection. Nat Immunol 5, 927–933 (2004). [DOI] [PMC free article] [PubMed] [Google Scholar]
- 25.Matsushita H et al. Cancer exome analysis reveals a T-cell-dependent mechanism of cancer immunoediting. Nature 482, 400–404 (2012). [DOI] [PMC free article] [PubMed] [Google Scholar]
- 26.Alspach E et al. MHC-II neoantigens shape tumour immunity and response to immunotherapy. Nature (2019). [DOI] [PMC free article] [PubMed] [Google Scholar]
- 27.Bos R & Sherman LA CD4+ T-cell help in the tumor milieu is required for recruitment and cytolytic function of CD8+ T lymphocytes. Cancer Res. 70, 8368–8377 (2010). [DOI] [PMC free article] [PubMed] [Google Scholar]
- 28.Ferris ST et al. A minor subset of Batf3-dependent antigen-presenting cells in islets of Langerhans is essential for the development of autoimmune diabetes. Immunity 41, 657–669 (2014). [DOI] [PMC free article] [PubMed] [Google Scholar]
- 29.Theisen DJ et al. Batf3-Dependent Genes Control Tumor Rejection Induced by Dendritic Cells Independently of Cross-Presentation. Cancer Immunol Res. 7, 29–39 (2019). [DOI] [PubMed] [Google Scholar]
- 30.Durai V et al. Cryptic activation of an Irf8 enhancer governs cDC1 fate specification. Nat Immunol 20, 1161–1173 (2019). [DOI] [PMC free article] [PubMed] [Google Scholar]
- 31.Srinivas S et al. Cre reporter strains produced by targeted insertion of EYFP and ECFP into the ROSA26 locus. BMC Dev. Biol 1, 4 (2001). [DOI] [PMC free article] [PubMed] [Google Scholar]
- 32.Bern MD et al. Inducible down-regulation of MHC class I results in natural killer cell tolerance. J Exp. Med 216, 99–116 (2019). [DOI] [PMC free article] [PubMed] [Google Scholar]
- 33.Hashimoto K, Joshi SK & Koni PA A conditional null allele of the major histocompatibility IA-beta chain gene. Genesis. 32, 152–153 (2002). [DOI] [PubMed] [Google Scholar]
- 34.Archambault AS et al. Cutting edge: Conditional MHC class II expression reveals a limited role for B cell antigen presentation in primary and secondary CD4 T cell responses. J Immunol 191, 545–550 (2013). [DOI] [PMC free article] [PubMed] [Google Scholar]
- 35.Laidlaw BJ, Craft JE & Kaech SM The multifaceted role of CD4(+) T cells in CD8(+) T cell memory. Nat Rev Immunol 16, 102–111 (2016). [DOI] [PMC free article] [PubMed] [Google Scholar]
- 36.Ardouin L et al. Broad and Largely Concordant Molecular Changes Characterize Tolerogenic and Immunogenic Dendritic Cell Maturation in Thymus and Periphery. Immunity 45, 305–318 (2016). [DOI] [PubMed] [Google Scholar]
- 37.Pinschewer DD et al. FTY720 immunosuppression impairs effector T cell peripheral homing without affecting induction, expansion, and memory. J Immunol 164, 5761–5770 (2000). [DOI] [PubMed] [Google Scholar]
- 38.Ahrends T et al. CD4(+) T Cell Help Confers a Cytotoxic T Cell Effector Program Including Coinhibitory Receptor Downregulation and Increased Tissue Invasiveness. Immunity 47, 848–861 (2017). [DOI] [PubMed] [Google Scholar]
- 39.Kamphorst AO, Guermonprez P, Dudziak D & Nussenzweig MC Route of antigen uptake differentially impacts presentation by dendritic cells and activated monocytes. J Immunol 185, 3426–3435 (2010). [DOI] [PMC free article] [PubMed] [Google Scholar]
- 40.Huysamen C, Willment JA, Dennehy KM & Brown GD CLEC9A is a novel activation C-type lectin-like receptor expressed on BDCA3+ dendritic cells and a subset of monocytes. J. Biol. Chem. 283, 16693–16701 (2008). [DOI] [PMC free article] [PubMed] [Google Scholar]
- 41.Zhang JG et al. The Dendritic Cell Receptor Clec9A Binds Damaged Cells via Exposed Actin Filaments. Immunity (2012). [DOI] [PubMed] [Google Scholar]
- 42.Lesley R, Kelly LM, Xu Y & Cyster JG Naive CD4 T cells constitutively express CD40L and augment autoreactive B cell survival. Proc. Natl Acad. Sci. U S A 103, 10717–10722 (2006). [DOI] [PMC free article] [PubMed] [Google Scholar]
- 43.Pasqual G et al. Monitoring T cell-dendritic cell interactions in vivo by intercellular enzymatic labelling. Nature 553, 496–500 (2018). [DOI] [PMC free article] [PubMed] [Google Scholar]
- 44.Satpathy AT et al. Zbtb46 expression distinguishes classical dendritic cells and their committed progenitors from other immune lineages. J. Exp. Med. 209, 1135–1152 (2012). [DOI] [PMC free article] [PubMed] [Google Scholar]
- 45.Kohyama M et al. Role for Spi-C in the development of red pulp macrophages and splenic iron homeostasis. Nature 457, 318–321 (2009). [DOI] [PMC free article] [PubMed] [Google Scholar]
- 46.Wu X et al. Mafb lineage tracing to distinguish macrophages from other immune lineages reveals dual identity of Langerhans cells. J Exp. Med 213, 2553–2565 (2016). [DOI] [PMC free article] [PubMed] [Google Scholar]
- 47.Lybarger L, Wang X, Harris MR, Virgin HW & Hansen TH Virus subversion of the MHC class I peptide-loading complex. Immunity 18, 121–130 (2003). [DOI] [PubMed] [Google Scholar]
- 48.Sedy JR et al. B and T lymphocyte attenuator regulates T cell activation through interaction with herpesvirus entry mediator. Nat. Immunol. 6, 90–98 (2005). [DOI] [PubMed] [Google Scholar]
- 49.Toebes M et al. Design and use of conditional MHC class I ligands. Nat Med 12, 246–251 (2006). [DOI] [PubMed] [Google Scholar]
- 50.Andersen RS et al. Parallel detection of antigen-specific T cell responses by combinatorial encoding of MHC multimers. Nat Protoc. 7, 891–902 (2012). [DOI] [PubMed] [Google Scholar]
Associated Data
This section collects any data citations, data availability statements, or supplementary materials included in this article.
Supplementary Materials
Data Availability Statement
The microarray data generated during the course of this study has been deposited and is available on the GEO database. The microarrays utilized in Figure 4b and Extended data Figure 7b can be accessed with the following accession number: GSE152196. All other primary data and materials that support the findings of this study are available from the corresponding author upon request.


