Abstract
Non‐small‐cell lung cancer (NSCLC) is the leading global cause of cancer‐related death. Due to the lack of reliable diagnostic or prognostic biomarkers, the prognosis of NSCLC remains poor. Consequently, there is an urgent need to explore the mechanisms underlying this condition in order to identify effective biomarkers. G‐protein‐signaling modulator 2 (GPSM2) is widely recognized as a determinant of mitotic spindle orientation. However, its role in cancer, especially NSCLC, remains uncertain. In this study, we found that GPSM2 was downregulated in NSCLC tissues and was correlated with a poor prognosis. Furthermore, the knockdown of GPSM2 promoted NSCLC cell metastasis in vitro and in vivo and accelerated the process of epithelial‐mesenchymal transition (EMT). Mechanistically, we showed that silencing GPSM2 induced cell metastasis and EMT through the ERK/glycogen synthase kinase‐3β/Snail pathway. These results confirm that GPSM2 plays an important role in NSCLC. Moreover, GPSM2, as an independent prognostic factor, could be a potential prognostic biomarker and drug target for NSCLC.
Keywords: GPSM2, metastasis, non‐small‐cell lung cancer, prognosis, Snail
In this study, we showed that G‐protein‐signaling modulator 2 (GPSM2) was downregulated in non‐small‐cell lung cancer (NSCLC) tissues and cell lines, and is an independent prognostic factor in NSCLC patients. Moreover, we showed that the loss of GPSM2 promoted the epithelial‐mesenchymal transition process in NSCLC cells by acting on the ERK/glycogen synthase kinase‐3β/Snail pathway.
1. INTRODUCTION
Lung cancer is the most common form of cancer and is the leading global cause of cancer‐related death. 1 Non‐small‐cell lung cancer (NSCLC) accounts for approximately 85% of lung cancers. Over the last 20 years, we have achieved significant advancements in the early detection and treatment of NSCLC. However, the overall survival rates for NSCLC remain low, largely due to local invasion and distant metastasis. Therefore, it is important that we identify new prognostic markers and drug targets in order to improve outcomes for patients with NSCLC.
G‐protein‐signaling modulator 2 (GPSM2), also known as LGN, is widely recognized as a determinant of mitotic spindle orientation, 2 and along with G‐protein alpha and the nuclear mitotic apparatus protein NuMA, is a major contributor in establishing and maintaining cellular polarity. 3 G‐protein‐signaling modulator 2 contains 10 copies of a leu‐gly‐asn (LGN) repeat in the N‐terminal portion of the protein and 4 GoLoco motifs in the C‐terminal part of the protein, and is expressed ubiquitously in human tissues. 4 In addition, the genetic deletion or mutation of GPSM2 leads to defective brain development and nonsyndromic deafness in mice and humans; these are likely to represent defects in cell polarity. 5 , 6 , 7 Recent work identified the aberrant expression of GPSM2 in breast cancer, 8 hepatocellular carcinoma, 9 and pancreatic cancer. 10 However, whether GPSM2 plays a similar role in other tumors remains uncertain.
Epithelial‐mesenchymal transition (EMT) is a process in which epithelial cells lose their cell polarity to gain a mesenchymal phenotype. 11 Epithelial‐mesenchymal transition plays an important role during embryogenesis and development, and is activated in an aberrant manner in advanced cancer through a series of EMT‐inducing transcription factors (EMT‐TFs). 12 Snail, as an important EMT‐TF, promotes EMT by directly promoting the repression of E‐cadherin at the transcriptional level by binding to E‐box motifs. 13 , 14 Snail plays a vital role in the malignant progression of NSCLC and can also influence recurrence and prognosis. 15 , 16 Therefore, identifying the molecular mechanisms that regulate the action of Snail might allow us to identify new therapeutics against lung cancer metastasis.
In this study, we found that GPSM2 was downregulated in NSCLC tissues and cell lines, and is an independent prognostic factor in NSCLC patients. Moreover, we showed that the loss of GPSM2 promoted the EMT process in NSCLC cells by acting on the ERK/glycogen synthase kinase‐3β (GSK‐3β)/Snail pathway.
2. MATERIALS AND METHODS
2.1. Oncomine analysis
The Oncomine database (http://www.oncomine.org) is an online microarray database that includes 715 datasets, as well as 86 733 tissue samples (cancer and normal). In this study, the Oncomine database was used to analyze the mRNA expression levels of GPSM2 in different types of cancer. The search was carried out based on the following criteria: (i) type of analysis, cancer vs. normal tissues; (ii) type of data: mRNA; and (iii) thresholds: fold change of 2 and P value of .01.
2.2. GEPIA dataset analysis
GEPIA (http://gepia.cancer‐pku.cn/) is a database of data retrieved from the UCSC Xena server, which includes 9736 tumor samples and 8587 normal control samples. This database can be used to analyze differential gene expression levels in tumor tissues and paracancerous tissues, as well as patient survival and prognosis. In this study, we validated differential levels of GPSM2 mRNA expression in lung cancer and paracancerous tissues from patients with ovarian cancer using the database. P < .05 indicated statistically significant differences.
2.3. Patients and tissue samples
This study was approved by The Human Ethics Review Committee of the First Hospital of China Medical University. Eighty cases, with matched nontumorous and tumorous tissue samples, were enrolled in the study. Clinical characteristics, such as age, sex, age at initial diagnosis, and stage at diagnosis (tumor, node status, metastasis, and TNM classification), were obtained from medical records and pathological reports.
2.4. Immunohistochemistry analysis
Immunohistochemical staining was carried out as described previously. 17 Staining was carried out with an anti‐human GPSM2 rabbit Ab that was used at a dilution of 1:100 (ab84571; Abcam); PBS was used as a negative control. Each section was evaluated and scored independently by 2 pathologists. A semiquantitative scoring system was used in this assay. Intensity was scored as: 0, negative; 1, weak; 2, moderate; and 3, strong. We also calculated the proportion of tumor cells within each category. The proportional score was then multiplied by the staining intensity score to generate a final immunohistochemistry (IHC) score. The IHC scores ranged from 0 (minimum) to 300 (maximum). Positive expression of GPSM2 was defined as detectable immunoreactions with an IHC score greater than 10.
2.5. Cell culture
The NSCLC cancer cell lines PC9, A549, H460, and H1299 were obtained from the Cell Bank of Type Culture Collection of the Chinese Academy of Sciences. All cell lines were cultured in RPMI‐1640 supplemented with 10% FBS.
2.6. Reagents
All chemicals, including MTT, were obtained from Sigma‐Aldrich.
2.7. RNA isolation and real‐time PCR
RNA was isolated and reverse transcribed as previously described. 17 The primer sequences for amplification were as follows: forward 5′‐AGCCAGTCGGTACTTAGCCA‐3′ and reverse 5′‐TTGTGGTAGCAGGTGGTGGA‐3′ for GPSM2, and forward 5′‐GGTGAAGGTCGGAGTCAACGG‐3′ and reverse 5′‐GAGGTCAATGAAGGGGTCATTG‐3′ for the 18S control.
2.8. Western blot analysis
Western blot analysis was carried out as previously described. 17 The following primary Abs were used: GPSM2 rabbit polyclonal Ab (ab84571, 1:1000; Abcam), Twist mouse polyclonal Ab (ab50887, 1:25; Abcam), Twist2 mouse polyclonal Ab (ab57997, 1:500; Abcam), p‐ERK rabbit polyclonal Ab (4370S, 1:1000), ERK rabbit polyclonal Ab (9102, 1:1000), p‐GSK‐3β rabbit polyclonal Ab (#9323, 1:1000), GSK‐3β rabbit polyclonal Ab (#9315, 1:1000), Snail rabbit polyclonal Ab (3879S, 1:1000), Slug rabbit polyclonal Ab (9585, 1:1000), ZEB1 rabbit polyclonal Ab (4650, 1:1000) (all from Cell Signaling Technology), ZEB2 mouse polyclonal Ab (271 984, 1:250; Santa Cruz Biotechnology), and Actin mouse polyclonal Ab (sc‐47778, 1:250; Santa Cruz Biotechnology).
2.9. Generation of a stable GPSM2 expression cell line
The generation of a stable transfection cell line was undertaken as previously described. 18 Negative control (NC), GPSM2 shRNA, pcDNA 3.1 vector, and pcDNA3.1‐GPSM2 lentiviral particles were obtained from OBiO Technology. Cells were then infected with NC or GPSM2 shRNA lentiviral particles in accordance with the manufacturer’s instructions.
2.10. Wound healing assay
Cells were seeded into 6‐well plates. When the cells had almost grown to 100% confluence, we scratched the monolayer of cells with a 200‐μL pipette tip. Scratched fields were then selected randomly for analysis and appropriate images were captured by bright‐field microscopy.
2.11. Cell migration and invasion assay
Cell migration and invasion assays were carried out using Transwell chambers (Corning Scientific). For migration assays, cells were placed in the upper chamber of the Transwell insert; RPMI‐1640 containing 2% FBS was added to the lower chamber. After 24 hours, nonmigrated cells were removed from the upper surface of the chamber, while migrated cells on the lower surface of the chamber were stained with Wright‐Giemsa dye and photographed under light microscopy at ×200 magnification. Cell invasion experiments were identical to cell migration assays, except that the Transwell membranes were coated with Matrigel (BD Biosciences).
2.12. Gene set enrichment analysis
Non‐small‐cell lung cancer tissue datasets were downloaded from The Cancer Genome Atlas (TCGA; https://cancergenome.nih.gov). Gene set enrichment analysis (GSEA) was carried out using the JAVA program (http://www.broadinstitute.org/gsea) and TCGA datasets by comparing the expression of genes in the GPSM2‐high/‐low groups divided by the median expression level of GPSM2. The MSigDB H: hallmark gene set were used as a reference in this step to evaluate the pathways that GPSM2 might modulate.
2.13. Immunofluorescence
Cells were seeded overnight at a density of 4 × 10⁵ cells/well into Lab‐Tek chamber slides. Cells were then fixed in 3.3% paraformaldehyde, permeabilized with 0.2% Triton X‐100, blocked with 5% BSA, and then incubated with anti‐E‐cadherin and anti‐vimentin Abfor 60 minutes at room temperature in the dark. Alexa Fluor 546 or Alexa Fluor 488 IgG (Invitrogen) was then added to the blocking solution for 30 minutes at room temperature in the dark. After mounting with the Slow Fade Antifade Kit, the cells were visualized by fluorescence microscopy (Olympus).
2.14. Animal experiments
Female BALB/c nude mice, aged 4 weeks, were purchased from Beijing Vital River Laboratory Animal Technology and housed in a specific pathogen‐free environment in the Animal Laboratory Unit of China Medical University. Mice were randomized into 2 groups (n = 5 per group). In order to investigate in vivo metastasis, mice received an injection containing 1 × 10⁶ cells, into the tail. All animal experiments conformed to the Guide for Care and Use of Laboratory Animals and were approved by the Animal Care and Use Committee of China Medical University (reference number 2 018 113).
2.15. Statistical analysis
All data are presented as mean ± SD and are representative of at least 3 independent experiments. Statistical analyses were undertaken using SPSS 13.0 software (IBM). Statistical comparisons were carried out using 2‐tailed Student’s t tests and P values less than .05 were considered to represent statistical significance.
3. RESULTS
3.1. Expression of GPSM2 protein reduced in NSCLC tissues and represents a new prognostic predictor for patients with NSCLC
To explore the clinical significance of GPSM2 in NSCLC patients, we used IHC to investigate the expression of GPSM2 in a tissue microarray containing 80 NSCLC tissues and adjacent normal lung tissues. The cell types of GPSM2‐positive cells in normal tissues were alveolar epithelial and bronchial epithelial cells. The cell types of GPSM2‐positive cells in lung tumors were also alveolar epithelial cells and bronchial epithelial cells. In additional, GPSM2 is mainly localized in the nucleus of normal and cancer cells. Compared with normal lung tissue, the expression of GPSM2 was significantly reduced in NSCLC tissue samples (Figure 1A,B). Further analysis revealed that GPSM2 was downregulated in lung adenocarcinoma (LUAD) and lung squamous carcinoma (LUSC) tissue (Figure 1C). In addition, the IHC score, staining intensity score, and staining proportional score for GPSM2 was significantly reduced in cases of lymph node metastasis (Figure 1D) and NSCLC tissues with an advanced TNM stage (Figure 1E).
FIGURE 1.
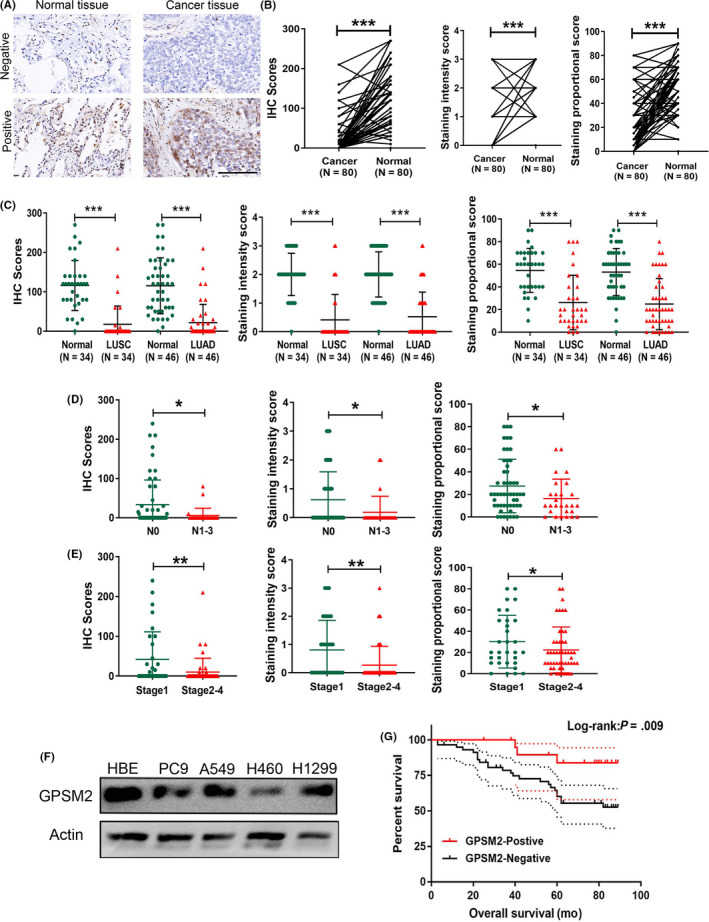
Downregulation of G‐protein‐signaling modulator 2 (GPSM2) in non‐small‐cell lung cancer (NSCLC) tissues and its correlation with clinicopathologic features and outcomes. A, Representative images of GPSM2 staining in NSCLC tissue and adjacent nontumorous lung tissue. B, Immunohistochemistry (IHC) score, staining intensity score, and staining proportional score, of GPSM2 were significantly decreased in NSCLC tissues compared to adjacent normal lung tissues. C, Subgroup analysis showing that GPSM2 was decreased in lung adenocarcinoma (LUAD) and lung squamous carcinoma (LUSC). D, E, IHC score, staining intensity score, and staining proportional score, of GPSM2 were significantly decreased with lymph node metastasis and advanced TNM stages. F, Western blot analysis of GPSM2 expression in different NSCLC cell lines and a normal bronchial epithelial cell line. G, Kaplan‐Meier survival analysis and log‐rank tests indicate that high levels of GPSM2 expression were associated with better outcomes (P = .009). Data represent mean ± SD; *P < .05, **P < .01, ***P < .001 vs. control group
Based on IHC scores, patients were divided into 2 groups, NSCLC‐positive and NSCLC‐negative. The χ2 test showed that low levels of GPSM2 expression were significantly correlated with lymph node metastasis (P = .019), and a higher TNM stage (P = .017) (Table 1). Moreover, GPSM2‐negative patients presented with a shorter overall survival time than GPSM2‐positive patients (P = .009) (Figure 1F). Univariate and multivariate analysis revealed that GPSM2 was an independent factor for overall survival (OS) in NSCLC patients. In contrast, the GPSM2‐negative group showed a shorter OS rate (hazard ratio, 0.222; 95% confidence interval, 0.052‐0.959; P = .044) (Table 2). These data indicate that GPSM2 could represent a new prognostic biomarker for NSCLC.
TABLE 1.
Correlation between the expression of G‐protein‐signaling modulator 2 (GPSM2) and clinical characteristics in patients with non‐small‐cell lung carcinoma (n = 80)
| Clinicopathologic parameter | Number | GPSM2 expression | P value | |
|---|---|---|---|---|
| Positive (n = 22) | Negative (n = 58) | |||
| Age (y) | ||||
| <60 | 32 | 11 | 21 | .261 |
| ≥60 | 48 | 11 | 37 | |
| Sex | ||||
| Male | 53 | 14 | 39 | .760 |
| Female | 27 | 8 | 19 | |
| Tumor size | ||||
| T1 | 17 | 6 | 11 | .159 |
| T2 | 44 | 14 | 30 | |
| T3 + T4 | 19 | 2 | 17 | |
| LN metastasis | ||||
| No | 53 | 19 | 35 | .019* |
| Yes | 27 | 3 | 24 | |
| TNM stage | ||||
| Ⅰ | 31 | 14 | 17 | .017* |
| Ⅱ | 39 | 7 | 32 | |
| Ⅲ+Ⅳ | 10 | 1 | 9 | |
LN, lymph node.
Significant correlation.
TABLE 2.
Cox regression analysis of overall survival in patients with non‐small‐cell lung carcinoma
| Variable | Univariate analysis | Multivariate analysis | ||||
|---|---|---|---|---|---|---|
| HR | 95% CI | P value | HR | 95% CI | P value | |
| Age (y) (≤60 vs > 60) | 0.805 | 0.369‐1.752 | .584 | – | – | – |
| Gender (male vs female) | 0.630 | 0.253‐1.569 | .321 | – | – | – |
| pT stage | 3.279 | 1.462‐7.354 | .004* | 2.546 | 1.129‐5.739 | .024* |
| pN stage | 1.574 | 0.723‐3.427 | .253 | – | – | – |
| pTNM stage | 2.537 | 0.953‐6.754 | .062 | – | – | – |
| GPSM2 expression | 0.181 | 0.043‐0.766 | .020* | 0.222 | 0.052‐0.959 | 0.044* |
Factors for which P < .05 in univariate analysis were subsequently used for multivariate analysis.
–, not included in analysis; CI, confidence interval; GPSM2, G‐protein‐signaling modulator 2; HR, hazard ratio.
P < .05 was the significant value for *.
Furthermore, the mRNA expression levels of GPSM2 in different types of cancer were analyzed using the Oncomine database. The results showed that the expression of GPSM2 was elevated in multiple tumor types, such as colorectal cancer and sarcoma. However, the expression of GPSM2 in lung cancer did not differ significantly from that of normal lung tissue (Figure S1A). In addition, we validated the differential mRNA expression levels of GPSM2 in cancerous and lung cancer tissues using the GEPIA database, which is based on the TCGA database. Results showed that GPSM2 did not show any significant changes in LUAD or LUSC tissue when compared with normal lung tissue, suggesting that posttranscriptional regulation accounts for the reduced levels of GPSM2 during NSCLC progression (Figure S1B).
3.2. Knockdown of GPSM2 accelerated metastasis of NSCLC cells in vitro and in vivo
Because the χ2 test of clinicopathologic data showed that low GPSM2 expression was significantly correlated with lymph node metastasis, we further investigated the role of GPSM2 in NSCLC cell metastasis. A549 and H1299 cell lines were chosen for further investigation because of their high levels of GPSM2 expression. We constructed 2 stable cell lines, A549‐shGPSM2 and H1299‐shGPSM2. The transfection efficiency was quantified by quantitative (q)RT‐PCR and western blot analysis (Figure 2A,B). The MTT assays revealed that GPSM2 have little effect on cancer cell proliferation and growth following the knockdown of GPSM2 for 24 hours (Figure S2); this ruled out the interference on metastasis ability caused by cell proliferation ability. Wound healing assays further showed that the loss of GPSM2 significantly increased the capacity of A549 and H1299 cells to migrate (Figure 2C). Furthermore, Transwell assays revealed that the knockdown of GPSM2 enhanced the migration and invasion ability of A549 and H1299 cells (Figure 2D).
FIGURE 2.
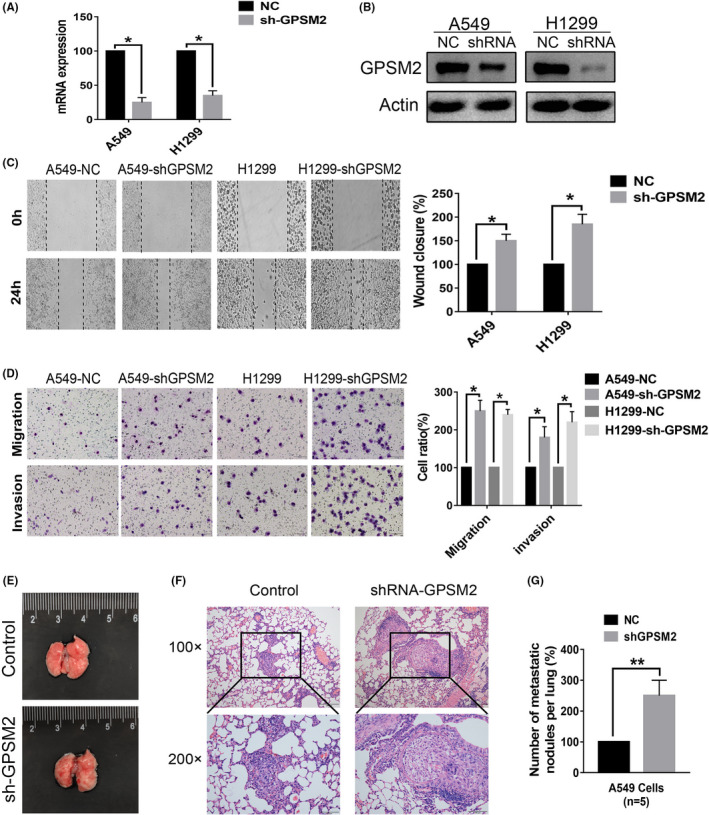
Knockdown of G‐protein‐signaling modulator 2 (GPSM2) accelerated the metastasis ability of non‐small‐cell lung cancer cells in vitro and in vivo. A, B, GPSM2 expression levels were detected by quantitative RT‐PCR (left) and western blot analysis (right) after transfection with either a negative control (NC) or GPSM2 shRNA. C, Wound healing assays showed that the knockdown of GPSM2 increased the migration ability of A549 cells. D, The number of cells on Transwell membranes was monitored for 24 h (left); migration and invasion abilities were then quantified further (right). E, Representative views of the lung 6 weeks after tail vein injection. F, Representative images of microscopic tumor nodes in lung tissue stained with H&E. G, Mean number of metastasis nodules. Data represent mean ± SD. *P < .05, **P < .01, ***P < .001 vs. control group
To further verify the mechanisms that might regulate the expression of GPSM2 in NSCLC metastasis, we constructed in vivo models of metastasis. The GPSM2‐shRNA group showed increased numbers of metastatic tumor colonies compared with the control group (Figure 2E‐G). Taken together, these data indicated that GPSM2 plays an important role in the metastasis of NSCLC cells.
3.3. Overexpression of GPSM2 inhibited metastatic ability of NSCLC cells in vitro and in vivo
To further validate these results, we next overexpressed GPSM2 in the H460 cell line, which expresses a low level of GPSM2. Transfection efficiency was quantified by qRT‐PCR and western blot analysist (Figure 3A,B). Furthermore, Transwell assays revealed that the overexpression of GPSM2 inhibited the migration and invasion ability of H460 cells (Figure 3C). In vivo models of metastasis showed that numbers of metastatic tumor colonies were lower in the group overexpressing GPSM2 than the group containing the empty vector. These results show that GPSM2 expression impacts metastasis in NSCLC cells.
FIGURE 3.
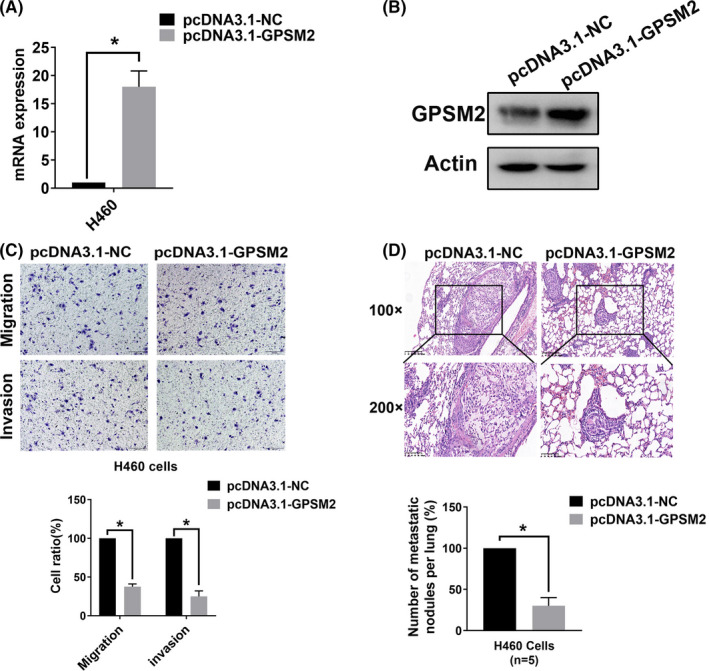
Overexpression of G‐protein‐signaling modulator 2 (GPSM2) reduced the metastatic ability of non‐small‐cell lung cancer cells in vitro and in vivo. A, B, GPSM2 expression levels were detected by quantitative RT‐PCR (left) and western blot analysis (right) after transfection with either pcDNA 3.1‐negative control (NC) or pcDNA 3.1‐GPSM2. C, The number of cells on Transwell membranes was monitored for 24 h; migration and invasion abilities were then quantified further. D, Representative images of microscopic tumor nodes in lung tissue stained with H&E (upper images); mean number of metastatic nodules (lower images). Data represent mean ± SD. *P < .05, **P < .01, ***P < .001 vs. control group
3.4. Loss of GPSM2‐induced EMT in NSCLC cells
To further investigate the mechanisms that GPSM2 might play in the metastasis of NSCLC cells, we carried out GSEA. This was based on TCGA database and was used to analyze the pathways that GPSM2 might regulate. The Cancer Genome Atlas samples were divided into GPSM2‐high and GPSM2‐low groups by the median expression level of GPSM2. Then we compared genesets from GPSM2‐high/‐low groups using GSEA. The aberrant expression of GPSM2 was associated with a significant enrichment in “HALLMARK_EPITHELIAL_MESENCHYMAL_TRANSITION” pathways (Normalized Enrichment Score = 1.243, P = .028) (Figure S3A). Further analysis (shown in Figure S3B) showed that the mRNA expression of GPSM2 was negatively correlated with the mesenchymal marker VIM (r = −0.3182, P < .001), and positively correlated with the epithelial marker CDH1 (r = 0.174, P < .001). The mRNA expression of GPSM2 did not show a significant correlation with the mRNA expression of Snail (r = −0.04, P = .179). These results suggest that GPSM2 might regulate the EMT process in NSCLC.
Next, we attempted to confirm whether GPSM2 could regulate EMT. A549 and H1299 cells showed a typical epithelial phenotype, whereas A549‐shGPSM2 and H1299‐shGPSM2 showed an elongated and spindle‐shaped mesenchymal phenotype (Figure 4A). Western blotting (Figure 4B) and immunofluorescence (Figure 4C) detected an increase in E‐cadherin and a decrease in vimentin in cells in which GPSM2 had been knocked down. We also detected downregulation of the transcription factor Snail in cells in which GPSM2 had been knocked down (Figure 4D). These data indicate that the loss of GPSM2 accelerates the EMT process in NSCLC cells.
FIGURE 4.
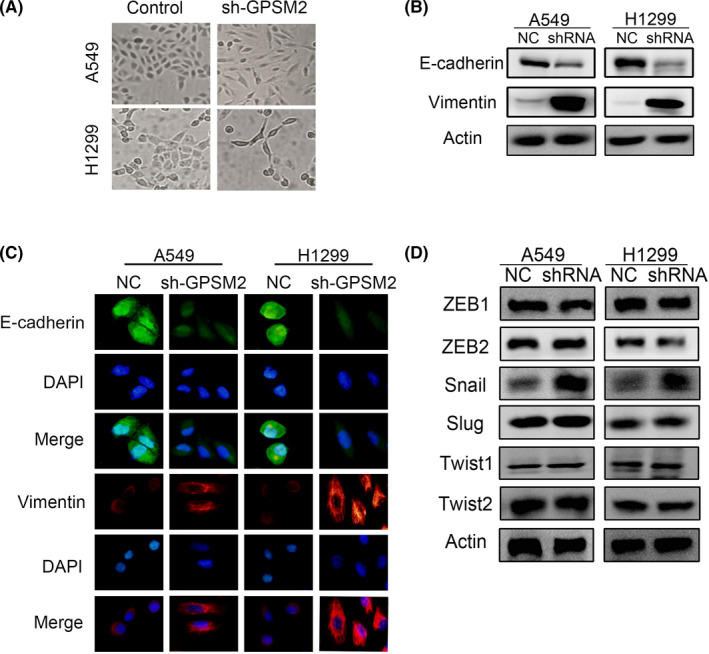
Silencing of G‐protein‐signaling modulator 2 (GPSM2) induced the epithelial‐mesenchymal transition (EMT) process in non‐small‐cell lung cancer cells. A, Representative images of morphological changes. Images were taken at ×20 magnification. B, Expression of EMT markers was detected by western blotting. β‐Actin was used as the internal loading control. C, Cells were stained with Abs to E‐cadherin (green) and vimentin (red). Images were captured by fluorescence microscopy at ×40 magnification. D, Protein expression of EMT‐inducing transcription factors was detected by western blot. NC, negative control
3.5. Low levels of GPSM2 expression correlate with expression of Snail in NSCLC tissues
To further define the correlation between GPSM2 and Snail in primary NSCLC tissues, we used IHC to evaluate the expression levels of GPSM2 and Snail in serial sections of NSCLC tissues. Representative images are shown in Figure 5A. A highly significant negative correlation (r = −0.3003, P = .007) was detected between the IHC scores of GPSM2 and Snail expression (Figure 5B). These results indicated that GPSM2 represses Snail in NSCLC tissues and further supports the crucial role of GPSM2 in the metastasis of NSCLC.
FIGURE 5.
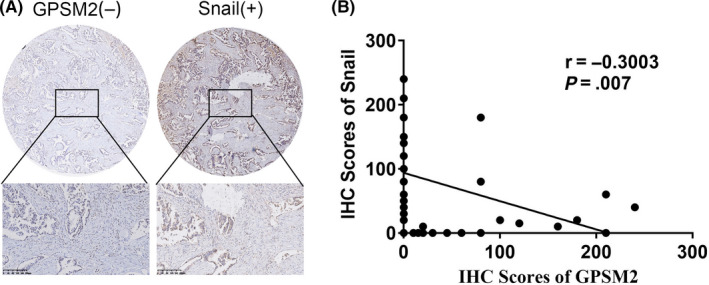
G‐protein‐signaling modulator 2 (GPSM2) was negatively correlated with Snail in human non‐small‐cell lung cancer (NSCLC) tissues. A, Immunohistochemistry (IHC) for GPSM2 and Snail was carried out on 80 human NSCLC samples. Representative images showing the high expression levels of Snail and the low expression levels of GPSM2. B, Negative correlation between GPSM2 and Snail (r = ‐0.3003; P = .007)
3.6. Knockdown of GPSM2 induces EMT by activating ERK/GSK‐3β/Snail pathway
Several studies have reported that the activity of ERK plays an important role in promoting EMT by inducing the phosphorylation of GSK‐3β, thus leading to the stabilization of Snail. 19 , 20 A previous study also reported that the CXCL5/CXCR2 axis played a role in the metastasis of nasopharyngeal carcinoma by inducing EMT through ERK/GSK3β/Snail signaling. 21 Therefore, we attempted to explore the influence of GPSM2 on ERK/GSK‐3β/Snail signaling. To confirm our hypothesis, we used an ERK inhibitor, PD98059, to inhibit ERK activity in a rescue experiment. Western blot assays indicated that PD98059 could reduce the expression levels of p‐ERK, p‐GSK‐3β, and Snail; these were upregulated by GPSM2‐shRNA (Figure 6A). Transwell migration and invasion assays further showed that PD98059 could effectively reduce the migration and invasion capacity of both A549‐shGPSM2 and H1299‐shGPSM2 cells (Figure 6B,C).
FIGURE 6.
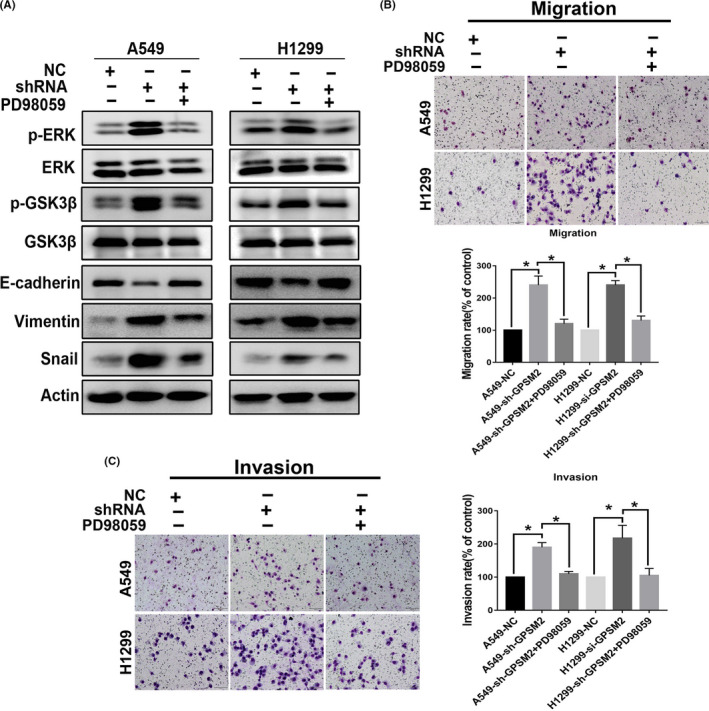
G‐protein‐signaling modulator 2 (GPSM2) induced epithelial‐mesenchymal transition (EMT) by activating the ERK/glycogen synthase kinase‐3β (GSK‐3β)/Snail pathway in non‐small‐cell lung cancer. A, Western blot analysis showing that the ERK inhibitor PD98059 effectively inhibited activation of the ERK/GSK‐3β signaling induced by GPSM2‐shRNA and EMT. B, C, Cell migration and invasion ability was quantified by treating GPSM2‐shRNA cells with PD98059 (10 μM) for 24 h. Data represent mean ± SD. *P < .05, **P < .01, ***P < .001 vs. control group. NC, negative control
It remains uncertain that the activation of GSK‐3β was specifically affected by the EMT phenotype in NSCLC cancer cells. To confirm the effect of GSK‐3β on the EMT process, we transfected A549 and H1299 cells with GSK‐3β‐siRNA or NC‐siRNA. The expression of the epithelial marker E‐cadherin was significantly increased, and the expression of the mesenchymal marker vimentin was significantly decreased, following the transfection of GSK‐3β siRNA. Furthermore, the expression of the EMT‐related transcription factor Snail was markedly downregulated (Figure S4A). In addition, the cell migration and invasion abilities were significantly reduced following GSK‐3β siRNA transfection (Figure S4B). These data indicate that GSK‐3β siRNA reversed EMT phenotypes by inhibiting the expression of Snail. Collectively, these data indicate that the loss of GPSM2 promoted the ability of NSCLC to undergo metastasis through the ERK/GSK‐3β/Snail signaling pathway.
4. DISCUSSION
Non‐small‐cell lung carcinoma is the leading global cause of cancer‐related death each year. Identifying new biomarkers and prognostic factors is therefore essential if we are to improve the OS of patients with NSCLC. Several studies have reported that GPSM2 plays an important role in the localization and mitotic spindle orientation of cells involved in the regulation of the cell cycle and planar epithelial divisions. It is well known that disorders of the cell cycle and cell division are involved in tumorigenesis. Consequently, it is likely that GPSM2 plays an important role in the progression of tumors.
Previous studies have reported the overexpression of GPSM2 in breast cancer its important role in the division of breast cancer cells. 8 It has also been reported that the expression of GPSM2 is higher in hepatocellular carcinoma tissues than in normal liver tissue; in addition, GPSM2 was related to tumor size, infection with hepatitis B virus, and prognosis. 9 However, the role of GPSM2 in NSCLC has yet to be elucidated. Our study is the first to report that the expression levels of GPSM2 protein are consistently downregulated in NSCLC tissue samples and cell lines. Furthermore, there were no significant differences in the expression of GPSM2 in lung cancer tissue when compared with normal lung tissue, at least when based on data from a public database. These results suggested that a reduction in the protein expression of GPSM2 might be caused by posttranslational modification; this needs to be addressed by future research. Moreover, we found that GPSM2 levels were correlated with patient prognosis and clinicopathologic features. Cox regression analyses indicated that the expression of GPSM2 was an independent prognostic factor for patients with NSCLC. Based on these results, we can report, for the first time, the relationship between GPSM2 and the prognosis of NSCLC patients, thus indicating that GPSM2 represents a potential biomarker for NSCLC.
Metastasis is the primary cause of cancer mortality. 15 Moreover, high metastatic potential is one of the major hallmarks of cancer cells. 22 A previous study indicated that GPSM2 facilitates tumor metastasis in hepatocellular carcinoma. 9 Another study showed that the downregulation of GPSM2 significantly reduced the ability of cancer to migrate in pancreatic cells. 10 In the present study, we attempted to explore the regulatory effect of GPSM2 in NSCLC metastasis. Our results showed that the knockdown of GPSM2 expression in NSCLC cells promoted cell metastasis, both in vivo and in vitro. These results suggest that GPSM2 is a potential suppressor gene of metastasis in NSCLC. Furthermore, GSEA and bioinformatic data showed that GPSM2 might regulate the process of EMT. Epithelial‐mesenchymal transition is a cellular program that is well known to be crucial for malignant progression 23 and confers increased levels of tumor‐initiating and metastatic potential. 24 The process of EMT is under strict regulation, in which transcription factors play a critical role in promoting EMT. 25 Snail is a zinc‐finger transcriptional factor, and acts as a switch for the EMT process. 13 Our results showed that the knockdown of GPSM2 induces EMT and could upregulate the expression of Snail. In additional, our IHC results confirmed that GPSM2 represses Snail in NSCLC tissues. Collectively, these results indicate that the knockdown of GPSM2 accelerates the metastatic ability of NSCLC cells by inducing the expression of Snail, thus promoting EMT. Therefore, GPSM2 represents a key target in the regulation of tumor invasion and metastasis in NSCLC cells.
Another important finding of our study was that GPSM2 regulates the expression of the ERK/GSK3β/Snail pathway. Several studies have indicated that the ERK/GSK‐3β pathway plays a crucial role in promoting EMT by inducing the stability of Snail. A previous study showed that MCP‐1 induced EMT through the ERK/GSK‐3β/Snail signaling pathway in breast carcinoma. 26 In another study, the ERK/GSK‐3β/Snail signaling pathway was shown to be involved in alveolar EMT. 20 Our present study indicated that the loss of GPSM2 upregulates the expression of Snail by activating ERK/GSK‐3β. Our results therefore showed that GPSM2 regulates the metastatic ability and progression of EMT in NSCLC cells by regulating the ERK/GSK‐3β/Snail pathway.
There are some limitations to this study that need to be considered. First, the precise mechanism underlying the interaction between GPSM2 and ERK was not fully elucidated. We speculate that this may be related to the regulation of G‐protein‐coupled receptors (GPCRs) by GPSM2. It is well known that ERK can be activated by GPCRs and is the downstream of GPCRs. 27 , 28 We will investigate this possibility further in our future research. In additional, the clinical application of GPSM2 as a potential biomarker requires further comprehensive and in‐depth analyses.
In conclusion, our results strongly suggest that GPSM2 plays a critical role in NSCLC. Importantly, we found that GPSM2 was downregulated in NSCLC tissues and represents an independent prognostic factor. Mechanistically, the knockdown of GPSM2 induced EMT by activating the ERK/GSK‐3β/Snail pathway, thus leading to the metastasis of cancer.
CONFLICT OF INTEREST
The authors declare that they have no competing interests.
Supporting information
Fig S1
Fig S2
Fig S3
Fig S4
ACKNOWLEDGMENTS
This work was supported by the National Natural Science Foundation of China (Reference Numbers 81972197 and 81472193).
Deng M, Liu B, Zhang Z, et al. Knockdown of G‐protein‐signaling modulator 2 promotes metastasis of non‐small‐cell lung cancer by inducing the expression of Snail. Cancer Sci. 2020;111:3210–3221. 10.1111/cas.14519
Contributor Information
Ye Zhang, Email: yzhang21@cmu.edu.cn.
Xuejun Hu, Email: xjh@cmu.edu.cn.
REFERENCES
- 1. Hirsch FR, Scagliotti GV, Mulshine JL, et al. Lung cancer: current therapies and new targeted treatments. Lancet. 2017;389:299‐311. [DOI] [PubMed] [Google Scholar]
- 2. Du Q, Stukenberg PT, Macara IG. A mammalian Partner of inscuteable binds NuMA and regulates mitotic spindle organization. Nat Cell Biol. 2001;3:1069‐1075. [DOI] [PubMed] [Google Scholar]
- 3. Woodard GE, Huang NN, Cho H, Miki T, Tall GG, Kehrl JH. Ric‐8A and Gi alpha recruit LGN, NuMA, and dynein to the cell cortex to help orient the mitotic spindle. Mol Cell Biol. 2010;30:3519‐3530. [DOI] [PMC free article] [PubMed] [Google Scholar]
- 4. Mochizuki N, Cho G, Wen B, Insel PA. Identification and cDNA cloning of a novel human mosaic protein, LGN, based on interaction with G alpha i2. Gene. 1996;181:39‐43. [DOI] [PubMed] [Google Scholar]
- 5. Walsh T, Shahin H, Elkan‐Miller T, et al. Whole exome sequencing and homozygosity mapping identify mutation in the cell polarity protein GPSM2 as the cause of nonsyndromic hearing loss DFNB82. Am J Hum Genet. 2010;87:90‐94. [DOI] [PMC free article] [PubMed] [Google Scholar]
- 6. Doherty D, Chudley AE, Coghlan G, et al. GPSM2 mutations cause the brain malformations and hearing loss in Chudley‐McCullough syndrome. Am J Hum Genet. 2012;90:1088‐1093. [DOI] [PMC free article] [PubMed] [Google Scholar]
- 7. Konno D, Shioi G, Shitamukai A, et al. Neuroepithelial progenitors undergo LGN‐dependent planar divisions to maintain self‐renewability during mammalian neurogenesis. Nat Cell Biol. 2008;10:93‐101. [DOI] [PubMed] [Google Scholar]
- 8. Chikako F, Koji U, Toshihiko N, Toyomasa K, Yusuke N. Critical roles of LGN/GPSM2 phosphorylation by PBK/TOPK in cell division of breast cancer cells. Genes Chromosomes Cancer. 2010;49:861‐872. [DOI] [PubMed] [Google Scholar]
- 9. He XQ, Zhang YF, Yu JJ, et al. High expression of G‐protein signaling modulator 2 in hepatocellular carcinoma facilitates tumor growth and metastasis by activating the PI3K/AKT signaling pathway. Tumour Biol. 2017;39:1–10. [DOI] [PubMed] [Google Scholar]
- 10. Dang SC, Qian XB, Jin W, Cui L, Chen JX, Gu M. G‐protein‐signaling modulator 2 expression and role in a CD133(+) pancreatic cancer stem cell subset. Onco Targets Ther. 2019;12:785‐794. [DOI] [PMC free article] [PubMed] [Google Scholar] [Retracted]
- 11. Gandalovičová A, Vomastek T, Rosel D, Brábek J. Cell polarity signaling in the plasticity of cancer cell invasiveness. Oncotarget. 2016;7:25022‐25049. [DOI] [PMC free article] [PubMed] [Google Scholar]
- 12. Skrypek N, Goossens S, De Smedt E, Vandamme N, Berx G. Epithelial‐to‐Mesenchymal Transition: Epigenetic Reprogramming Driving Cellular Plasticity. Trend Genet. 2017;33:943‐959. [DOI] [PubMed] [Google Scholar]
- 13. Wang Y, Shi J, Chai K, Ying X, Zhou BP. The Role of Snail in EMT and Tumorigenesis. Curr Cancer Drug Targets. 2013;13:963‐972. [DOI] [PMC free article] [PubMed] [Google Scholar]
- 14. Baulida J, García de Herreros A. Snail1‐driven plasticity of epithelial and mesenchymal cells sustains cancer malignancy. Biochem Biophys Acta. 2015;1856:55‐61. [DOI] [PubMed] [Google Scholar]
- 15. Wang X, Liu R, Zhu W, et al. UDP‐glucose accelerates SNAI1 mRNA decay and impairs lung cancer metastasis. Nature. 2019;571:127‐131. [DOI] [PubMed] [Google Scholar]
- 16. Faget J, Groeneveld S, Boivin G, et al. Neutrophils and Snail Orchestrate the Establishment of a Pro‐tumor Microenvironment in Lung Cancer. Cell Rep. 2017;21:3190‐3204. [DOI] [PubMed] [Google Scholar]
- 17. Deng M, Yu R, Wang S, et al. Limb‐Bud and Heart Attenuates Growth and Invasion of Human Lung Adenocarcinoma Cells and Predicts Survival Outcome. Cell Physiol Biochem. 2018;47:223‐234. [DOI] [PubMed] [Google Scholar]
- 18. Liu B, Zhang Y, Fan Y, et al. Leucine‐rich Repeat Neuronal Protein‐1(LRRN1) Suppresses Apoptosis of Gastric Cancer Cells through Regulation of Fas/FasL. Cancer Sci. 2019:110(7):2145‐2155. [DOI] [PMC free article] [PubMed] [Google Scholar]
- 19. Zheng H, Li W, Wang Y, et al. Glycogen synthase kinase‐3 beta regulates Snail and β‐catenin expression during Fas‐induced epithelial‐mesenchymal transition in gastrointestinal cancer. Eur J cancer. 1990;2013(49):2734‐2746. [DOI] [PubMed] [Google Scholar]
- 20. Nagarajan D, Melo T, Deng Z, Almeida C, Zhao W. ERK/GSK3β/Snail signaling mediates radiation‐induced alveolar epithelial‐to‐mesenchymal transition. Free Radic Biol Med. 2012;52:983‐992. [DOI] [PMC free article] [PubMed] [Google Scholar]
- 21. Qiu WZ, Zhang HB, Xia WX, et al. The CXCL5/CXCR2 axis contributes to the epithelial‐mesenchymal transition of nasopharyngeal carcinoma cells by activating ERK/GSK‐3β/snail signalling. J Exp Clin Can Res. 2018;37:85. [DOI] [PMC free article] [PubMed] [Google Scholar]
- 22. Hanahan D, Weinberg RA. Hallmarks of cancer: the next generation. Cell. 2011;144:646‐674. [DOI] [PubMed] [Google Scholar]
- 23. Lu W, Kang Y. Epithelial‐mesenchymal plasticity in cancer progression and metastasis. Dev Cell. 2019;49:361‐374. [DOI] [PMC free article] [PubMed] [Google Scholar]
- 24. Dongre A, Weinberg RA. New insights into the mechanisms of epithelial–mesenchymal transition and implications for cancer. Nat Rev Mol Cell Biol. 2019;20(2):69‐84. [DOI] [PubMed] [Google Scholar]
- 25. Goossens S, Vandamme N, Vlierberghe PV, Berx G. EMT transcription factors in cancer development re‐evaluated: Beyond EMT and MET Biochimica et Biophysica Acta (BBA) ‐ Reviews on . Cancer. 2017;1868(2):584‐591. [DOI] [PubMed] [Google Scholar]
- 26. Li S, Lu J, Chen Y, et al. MCP‐1‐induced ERK/GSK‐3β/Snail signaling facilitates the epithelial–mesenchymal transition and promotes the migration of MCF‐7 human breast carcinoma cells. Cell Mol Immunol. 2017;14:621. [DOI] [PMC free article] [PubMed] [Google Scholar]
- 27. Watson U, Jain R, Asthana S, Saini DK. Spatiotemporal modulation of ERK activation by GPCRs. International review of cell and molecular biology. Int Rev Cell Mol Biol. ; 2018;338:111‐140. [DOI] [PubMed] [Google Scholar]
- 28. Jain R, Watson U, Vasudevan L, Saini DKERK. Activation Pathways Downstream of GPCRs. Int Rev Cell Mol Biol. 2018;338:79–109. [DOI] [PubMed] [Google Scholar]
Associated Data
This section collects any data citations, data availability statements, or supplementary materials included in this article.
Supplementary Materials
Fig S1
Fig S2
Fig S3
Fig S4


