

Abstract
Dermatologists rely primarily on clinical examination in combination with histopathology to diagnose conditions; however, clinical examination alone might not be sufficient for accurate diagnosis and skin biopsies have associated morbidity. With continued technological advancement, there are emerging ancillary imaging technologies available to dermatologists to aid in diagnosis and management. This 2-part review article will discuss these emerging technologies including: digital photographic imaging, confocal microscopy, optical coherence tomography, and high-frequency ultrasound, as well as several additional modalities in development. In this first installment, the authors describe the breadth of technologies available and the science behind them. Then, in the second article, the authors discuss the applications and limitations of these technologies and future directions.
Keywords: confocal microscopy, dermatology, dermoscopy, digital photographic imaging, fluorescence imaging, high-frequency ultrasound, machine-based learning, multispectral optoacoustic tomography, optical coherence tomography, Raman spectroscopy
CAPSULE SUMMARY
•Dermoscopy and digital clinical imaging improve clinical diagnosis and document changing lesions.
•New emerging technologies include confocal microscopy, optical coherence tomography, high-frequency ultrasound, Raman spectroscopy, and fluorescence imaging, which may be integrated into clinical practice to aid in patient diagnosis and management.
There have been significant advances in ancillary imaging technologies that aid in diagnosis and management. Technologies addressed in detail include digital photographic imaging, dermoscopy, confocal microscopy, optical coherence tomography (OCT), high-frequency ultrasound (HFUS), multispectral optoacoustic tomography, Raman spectroscopy, and fluorescent imaging. In this 2-part review article, the authors first describe the breadth of technologies available and their mechanisms. The second article discusses applications, limitations, and future directions.1
Machine-based learning is an important adjuvant technology that is becoming integrated into many emerging imaging modalities. It is critical to understand this concept before learning about imaging technologies in dermatology. Increased usage of digital photography has led to growing image databases. Algorithms generated by computer technology software aids clinicians with diagnostic accuracy. Artificial intelligence, database analysis, and machine-based learning are all phrases used interchangeably to describe this process. A computer learns using databases with images of known diagnoses via variations in image pixels. The computer then extrapolates pixel variations of diagnoses to unknown digital images. Current algorithms examine digital photographs, dermoscopic images and, at times, histopathologic images.2 Computer algorithms can make clinical diagnoses with high accuracy (<5% error rate)—at times even outperforming clinicians. To maintain accuracy, algorithms train using large photo databases.3 Many new technologies have this technology integrated into the device or as a potential future direction to aid in diagnostic accuracy and risk stratification.
DIGITAL PHOTOGRAPHIC IMAGING
Photographic imaging of patients enables dermatologists to monitor individuals longitudinally and quantitatively and qualitatively assess therapeutic responses. Reflectance and back scatter are the main components of light reflected off the skin’s surface and are important concepts for imaging discussions; reflectance maintains the plane of incident polarized light allowing visualization of skin surface features, and back-scattered light becomes depolarized and aids in identification of subsurface structures.
Polarizing filters attached to the camera’s lens separates these components. Parallel-polarized photography visualizes skin texture and scale. When oriented orthogonally, the technique is cross-polarized photography and enhances vascularity and pigmentation.4,5
Total-body digital photography (TBDP) images the entire skin surface at 1 static time. The main utility is monitoring patients with numerous melanocytic lesions to identify changing or newly developing lesions, thus improving biopsy efficiency.6,7 Photographs should be obtained by using standardized methods for optimal comparison, which is a major advantage of commercial systems. Commercial systems often have cameras mounted in standard positions, enabling the capture of reproducible images with similar positioning and lighting. Several devices provide an additional feature of superimposing dermoscopic images.8 Furthermore, these systems often have computer algorithms that increase the accuracy of lesion identification.6 A limitation of standard 2-dimensional photography is that it lacks consistency of lesion size due to variation in photograph angle; 3-dimensional (3D) imaging overcomes this issue.
3D imaging systems capture a complete 360° head-to-toe image efficiently. Multiple cameras at different vantage points fire simultaneously; images are then modified by computer software to create the 3D image. The image accurately reconstructs the patient with life-like quality.9,10 This method standardizes images and limits movement artifacts due to acquisition speed.9 The complete 3D image can be overlaid with close-ups of specific lesions, which can be further overlaid with dermoscopy.11
Another interesting application of TBDP includes the use of smartphone applications to aid in storage of professional photographs on patient’s personal devices. Such an application would remind patients to perform self-skin examinations using their stored TBDP as a reference to identify any evolving lesions.12,13 A study from the University of Pennsylvania found that patients who utilized this software had a higher satisfaction rate during self-skin examination compared with patients with other storage forms of TBDP.12
DERMOSCOPY
Dermoscopy (epiluminescence microscopy) involves the use of a handheld device to magnify the skin’s surface up to a 10× microscope objective, enabling visualization of the epidermis and superficial papillary dermis.14,15 Dermoscopy similarly involves the concepts of reflectance and backscatter, and devices contain polarizing filters to separate these components. Contact dermoscopy is best performed with a wet field (alcohol or imaging gel) to reduce the refractive index between the skin and dermatoscope lens. This practice allows for increased light at the detector and improved image resolution. Noncontact dermoscopy can also be used. Many modern dermatoscopes have polarized and nonpolarized capability.14
CONFOCAL MICROSCOPY
Confocal microscopy provides cellular resolution of skin and cutaneous structures. Confocal microscopes have an 830-nm (near-infrared) laser and create images by utilizing intrinsic differences between refractive indexes of cellular structures, especially melanin, collagen, and keratin. When the laser reaches skin, some light energy is absorbed and some is reflected toward the device. A pinhole permits only light reflected from the focal plane to be collected by the detector.14,16 By eliminating signals from adjacent planes, confocal microscopy provides high-resolution images even with thick, in vivo samples. Confocal microscopy has a lateral resolution of 1 μm and magnification equivalent to a 30x microscope objective.16
Melanin and keratin provide contrast in confocal images.17,18 Melanin has the strongest refractive index of 1.7, and keratin’s refractive index is 1.5.15,16 Collagen and inflammatory cells are other highly refractile structures.16 These structures appear bright white when reflected light reaches the detector whereas nonreflective structures appear dark. The interplay between highly, moderately, and nonreflective structures generates a black and white image representing the area at the cellular level (Fig 1).16,17
Fig 1.
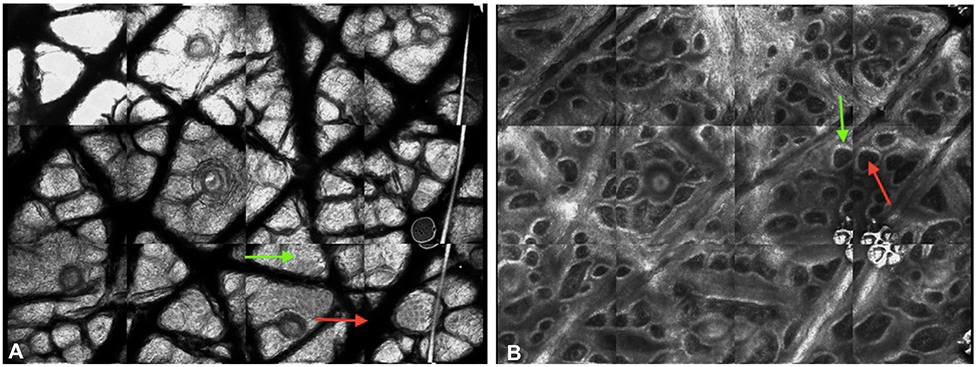
Confocal images of normal skin. The interplay between the highly reflective, moderately reflective, and nonreflective structures results in the generation of black and white images that correspond to different structures. A, Stratum corneum. Large, refractile anucleated corneocytes (green arrow) are difficult to distinguish. Dermatoglyphs (red arrow) are seen as large dark spaces. B, Dermal-epidermal junction. Dermal papillae with dark interiors (red arrow) are circumscribed by refractile basal cells (green arrow).
Generated images are horizontal and parallel to the skin surface (en face), which contrasts with the perpendicular images viewed on histopathology (bread-loaf sections). Larger mosaic images (500 × 500 μm) can be created by stitching together multiple individual lesions with the software VivaBlock. A mosaic scans up to an 8 × 8 mm area.16 The most frequently used device is the Vivascope 1500 (Caliber ID, Rochester, NY). Because of the limitations of imaging contoured surfaces, the handheld device Vivascope 3000 (Caliber ID) was developed. Although useful with curved surfaces, the Vivascope 3000 requires greater care to avoid movement artifacts.16,18
There are 2 types of confocal microscopy: reflectance confocal microscopy and fluorescence confocal microscopy. Reflectance confocal microscopy highlights the refractive index differences of cellular structures in vivo to provide contrast. Fluorescence confocal microscopy (or dyeenhanced multimodal confocal microscopy) involves the use of exogenous contrast agents to enhance refractility of cutaneous structures.17,19 Many exogenous contrast agents have been used; depending on toxicity, some remain for ex vivo use only, but aluminum chloride can be used in vivo.20 Acridine orange is the most common exogenous fluorescent nuclear stain. This stain does not alter the tissue, so acridine orange–stained specimens can undergo histologic processing.17
Confocal imaging generates images at the cellular level and has the highest resolution of current imaging devices. The main limitation is penetration depth of ~200 μm, which correlates with the papillary dermis.15,21
OPTICAL COHERENCE TOMOGRAPHY
OCT involves the use of back-scattered light to generate images. Contrast is provided by variations in the refractive indexes from various skin components.22,23 OCT is performed in real-time with rapid image acquisition (<1 minute).14,15,24 In OCT, echo time delay and the intensity of back-scattered light from tissue microstructures is measured. Because light travels quickly (3 × 10⁸ m/s), the time delay between reflected echoes cannot be measured by electronics. It is instead performed by correlations or interferometry techniques, where backscattered light from the specimen is compared with a known reference. With OCT, near-infrared and infrared light (800-1300 nm) are applied to the skin. Correlations are performed between the back-scattered light from the reference mirror to that of the specimen. The incident beam is scanned transversely while the backscattering profile is analyzed at various positions, resulting in a gray-scale image.21
Depth of penetration depends on the center wavelength of the incident beam. Longer wavelengths enable the visualization of deeper structures, while shorter wavelengths (~800 nm) result in better resolution. Coherence length of the light source determines axial and depth resolutions, and focused spot size of the incident beam determines lateral image resolution.21 Most OCT devices obtain a scan depth of 2 mm, axial resolution of 5-10 μm, and lateral resolution of 7.5 μm.14,22,24,25 These device specifications enable visualization of the stratum corneum, epidermis, upper dermis, appendages, and blood vessels. OCT cannot be used to visualize individual cells and, thus, has lower resolution than standard histology.24
Dynamic OCT (or speckle variant OCT) can be used to visualize blood flow in vivo. Dynamic OCT functions via the same principals as previously mentioned; however, the infrared light is applied in rapid succession, enabling the detection of slight differences in images. Most of the tissue remains stable, but blood flow has occurred, which permits visualization of vessels and microvasculature.26
HIGH-FREQUENCY ULTRASOUND
HFUS is a fast, readily available technology that is noninvasive and can be used for diagnosis, surgical planning, and lesion monitoring.27 HFUS involves the creation of images using the reflection of ultrasound waves off of interfaces with different acoustic impedances. The transducer (or probe) is placed on skin, and reflected sound waves are interpreted by a computer that generates an image on a monitor.28,29 The transducer acts as both a transmitter and receiver. Transducers contain piezoelectric crystals that generate sound waves once stimulated by an electric voltage. Impedance differences at the skin interface create different reflections. To avoid interference, transducers contain matching impedance layers between the transducer’s active element and ultrasound gel, allowing sound waves to travel through the matching layer and ultrasound gel prior to entering the skin surface. The gradual change in impedance results in the efficient transmission of sound waves to the body.28 Waves propagate through tissue with different reflections caused by impedance differences. The reflection/echoes produced by different skin structures are received by the transducer and converted into electrical energy that is processed by the computer and displayed on a monitor in gray scale.28,29
Image brightness is determined by the amplitude of the echo reaching the transducer.28 High-intensity echoes (or large amplitudes) create hyperechoic images (white), whereas low-intensity echoes (or small amplitudes) produce hypoechoic images (gray) (Fig 2). Anechoic images are black images. Keratin is the main determinant of hyperechogenicity of the epidermis. Collagen determines hyperechogenecity of the dermis. In the subcutis, fascia and connective tissue are hyperechoic, whereas fat globules are hypoechoic.28
Fig 2.
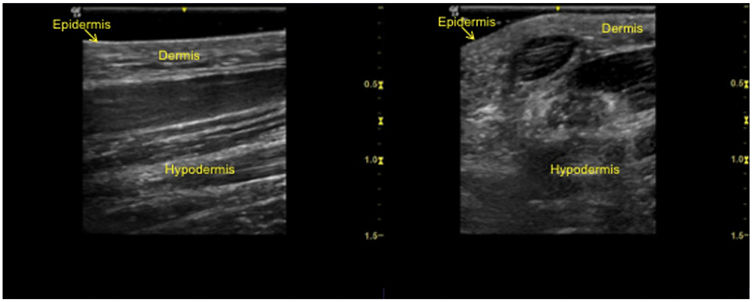
High-frequency ultrasound clinical images. Images were acquired with a GE LOGIQ e Ultrasound unit (GE Healthcare, Chicago, IL) with a 10-22 MHz transducer and frequency setting at 20 MHz. Two-dimensional image of nonglabrous skin longitudinal view (A) and transverse view (B).
Color Doppler with HFUS enables the visualization of blood flow. When sound waves from the transducer interact with flowing structures (ie, vasculature), they are reflected differently. Comparison of these waves highlights changes within tissue due to blood flow. On the computer monitor, color is attributed to the perceived movement for easier interpretation.28
HFUS provides images of superficial cutaneous structures. In ultrasonography, the frequency is inversely proportional to depth of penetration and directly proportional to image resolution.29 As such, HFUS has a shorter wavelength, providing a better resolution but less penetration. Frequencies >7 MHz enable improved visualization of skin, appendages, and subcutaneous tissues, and frequencies >15 MHz differentiate skin layers. In dermatology, the most commonly used frequencies are 20-25 MHz28 but can be as high as 100 MHz.29 With frequencies ~20 MHz, resolution reaches 50-200 μm with a depth of penetration of 6-7 mm. If frequency is increased to 50 MHz, resolution increases to 39-120 μm but depth of penetration is only 4 mm.29 HFUS has a lower resolution than OCT but higher scan depth.24
MULTISPECTRAL OPTOACOUSTIC TOMOGRAPHY
Multispectral optoacoustic tomography (MSOT) is under investigation in dermatology. Image generation with MSOT relies on the identification of endogenous (hemoglobin and melanin) or exogenous chromophores (nanoparticles and fluorescent dyes). Pulsed infrared light (680-980 nm) is applied to skin, causing thermoelastic expansion and creating ultrasound waves. The detector identifies the ultrasound waves emitted by different chromophores. MSOT can be used in vivo, in real-time, and with or without biomarker probes. MSOT provides deeper image depths of up to 1 cm, as well as 3D images. MSOT is continuing to be optimized for clinical use and is not readily available.30,31
RAMAN SPECTROSCOPY
Raman spectroscopy was first described by C.V. Raman in 192832; this technique has only recently been examined for medical use. Raman spectroscopy detects molecular vibrations unique to individual molecules.32-34 Raman scattering refers to the concept that as a light photon hits the skin, part is absorbed and part is scattered. The scattered photon can have the same energy as the incident photon (considered elastic [Rayleigh scattering]) or a slightly different energy (stokes and antistokes) from the incident photon (called inelastic). The energy change of initial and final vibrational levels is used to calculate Raman shift, which identifies molecular compositions.
In Raman spectroscopy, photons are generated by near-infrared (785-nm or 830-nm) lasers, which decreases autofluorescence and permits a more specific profile.35 Chemical bonds have specific vibrational energies making energy changes highly specific to the impacted molecule.32,33 Changes in a photon’s inelastic energy are miniscule, resulting in a small wavelength change. This change is detected by highly sensitive spectrometers (Fig 3).32,33
Fig 3.
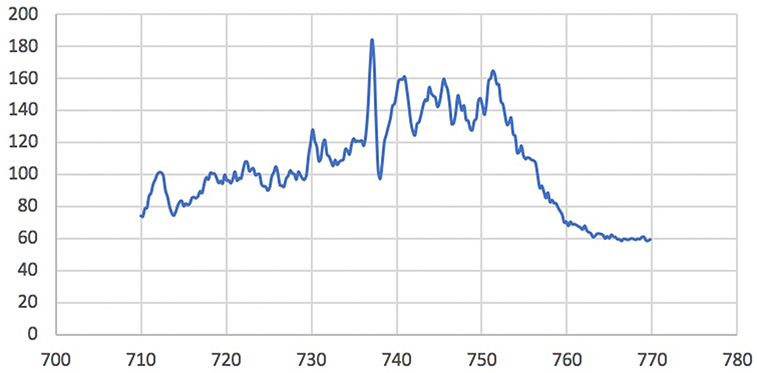
Raman spectroscopy in normal skin. Raman spectroscopy is used to compare the miniscule differences in emitted photon energies to generate spectra unique to particular molecules in the skin. This image is an example of a spectrum of normal skin.
Raman spectroscopy has great potential as an adjuvant technology in dermatology as the most specific imaging technique.36 It is approved by the European Union, Canada, and Australia but is still under review by the US Food and Drug Administration.32
FLUORESCENCE IMAGING
Fluorescence imaging devices create images by using the fluorescent properties of endogenous and exogenous molecules (fluorophores). Fluorophores absorb energy from an external light source, commonly visible or ultraviolet light. Two-photon (or multiphoton) fluorescence involves the use of a near-infrared laser. When photons reach tissue, the fluorophore becomes excited with corresponding photon energy (excitation energy), and when it returns to the ground state, a photon is emitted. Due to energy dissipation during this transition, energy of the emitted photon is lower than the excitation photon. With 2-photon fluorescence, the emitted photon has higher energy than each of the 2 excitation photons. The emitted photons are detected by photomultiplier tubes with a single-photon detection sensitivity.
Within each tissue, there are different fluorescent molecules, and each has a specific excitation energy. Endogenous fluorophores in the skin include pyridine nucleotides, flavins, aromatic amino acids, fluorescent proteins, and porphyrins.37 Exogenous agents, such as the photosensitizer aminolevulinic acid, which excites protoporphyrin IX, can be applied to the skin. Malignant cells uptake this sensitizer at a higher rate and, thus, have increased fluorescence relative to normal surrounding skin. Red fluorescence emitted by activated protoporphyrin IX is visualized by using a Wood’s lamp.38
Quenched activity–based probe imaging is a subtype of fluorescent imaging involving the targeting of skin proteins with fluorescently labeled molecular probes. This technique is not currently available for commercial use; however, it has been studied for efficacy. In malignant lesions, the probe targets overexpressed cancer-associated cathepsin protease. A quenched activity–based probe binds the target, unquenching the molecule, thereby permitting fluorescence. The fluorescence signal is read by using a near-infrared imaging device.39-41
Multiphoton tomography (MPT) is another technique that involves the comparison of excitation differences between 2 photons: endogenous fluorophores versus second harmonic generated fluorophores (primarily from dermal collagen).39 Endogenous fluorophores include nicotinamide adenine dinucleotide, reduced nicotinamide adenine dinucleotide phosphate, flavoproteins, keratin, lipofuscin, elastin, melanin, and metal-free porphyrins. Photons generated by backscatter off the second harmonic are shorter than endogenous fluorophores, providing contrast in the created images.22 A near-infrared laser is applied to the skin to create photons and backscatter is registered. The near-infrared laser can be used for imaging deeper tissue with less scattering of incident light.22 Epidermal structures are excited at 720-780 nm, and second harmonic generation from excited collagen occurs at 790-850 nm.
MPT is often combined with OCT. The MPT-OCT combination device is known commercially as DermaInspect (JenLab, Berlin, Germany). It images wide mosaics measuring 1 × 1 mm2 in vivo. MPT provides subcellular details with resolution of 350 × 350 × 200 um3. OCT is used for larger tissue volumes (7 × 3.5 × 1.5 mm3).22
CONCLUSIONS
Dermatologists now have the opportunity to better understand underlying skin structure and pathology noninvasively. As hardware and engineering technologies improve, imaging modalities will become a mainstay of our diagnostic armamentarium.
Acknowledgments
The authors would like to thank Dr Raheel Zubair and Dr Babar K Rao for sharing confocal images for this publication and Dr Jeremy Etzkorn for providing an image of Raman spectroscopy of normal skin.
Funding sources: None.
Abbreviations used:
- 3D
3 dimensional
- HFUS
high-frequency ultrasound
- MPT
multiphoton tomography
- MSOT
multispectral optoacoustic tomography
- OCT
optical coherence tomography
- TBDP
total-body digital photography
Footnotes
Conflicts of interest: Dr Schneider has no relevant conflicts to disclose. Dr Kohli has served as a subinvestigator for Estee Lauder, Unigen, Ferndale laboratories, Allergan, Chromaderm, Pfizer, Johnson & Johnson, and Bayer. Dr Hamzavi has served as research investigator for Estee Lauder, Unigen, Ferndale laboratories, Allergan, Bayer, Johnson & Johnson, and Incyte Corporation. Dr Council has served as consultant for MD Outlook and Medline Industries. Dr Rossi has served as consultant for Canfield Scientific Inc. Dr Ozog has served as investigator for MiRagen and Biofrontera, on the advisory board for Allergan, and was on the past medical board for DermOne.
REFERENCES
- 1.Schneider SL, Kohli I, Hamzavi IH, et al. Emerging imaging technologies in dermatology: part 2: applications and limitations. J Am Acad Derm. 2019;80(4). [DOI] [PMC free article] [PubMed] [Google Scholar]
- 2.Esteva A, Kuprel B, Novoa RA, et al. Dermatologist-level classification of skin cancer with deep neural networks. Nature. 2017;542(7639):115–118. [DOI] [PMC free article] [PubMed] [Google Scholar]
- 3.Bhattacharya A, Young A, Wong A, Stalling S, Wei M, Hadley D. Precision diagnosis of melanoma and other skin lesions from digital images. AMIA Jt Summits Transl Sci Proc. 2017;2017:220–226. [PMC free article] [PubMed] [Google Scholar]
- 4.Bae EJ, Seo SH, Kye YC, Ahn HH. A quantitative assessment of the human skin surface using polarized light digital photography and its dermatologic significance. Skin Res Technol. 2010;16(3):270–274. [DOI] [PubMed] [Google Scholar]
- 5.Kwon IH, Choi JE, Seo SH, Kye YC, Ahn HH. Rosacea subtypes visually and optically distinct when viewed with parallel-polarized imaging technique. Ann Dermatol. 2017;29(2):167–172. [DOI] [PMC free article] [PubMed] [Google Scholar]
- 6.Rosenberg A, Meyerle JH. Total-body photography in skin cancer screening: the clinical utility of standardized imaging. Cutis. 2017;99(5):312–316. [PubMed] [Google Scholar]
- 7.Berk-Krauss J, Polsky D, Stein JA. Mole mapping for management of pigmented skin lesions. Dermatol Clin. 2017;35(4):439–445. [DOI] [PubMed] [Google Scholar]
- 8.FotoFinder Systems, Inc. http://www.fotofinder-systems.com/company/about-us/. Accessed December 17, 2017.
- 9.de Menezes M, Rosati R, Ferrario VF, Sforza C. Accuracy and reproducibility of a 3-dimensional stereophotogrammetric imaging system. J Oral Maxillofac Surg. 2010;68(9):2129–2135. [DOI] [PubMed] [Google Scholar]
- 10.Heike CL, Upson K, Stuhaug E, Weinberg SM. 3D digital stereophotogrammetry: a practical guide to facial image acquisition. Head Face Med. 2010;6:18. [DOI] [PMC free article] [PubMed] [Google Scholar]
- 11.Canfield. Vectra 3D. https://www.canfieldsci.com/imaging-systems/vectra-wb360-imaging-system/. Accessed March 31, 2018.
- 12.Marek AJ, Chu EY, Ming ME, Khan ZA, Kovarik CL. Impact of a Smartphone application on skin self-examination rates in patients that are new to total body photography: a randomized controlled trial. J Am Acad Dermatol. 2018;79(3):564–567. [DOI] [PMC free article] [PubMed] [Google Scholar]
- 13.Marek AJ, Chu EY, Ming ME, Kovarik CL. Assessment of Smartphone applications for total body digital photographyguided skin exams by patients. J Am Acad Dermatol. 2016; 75(5):1063–1064.e1061. [DOI] [PMC free article] [PubMed] [Google Scholar]
- 14.Que SK. Research techniques made simple: noninvasive imaging technologies for the delineation of basal cell carcinomas. J Invest Dermatol. 2016;136(4):e33–e38. [DOI] [PubMed] [Google Scholar]
- 15.Hibler BP, Qi Q, Rossi AM. Current state of imaging in dermatology. Semin Cutan Med Surg. 2016;35(1):2–8. [DOI] [PubMed] [Google Scholar]
- 16.Que SK, Fraga-Braghiroli N, Grant-Kels JM, Rabinovitz HS, Oliviero M, Scope A. Through the looking glass: basics and principles of reflectance confocal microscopy. J Am Acad Dermatol. 2015;73(2):276–284. [DOI] [PubMed] [Google Scholar]
- 17.Gadjiko M, Rossi AM. Ex vivo confocal microscopy: a diagnostic tool for skin malignancies. Cutis. 2017;100(2):81–83. [PubMed] [Google Scholar]
- 18.Hibler BP, Yelamos O, Cordova M, et al. Handheld reflectance confocal microscopy to aid in the management of complex facial lentigo maligna. Cutis. 2017;99(5):346–352. [PMC free article] [PubMed] [Google Scholar]
- 19.Larson B, Abeytunge S, Seltzer E, Rajadhyaksha M, Nehal K. Detection of skin cancer margins in Mohs excisions with high-speed strip mosaicing confocal microscopy: a feasibility study. Br J Dermatol. 2013;169(4):922–926. [DOI] [PMC free article] [PubMed] [Google Scholar]
- 20.Al-Arashi MY, Salomatina E, Yaroslavsky AN. Multimodal confocal microscopy for diagnosing nonmelanoma skin cancers. Lasers Surg Med. 2007;39(9):696–705. [DOI] [PubMed] [Google Scholar]
- 21.Gambichler T, Jaedicke V, Terras S. Optical coherence tomography in dermatology: technical and clinical aspects. Arch Dermatol Res. 2011;303(7):457–473. [DOI] [PubMed] [Google Scholar]
- 22.Alex A, Weingast J, Weinigel M, et al. Three-dimensional multiphoton/optical coherence tomography for diagnostic applications in dermatology. J Biophotonics. 2013;6(4):352–362. [DOI] [PubMed] [Google Scholar]
- 23.Fujimoto JG, Pitris C, Boppart SA, Brezinski ME. Optical coherence tomography: an emerging technology for biomedical imaging and optical biopsy. Neoplasia. 2000;2(1-2):9–25. [DOI] [PMC free article] [PubMed] [Google Scholar]
- 24.Alawi SA, Kuck M, Wahrlich C, et al. Optical coherence tomography for presurgical margin assessment of nonmelanoma skin cancer - a practical approach. Exp Dermatol. 2013;22(8):547–551. [DOI] [PubMed] [Google Scholar]
- 25.Chan CS, Rohrer TE. Optical coherence tomography and its role in mohs micrographic surgery: a case report. Case Rep Dermatol. 2012;4(3):269–274. [DOI] [PMC free article] [PubMed] [Google Scholar]
- 26.Ulrich M, Themstrup L, de Carvalho N, et al. Dynamic optical coherence tomography in dermatology. Dermatology. 2016; 232(3):298–311. [DOI] [PubMed] [Google Scholar]
- 27.Sciolla B, Cowell L, Dambry T, Guibert B, Delachartre P. Segmentation of skin tumors in high-frequency 3-D ultrasound images. Ultrasound Med Biol. 2017;43(1):227–238. [DOI] [PubMed] [Google Scholar]
- 28.Barcaui Ede O, Carvalho AC, Lopes FP, Pineiro-Maceira J, Barcaui CB. High frequency ultrasound with color Doppler in dermatology. An Bras Dermatol. 2016;91(3):262–273. [DOI] [PMC free article] [PubMed] [Google Scholar]
- 29.Bhatt KD, Tambe SA, Jerajani HR, Dhurat RS. Utility of high-frequency ultrasonography in the diagnosis of benign and malignant skin tumors. Indian J Dermatol Venereol Leprol. 2017;83(2):162–182. [DOI] [PubMed] [Google Scholar]
- 30.Chuah SY, Attia AB, Long V, et al. Structural and functional 3D mapping of skin tumours with non-invasive multispectral optoacoustic tomography. Skin Res Technol. 2017;23(2):221–226. [DOI] [PubMed] [Google Scholar]
- 31.Diot G, Metz S, Noske A, et al. Multispectral optoacoustic tomography (MSOT) of human breast cancer. Clin Cancer Res. 2017;23(22):6912–6922. [DOI] [PubMed] [Google Scholar]
- 32.Zhao J, Zeng H, Kalia S, Lui H. Using Raman spectroscopy to detect and diagnose skin cancer in vivo. Dermatol Clin. 2017; 35(4):495–504. [DOI] [PubMed] [Google Scholar]
- 33.Cinotti E, Labeille B, Perrot JL, Boukenter A, Ouerdane Y, Cambazard F. Characterization of cutaneous foreign bodies by Raman spectroscopy. Skin Res Technol. 2013;19(4):508–509. [DOI] [PubMed] [Google Scholar]
- 34.Lui H, Zhao J, McLean D, Zeng H. Real-time Raman spectroscopy for in vivo skin cancer diagnosis. Cancer Res. 2012;72(10): 2491–2500. [DOI] [PubMed] [Google Scholar]
- 35.Bodanese B, Silveira FL, Zangaro RA, Pacheco MT, Pasqualucci CA, Silveira L Jr. Discrimination of basal cell carcinoma and melanoma from normal skin biopsies in vitro through Raman spectroscopy and principal component analysis. Photomed Laser Surg. 2012;30(7):381–387. [DOI] [PMC free article] [PubMed] [Google Scholar]
- 36.Schleusener J, Gluszczynska P, Reble C, et al. In vivo study for the discrimination of cancerous and normal skin using fibre probe-based Raman spectroscopy. Exp Dermatol. 2015;24(10): 767–772. [DOI] [PubMed] [Google Scholar]
- 37.Franco W, Gutierrez-Herrera E, Kollias N, Doukas A. Review of applications of fluorescence excitation spectroscopy to dermatology. Br J Dermatol. 2016;174(3):499–504. [DOI] [PubMed] [Google Scholar]
- 38.Jeon SY, Kim KH, Song KH. Efficacy of photodynamic diagnosisguided Mohs micrographic surgery in primary squamous cell carcinoma. Dermatol Surg. 2013;39(12):1774–1783. [DOI] [PubMed] [Google Scholar]
- 39.Hamblin M, Avci P, Gupta G, eds. Imaging in Dermatology. 1st ed. Elsevier; 2016. [Google Scholar]
- 40.Blum G, Mullins SR, Keren K, et al. Dynamic imaging of protease activity with fluorescently quenched activity-based probes. Nat Chem Biol. 2005;1(4):203–209. [DOI] [PubMed] [Google Scholar]
- 41.Verdoes M, Edgington LE, Scheeren FA, et al. A nonpeptidic cathepsin S activity-based probe for noninvasive optical imaging of tumor-associated macrophages. Chem Biol. 2012; 19(5):619–628. [DOI] [PMC free article] [PubMed] [Google Scholar]