Abstract
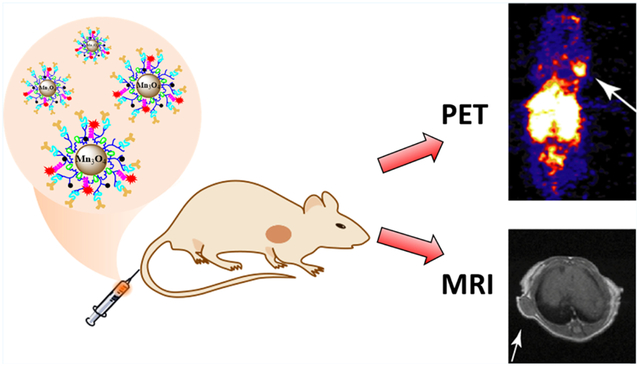
A Mn3O4 nanoparticle (NP)-based dual-modality probe has been developed for tumor positron emission tomography (PET)/magnetic resonance (MR) imaging. The dual-modality imaging probe was constructed by modifying multifunctional polyethyleneimine (PEI)-coated Mn3O4 NPs with folic acid (FA), followed with the radiolabeling with 64Cu. The formed imaging probe was utilized for PET/MR imaging of human cervical cancer mouse xenografts, which overexpress folate receptor (FR). The PEI-coated Mn3O4 NPs were synthesized using a solvothermal approach via decomposition of acetylacetone manganese. Multifunctional groups, including fluorescein isothiocyanate (FI), PEGylated FA, and NOTA chelator, were then sequentially loaded onto the surface of the amine groups of the Mn3O4 NPs. The remaining PEI amines were neutralized by the acetylation reaction. The resulting NOTA–FA–FI–PEG–PEI–Ac–Mn3O4 NPs were fully characterized and evaluated in vitro and successfully radiolabeled with 64Cu for tumor PET/MR imaging in small animals. In vivo blocking experiments were performed to determine the FR binding specificity of NPs. PET imaging results demonstrated that 64Cu-labeled Mn3O4 NPs display good tracer uptake in the FR-expressing HeLa tumors (tumor-to-muscle (T/M) ratio: 5.35 ± 0.31 at 18 h postinjection (pi)) and substantially reduced tracer uptake in the FR-blocked HeLa tumors (T/M ratio: 2.78 ± 0.68 at 18 h pi). The ex vivo data, including PET imaging and biodistribution, further confirmed the tumor binding specificity of the 64Cu-labeled Mn3O4 NPs. Moreover, the FR-targeted Mn3O4 NPs exhibited efficient T1-weighted MR imaging (MRI), leading to the precise tumor MRI at 18 h pi. PET/MR imaging with the 64Cu–NOTA–FA–FI–PEG–PEI–Ac– Mn3O4 NPs may offer a new quantitative approach to precisely measure the FR in tumors. The strategy of incorporating PEI nanotechnology into the construction of new biomaterials may be applied for the construction of novel nanoplatforms for cancer diagnosis and therapy.
Keywords: polyethyleneimine, manganese oxide nanoparticles, 64Cu, PET, MR imaging
Graphical Abstract
1. INTRODUCTION
With the development of medical technologies over recent decades, a variety of imaging approaches have been explored in cancer research.1–3 In particular, the emerging imaging techniques, including but not limited to fluorescence imaging, ultrasonic imaging, computed tomography (CT), positron emission tomography (PET), and magnetic resonance imaging (MRI), can offer valuable information to better characterize cancer biology.4–8 Although single imaging modality has its own distinctive advantages, there are some intrinsic limitations for each imaging modality as well. A good way to compensate this problem is to develop a hybrid system, which can combine the advantages of single imaging modality. For example, hybrid PET/MR scanners are available now in the clinical setting. PET/MR imaging can offer the quantitative physiologic information by PET with the unique features of MR, such as high spatial resolution, good soft tissue contrast, and diffusion-weighted imaging.4,9–12 With the advancements in imaging techniques, the development of new probes for dual-modality imaging, such as PET/MRI, has become a large demand.
Various nanomaterials are being developed for imaging applications.13–21 Nanoparticles (NPs) possessing a large ratio between surface area and volume can be coupled with various moieties, such as target-specific ligands for reaching the disease sites and bifunctional chelators for radiolabeling. For PET imaging, various radioisotopes, such as copper-64 (64Cu), gallium-68 (68Ga), indium-111 (111In), and zirconium-89 (89Zr), are being used to radiolabel NPs.22,23 Some radiolabeled NPs present extended circulation time, good targeting specificity, and biocompatibility.23–25 In addition, various MRI elements have been loaded within the nanocarriers, such as paramagnetic Gd(III), MnO, MnO2, Mn3O4, and MnFe2O4 NP-based T1 MRI agents, and superparamagnetic iron oxide NP-based T2 MRI probes, which improve the NP stability and relaxometry.26–32 Among a variety of polymer-mediated nanomaterials that can be used as cancer theranostics, polyethyleneimine (PEI) has attracted great attention due to the particular characteristics of structure, branched internal cavity, and abundant terminal amines.33,34 Based on versatile PEI nanotechnology, targeting ligands,33,35 therapeutic agents,36,37 and imaging agents33,38 can be loaded into the PEI carriers.33,36 For example, PEI-coated Mn3O4 NPs can be built via solvothermal route for T1 MRI,38 and the surface functional groups of PEI can be also radiolabeled for PET imaging.39 Previously, we successfully utilized PEI as a platform to construct Fe3O4@Au nanocomposites by employing a hydro-thermal method for tumor MR/CT imaging.40 Overall, the PEI nanotechnology is expected to provide a great potential on the construction of multifunctional biomaterials for dual modal PET/MR imaging.
In our study, PEI was used to coat Mn3O4 NPs through the decomposition of acetylacetone manganese (Mn(acac)2) by a solvothermal approach. The PEI-coated Mn3O4 NPs were then successively loaded with fluorescein isothiocyanate (FI), 2,2′-(7-(2-((2,5-dioxopyrrolidin-1-yl)oxy)-2-oxoethyl)-1,4,7-triazonane-1,4-diyl) diacetic acid (NOTA-NHS), and PEGylated folic acid (FA). At last, the acetylation reaction was utilized to neutralize the remaining amines on the surface of multifunctional PEI, followed with 64Cu labeling to form 64Cu–NOTA–FA–FI–PEG–PEI–Ac–Mn3O4 NPs for folate receptor (FR)-targeted tumor PET/MR imaging. The multifunctional NOTA–FA–FI–PEG–PEI–Ac–Mn3O4 NPs were fully characterized. The targeting specificity of the formed FR-targeted NPs was determined by flow cytometry and confocal microscopy. The T1 relaxometry of the NOTA–FA–FI–PEG–PEI–Ac–Mn3O4 NPs and the targeted MRI of the NOTA–FA–FI–PEG–PEI–Ac–Mn3O4 NPs in cancer cells were also evaluated. After 64Cu labeling, the 64Cu–NOTA– FA–FI–PEG–PEI–Ac–Mn3O4 NPs were subjected to in vitro stability, in vivo PET/MR imaging, and ex vivo biodistribution studies. To the best of our knowledge, very few studies have been reported in terms of using the FR-targeted NPs for PET/MR tumor imaging. As a result, we believe that PET/MR with our new probe (64Cu–NOTA–FA–FI–PEG–PEI–Ac–Mn3O4 NPs) may offer a new quantitative approach to precisely measure the FR in tumors.
2. EXPERIMENTAL SECTION
2.1. Materials.
Branched PEI (Mw = 25 000), Mn(acac)2, and diethylene glycol (DEG) were obtained from Sigma-Aldrich (St. Louis, MO). NOTA-NHS was purchased from CheMatech (Dijon, France). [64Cu]CuCl2 was obtained from the Washington University in St. Louis (MO). PEG with terminal groups of amine and carboxyl (NH2-PEGCOOH, Mw = 2000) and PEG with terminal groups of monomethyl ether and carboxyl (mPEG-COOH, Mw = 2000) were purchased from Shanghai Yanyi Biotechnology Corporation (Shanghai, China) and used directly. FA, FI, and other chemicals were purchased from MilliporeSigma (St. Louis, MO). PD-10 columns were obtained from GE Healthcare Life Sciences (Pittsburgh, PA). A Milli-Q Plus 185 water purification system (Millipore, Bedford, MA) having a resistivity >18 MΩ cm was used to purify water. Regenerated cellulose membrane filters (molecular weight cutoff (MWCO) = 1000 and 14 000) were purchased from Thermo Fisher Scientific (Pittsburgh, PA).
2.2. Synthesis of NOTA–FA–FI–PEG–PEI–Ac–Mn3O4 NPs.
The PEI–NH2–Mn3O4 NPs were prepared using a solvothermal method. In brief, Mn(acac)2 (253.0 mg) was dissolved in 10 mL of DEG and reacted with PEI (100 mg) by magnetic stirring. After 1 h of continuous stirring of the mixture in air, autoclaving of the mixture was performed for 24 h in a sealed vessel (50 mL) under a 2 bar gauge pressure at 180 °C. The mixture was then cooled down to 25 °C. The precipitate was acquired through centrifugation at 8000 rpm for 5 min, followed by dialysis to purify the PEI–NH2–Mn3O4 NPs. A 14 000 MWCO membrane was utilized to purify the reaction mixture by extensively dialyzing against water (nine times, 8 L) for 3 days to completely eliminate the excess of reactants and the side products. The PEI–NH2–Mn3O4 NPs were then obtained through lyophilization.
The PEI–NH2–Mn3O4 NPs (50.53 mg, 0.00151 mmol) in dimethyl sulfoxide (DMSO) solution (5.0 mL) were then reacted with 7 molar equiv of FI (3.0 mL, 4.12 mg, 0.01058 mmol) dissolved in DMSO and allowed to stand for 24 h at 25 °C under magnetic stirring. NOTA-NHS (11.99 mg, 0.01816 mmol, in 3.0 mL of DMSO) with the PEI–NH2–Mn3O4 NPs (12 molar equiv) was then added dropwise into the raw product of the FI–PEI–NH2–Mn3O4 NPs and stirred continuously for 24 h to form the NOTA–FI–PEI–NH2–Mn3O4 NPs. The PEGylated FA was then coupled with the amine groups of the NOTA–FI–PEI–NH2–Mn3O4 NPs subsequently by 1-ethyl-3-(3-dimethylaminopropyl) carbodiimide (EDC) activation. FA–PEG–COOH was prepared by a previously reported protocol.41 Briefly, FA–PEG-COOH (74.96 mg) in DMSO solution (5.0 mL) with the PEI–NH2–Mn3O4 NPs (22 molar equiv) was activated by EDC (114.0 mg in 5.0 mL of DMSO) for 3 h and then stirred with the NOTA–FI– PEI–NH2–Mn3O4 NPs for additional 3 days. The acquired NOTA–FA–FI–PEG–PEI–NH2–Mn3O4 NPs were subsequently acetylated and purified by dialysis41 to afford the NOTA–FA–FI–PEG–PEI–Ac–Mn3O4 NPs. As a comparison, the non-FA targeting NOTA–FI–PEG–PEI–Ac–Mn3O4 NPs as a control were prepared using a similar method described above.
2.3. Preparation of 64Cu–NOTA–FA–FI–PEG–PEI–Ac– Mn3O4 NPs.
The 64Cu labeling of the NOTA–FA–FI–PEG–PEI– Ac–Mn3O4 NPs was performed according to the previously published protocol42 with some modifications. In brief, at room temperature, [64Cu]CuCl2 (37–111 MBq) was incubated with 300 μL of ammonium acetate buffer (0.4 M, pH = 5.5) for 15 min. The resulting [64Cu]Cu(OAc)2 was then mixed with the solution of the NOTA–FA–FI–PEG–PEI–Ac–Mn3O4 NPs, which were dispersed in ammonium acetate buffer at 45 °C. After 30 min incubation, the 64Cu–NOTA–FA–FI–PEG–PEI–Ac–Mn3O4 NPs were purified by a PD-10 desalting column. The radioactive eluents containing the 64Cu–NOTA–FA–FI–PEG–PEI–Ac–Mn3O4 NPs were passed through a syringe filter (0.22 μm). The product was collected into a sterile vial. The radiochemical purity of the 64Cu–NOTA–FA–FI–PEG–PEI–Ac–Mn3O4 NPs was determined on MKC18 silica gel 60 Å plates (GE Healthcare, Piscataway, NJ) by a Bioscan AR2000 radio-thin-layer chromatogram (radio-TLC) scanner. A development solvent of NH4OAc–ethylenediaminetetraacetic acid (EDTA) solution (2% EDTA and 10% NH4OAc)/CH3OH = 1:1 was used for radio-TLC.
2.4. Characterization Techniques.
1H NMR spectrum was obtained by a Bruker AV-400 NMR spectrometer using D2O as a solvent. Fourier transform infrared (FTIR) spectrometry was recorded by a ThermoNicolet Nexus 670 FTIR spectrometer. All spectra were collected by a transmission mode with 650–4000 cm−1 wavenumber range. UV–vis spectra of samples in water were recorded by a Lambda 25 UV–vis spectrophotometer (PerkinElmer, Waltham, MA). X-ray diffraction (XRD) was carried out to evaluate the crystal structure of the PEI–NH2–Mn3O4 NPs according to a previously published procedure.35 The scan range (2θ) was set as 20–70°. A TG 209 F1 thermogravimetric analyzer (NETZSCH Instruments Co., Ltd., Germany) was used for thermogravimetric analysis (TGA) by heating the samples from 25 to 750 °C. The increase rate of temperature was set at 10 °C/min in nitrogen atmosphere. Transmission electron microscopy (TEM) was recorded at 200 kV through a JEOL 2010 F analytical electron microscope (Tokyo, Japan). Before measurement, aqueous solution (5 μL) of sample (1 mg/mL) was dropped onto a carbon-coated copper grid and followed with air-drying. The size of the prepared NPs was measured by ImageJ software (https://imagej.nih.gov/ij/download.html). For each sample, the corresponding TEM image was recorded and analyzed from 300 randomly selected NPs.
2.5. In Vitro Stability Test.
The stability of the 64Cu–NOTA–FA–FI–PEG–PEI–Ac–Mn3O4 NPs was tested in mouse serum according to a previously published procedure.43 Briefly, the 64Cu–NOTA–FA–FI–PEG–PEI–Ac–Mn3O4 NPs (3.7 MBq) were incubated with mouse serum (0.5 mL) at 37 °C. After incubation for 1, 2, 5, and 24 h, trifluoroacetic acid was added to the above mixture. The soluble portion was filtrated through a filter (0.22 μm). An aliquot of the solution was collected, and the corresponding radiochemical purity was measured by radio-TLC.
2.6. Cell Culture.
Human cervical carcinoma HeLa cell line was obtained from the ATCC (American Type Culture Collection, Manassas, VA). HeLa cells were cultured at 37 °C in a humidified atmosphere containing 5% CO2 in Dulbecco’s modified Eagle’s medium (DMEM) containing 10% fetal bovine serum (Thermo Fisher Scientific, Grand Island, NY), penicillin (100 U/mL), and streptomycin (100 U/mL).
2.7. In Vitro Biocompatibility.
3-(4,5-Dimethylthiazol-2-yl)-2,5-diphenyltetrazolium bromide (MTT) assay was utilized to test the cell viability after treating HeLa cells with the NOTA–FA–FI–PEG– PEI–Ac–Mn3O4 NPs and the NOTA–FI–PEG–PEI–Ac–Mn3O4 NPs. The assay was carried out according to the reported protocol.26 After the incubation of the NOTA–FA–FI–PEG–PEI–Ac–Mn3O4 NPs or the NOTA–FI–PEG–PEI–Ac–Mn3O4 NPs at various Mn concentrations (0, 5, 10, 25, 50, and 100 μg/mL) with HeLa cells for 24 h, the images of the cell morphology were obtained using a Leica DMIL LED inverted phase contrast microscope (200× magnification).
2.8. Flow Cytometry Analysis.
Flow cytometry was used to acquire fluorescence signal of cells after treatment with different nanoparticle samples. HeLa cells were first seeded in 12-well plates with a density of 2 × 10⁵ cells/well for 24 h. The cells were then washed with DMEM and then cultured with the fresh DMEM containing the NOTA–FA–FI–PEG–PEI–Ac–Mn3O4 NPs or the NOTA–FI–PEG–PEI–Ac–Mn3O4 NPs at various Mn concentrations (0, 5, 10, 25, and 50 μg/mL, respectively). After 4 h incubation, the cells were trypsinized and resuspended in phosphate-buffered saline (PBS). A Becton Dickinson FACScan analyzer was used to analyze the collected cells.
2.9. Confocal Microscopy.
The targeting efficiency of the NOTA–FA–FI–PEG–PEI–Ac–Mn3O4 NPs to HeLa cells was further evaluated using confocal microscopy based on a previously published protocol.33,35 The parameters of confocal microscopy were set as follows: excitation at 488 nm; emission collected at 505–525 nm; and thickness of the optical section at 5 mm. All samples were analyzed using a 63× oil-immersion objective lens.
2.10. T1 MR Relaxometry.
An NMI20-Analyst NMR Analyzing and Imaging system (0.5 T, Shanghai NIUMAG Corporation, Shanghai, China) was utilized to measure the T1 MR relaxometry of the NOTA–FA–FI–PEG–PEI–Ac–Mn3O4 NPs. The samples were prepared in solution using various Mn concentrations (0.05–0.4 mM). The parameters were utilized according to the published protocol.35 All samples were scanned via the MRI system. As a function of Mn concentration, the T1 relaxivity (r1) of NPs was acquired through a linear fitting of the inverse relaxation time (1/T1).
2.11. MRI of NPs with HeLa Cells.
HeLa cells were cultured in six-well plates with a density of 3 × 10⁶ cells/well for 24 h. The cell medium was then replaced with fresh medium containing the NOTA–FA–FI–PEG–PEI–Ac–Mn3O4 NPs, or the NOTA–FA–FI–PEG–PEI–Ac–Mn3O4 NPs with FA blocking (coincubated with 5 μM FA), or the NOTA–FI–PEG–PEI–Ac–Mn3O4 NPs at various Mn concentrations (0, 5.5, 11.0, 22.0, and 44.0 μg/mL, respectively). After 4 h incubation, the cells were then washed with PBS, trypsinized, centrifuged, and resuspended in a 1.5 mL Eppendorf tube with 1 mL of PBS (containing 0.25% agarose) prior to MRI. T1 MRI of the cell suspension was measured by a Signa HDxt superconductor MR system (1.5 T, GE Medical Systems, Milwaukee, WI) using a wrist ECHO sequence. The following parameters were used: repetition time (TR) = 900 ms; echo time (TE) = 10.7 ms; point resolution = 256 mm × 256 mm; slice thickness = 5 mm; and field of view (FOV) = 100 mm × 100 mm.
2.12. PET/MR Imaging of HeLa Mouse Xenografts.
All animal procedures were performed in accordance with and approved by the Animal Ethics Committee of the University of Southern California (USC), Los Angeles, CA, and conformed to the guidelines of the USC Institutional Animal Care and Use Committee. Female athymic nude mice (4–6 weeks old; 20–25 g) were purchased from the Envigo, Inc. (Livermore, CA). The nude mice were subcutaneously injected with HeLa cells (5 × 10⁶ per mouse) in the right flank. The tumors gradually grew about 3–4 weeks until 0.5–1.0 cm3 in volume was achieved.
For MRI, a 200 μL saline solution of the NOTA–FA–FI–PEG–PEI–Ac–Mn3O4 NPs (Mn concentration = 2.5 mg/mL) was intravenously injected via the mouse tail vein (n = 4/group). As a comparison, the same dose of the nontargeted NOTA–FI–PEG–PEI–Ac–Mn3O4 NPs (Mn concentration = 2.5 mg/mL) was also intravenously injected into a group of mice (n = 4). An Aspect M7 scanner with an animal coil was used with an FSE sequence. The following parameters were used: slice thickness = 1 mm; TR = 600 ms; TE = 9.39 ms; FOV = 4 cm × 6 cm; and point resolution = 320 mm × 256 mm. Two-dimensional (2D) spin-echo T1-weighted MR images were obtained for each animal before and after 1, 2, 5, 18, and 24 h injection of NPs.
For PET imaging, the 64Cu–NOTA–FA–FI–PEG–PEI–Ac–Mn3O4 NPs (7.4 MBq) were injected into each animal (n = 4/group) intravenously via the mouse tail vein under isoflurane anesthesia condition. Five minute static scans were acquired at different time points (1, 2, 5, 18, and 24 h pi). A 2D ordered-subsets expectation maximum algorithm was used for image reconstruction. The PET imaging was performed on a small animal scanner (MicroPET R4 scanner; Siemens Medical Solutions USA, Inc., Knoxville, TN). The regions of interest (ROIs) were drawn over the major organs and tumor in the whole-body coronal images. The radioactivity concentrations within major organs and tumor were measured from the mean value within the multiple ROI and converted to percentage injected dose per gram of tissue (% ID/g). At 24 h pi of the 64Cu-labeled NPs, mice were euthanized and dissected for ex vivo PET imaging. Tumor, blood, major tissues, and organs were collected. A 10 min static PET imaging was obtained. For blocking study, HeLa tumor-bearing mice were scanned after the coinjection of the 64Cu–NOTA–FA–FI–PEG–PEI–Ac–Mn3O4 NPs (7.4 MBq) with 100 μg of free FA per animal. As a control group (n = 4/group), the nontargeted 64Cu–NOTA–FI–PEG–PEI–Ac–Mn3O4 NPs (7.4 MBq) were intravenously injected into each HeLa tumor-bearing animal.
2.13. Biodistribution.
The 64Cu-labeled NPs (7.4 MBq) were intravenously injected to the HeLa tumor-bearing mice (n = 4/group). At 24 h pi, animals were euthanized and dissected. Tumor, blood, major tissues, and organs were collected and wet weighed. The radioactivity from the tissues was determined by a PerkinElmer 2480 WIZARD2 automatic gamma counter (PerkinElmer Inc., Waltham, MA). A known aliquot of the radioactivity was used for the calibration of the radioactivity of the tissue samples. The mean uptake with a standard deviation was then calculated for a group of animals.
2.14. Statistical Analysis.
Quantitative data were presented as mean ± standard deviation. Mean values were compared via one-way analysis of variance and Student’s t-test. p values <0.05 were set as findings that are statistically significant, and the data were marked with (*) for p < 0.05, (**) for p < 0.01, and (***) for p < 0.001, respectively.
3. RESULTS AND DISCUSSION
3.1. Synthesis and Characterization of NPs.
In this study, PEI was utilized as a nanocarrier to coat the Mn3O4 NPs, followed by the sequential loading with FI, NOTA, and PEGylated FA on the surface of PEI. The remaining surface terminal amines were neutralized by the acetylation reaction, and the resulting NPs were radiolabeled with 64Cu (Figure 1).
Figure 1.
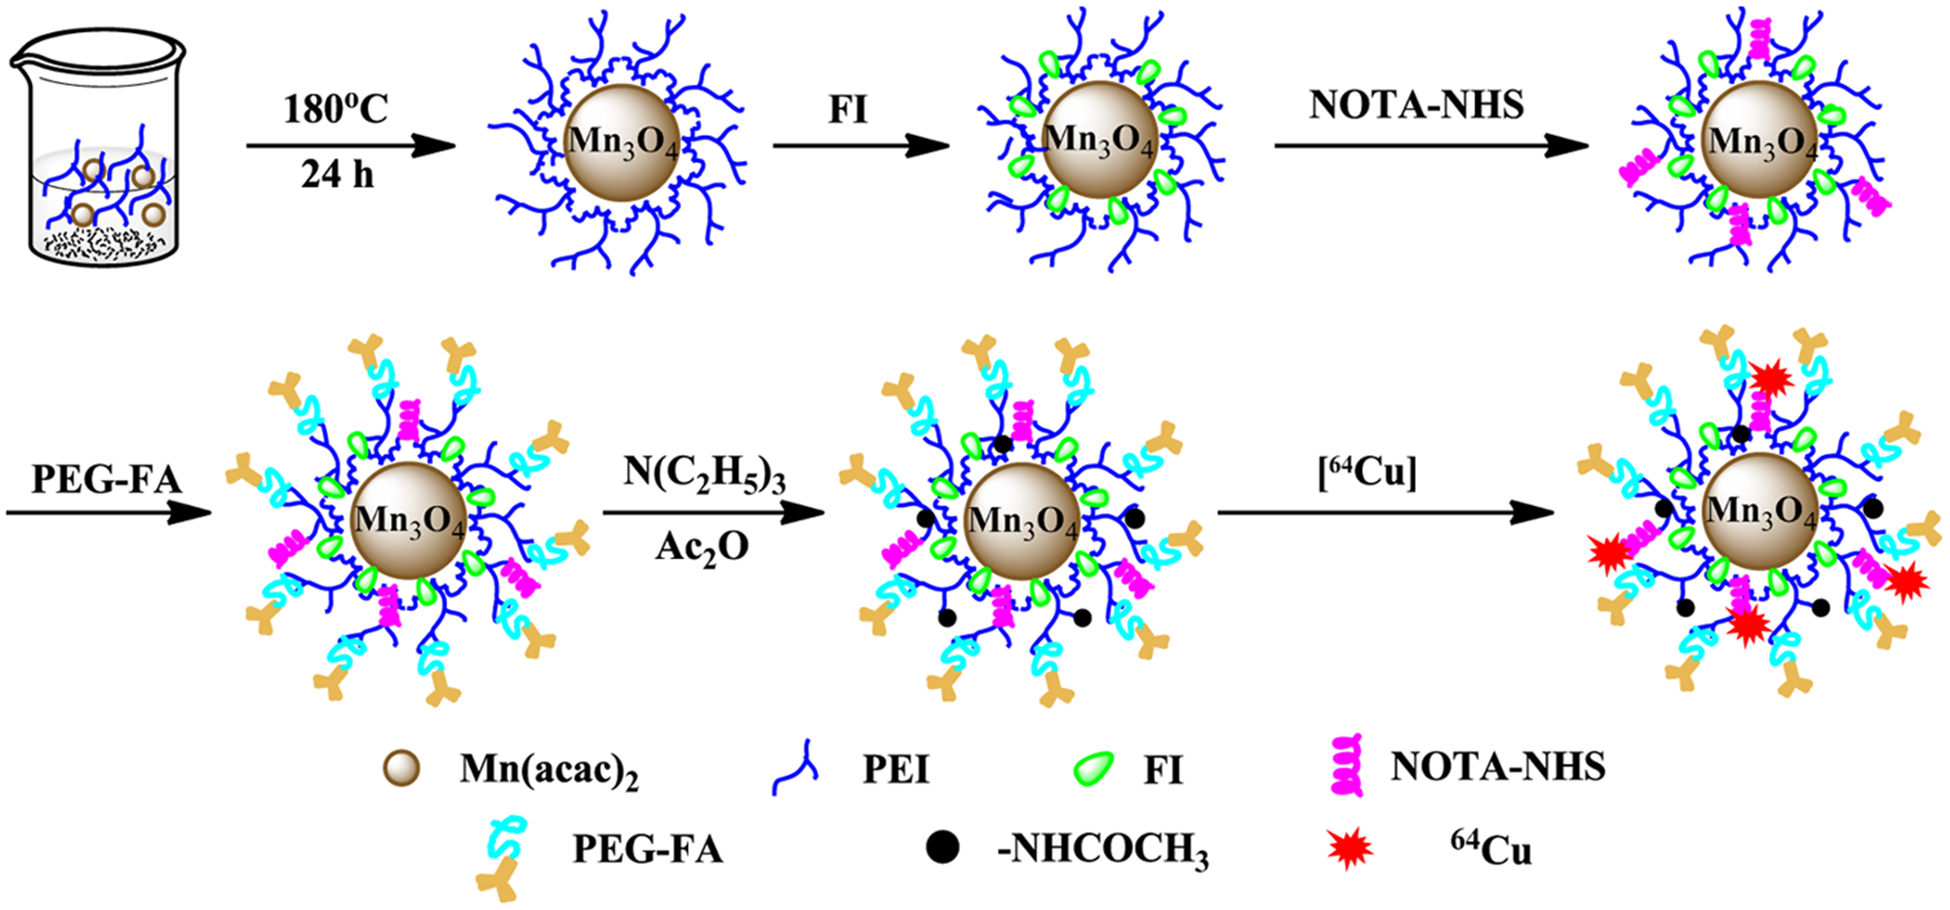
Schematic illustration of the synthesis of the multifunctional 64Cu–NOTA–FA–FI–PEG–PEI–Ac–Mn3O4 NPs.
The PEI-coated Mn3O4 NPs were prepared via the solvothermal approach by decomposition of Mn(acac)2. As shown in Figure S1 (Supporting Information), the crystal structure of the constructed PEI–NH2–Mn3O4 NPs was confirmed by XRD. The lattice spacing at 2θ of 29.2, 32.5, 36.4, 44.7, 50.9, 58.7, and 60.2° matched the [112], [103], [211], [220], [105], [321], and [440] planes of magnetic Mn3O4 crystals, respectively, which is in agreement with the previously reported data.44,45 Then, FTIR spectroscopy was utilized to determine the formation of the PEI–NH2–Mn3O4 NPs (Figure S2, Supporting Information). The peaks located at 1600 and 1445 cm−1 in the FTIR spectra are attributed to the C=O bond, and the peaks located at 2950 and 2850 cm−1 are associated with –CH2– bonds of PEI. In addition, the characteristic peak located at 636 cm−1 is attributed to the formation of Mn–O bond in the PEI–NH2–Mn3O4 NPs. The results confirmed that the PEI-coated Mn3O4 NPs were successfully synthesized.
The PEI-coated Mn3O4 NPs were sequentially conjugated with FI, NOTA, and PEGylated FA (characterized with 0.5 FA per PEG through 1H NMR, Figure S3, Supporting Information). UV–vis spectroscopy result demonstrated the successful conjugation of FI and PEGylated FA (Figure S4, Supporting Information). The FI characteristic peak located at about 505 nm can be found in the spectra of the FI–PEI–NH2–Mn3O4 NPs, the NOTA–FI–PEG–PEI–Ac–Mn3O4 NPs, and the NOTA–FA–FI–PEG–PEI–Ac–Mn3O4 NPs, confirming the successful modification of FI. In addition, the characteristic absorption at 280 nm of the NOTA–FA–FI–PEG–PEI–Ac–Mn3O4 NPs is attributed to the characteristic absorption of FA, suggesting the conjugation of FA–PEG-COOH was accomplished.
The morphology and size of the NOTA–FA–FI–PEG–PEI–Ac–Mn3O4 NPs were measured via TEM (Figure 2). The result showed that the NPs present spherical shape with a relatively narrow size distribution (Figure 2a,b). The mean diameter of the NPs is about 7.29 nm (Figure 2c). The hydrodynamic size and ζ-potential of the NOTA–FA–FI–PEG–PEI–Ac–Mn3O4 NPs and the NOTA–FI–PEG–PEI–Ac–Mn3O4 NPs were measured by dynamic light scattering (DLS) (Table S1, Supporting Information). The hydrodynamic size of the NOTA–FA–FI–PEG–PEI–Ac–Mn3O4 NPs is measured to be 476.5 ± 13.5 nm, which is larger than the size from the TEM measurement. This may be due to the fact that DLS measures the size of NPs clusters in solution, whereas TEM measures a single nanoparticle.46,47 The ζ-potential results indicate that the surface potentials of the NOTA–FI–PEG– PEI–Ac–Mn3O4 NPs and the NOTA–FA–FI–PEG–PEI–Ac–Mn3O4 NPs are 17.6 ± 1.9 and 14.1 ± 1.6 mV, respectively, which is close to electric neutrality due to the acetylation reaction of the terminal amines of PEI. Electric neutrality of NPs is favorable to eliminate the electrostatic attachment between NPs and cell membrane. It is also worthy of noting that the synthesized NPs exhibit excellent stability. After 3 weeks, no precipitation was observed after the NOTA–FI–PEG–PEI–Ac–Mn3O4 NPs or the NOTA–FA–FI–PEG–PEI–Ac–Mn3O4 NPs were dispersed in solution, including water, PBS, and cell culture medium (Figure S5, Supporting Information).
Figure 2.

TEM image (a, b) and size distribution histogram of the NOTA–FA–FI–PEG–PEI–Ac–Mn3O4 NPs (c).
After the modification with FI, NOTA, FA–PEG-COOH, or mPEG-COOH, and acetylation on the surface of the PEI–NH2–Mn3O4 NPs, TGA was utilized to characterize the content of each organic component in the formed NOTA–FI–PEG–PEI–Ac–Mn3O4 NPs and NOTA–FA–FI–PEG–PEI–Ac–Mn3O4 NPs (Figure 3). Based on the TGA curve of the PEI–NH2–Mn3O4 NPs, there is a loss of 55.8% weight due to the PEI decoating. For the NOTA–FI–PEG–PEI–Ac–Mn3O4 NPs and the NOTA–FA–FI–PEG–PEI–Ac–Mn3O4 NPs, there are weight losses of 64.1 and 66.7%, respectively. By subtracting the weight loss of the PEI–NH2–Mn3O4 NPs (55.8%), the loading amounts of NOTA/FI/PEG/Ac and NOTA/FA/FI/PEG/Ac can be calculated to be 8.3 and 10.9%, respectively.
Figure 3.
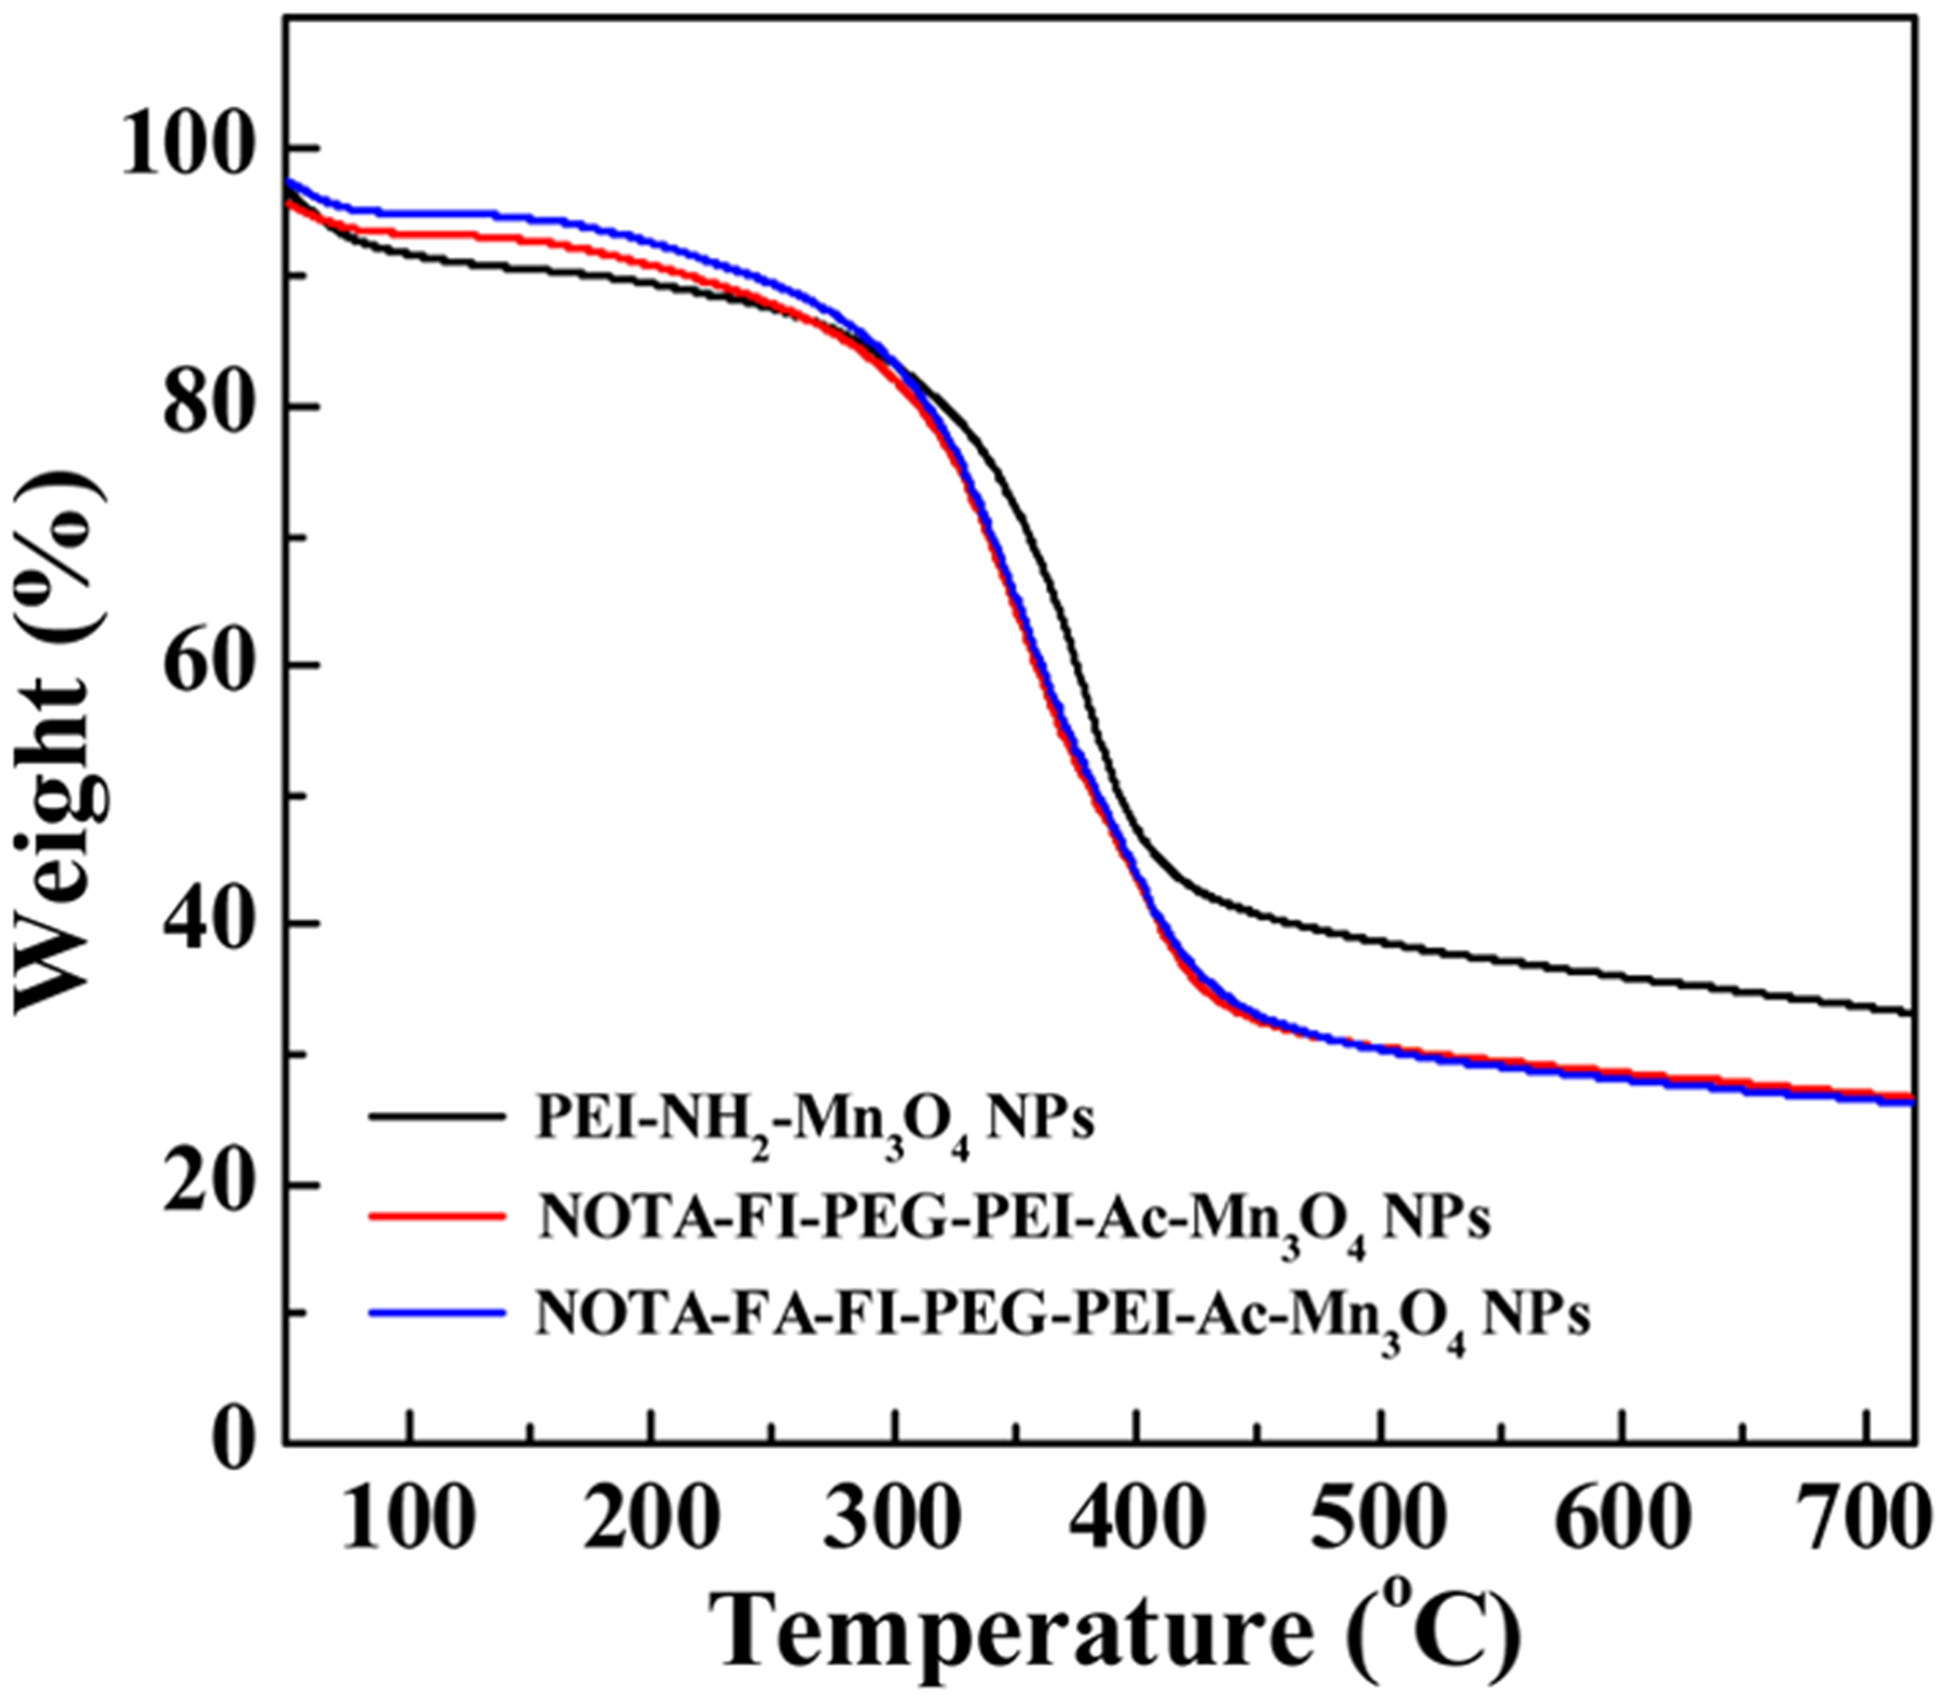
TGA curves of the PEI–NH2–Mn3O4 NPs, the NOTA–FI–PEG–PEI–Ac–Mn3O4 NPs, and the NOTA–FA–FI–PEG–PEI–Ac–Mn3O4 NPs.
Radiolabeling of the formed NOTA–FA–FI–PEG–PEI–Ac–Mn3O4 NPs with 64Cu was successful in >85% yield (n = 8, decay-corrected) with >99% radiochemical purity. Based on the average molecular weight of NPs and the radiochemical yield of the 64Cu-labeled NPs, the specific activity of the 64Cu–NOTA–FA–FI–PEG–PEI–Ac–Mn3O4 NPs was calculated to be 1.5 MBq/nmol.
The radiolabeled, antibody-conjugated Mn3O4 NPs were recently reported for CD105-targeted PET/MR imaging of tumor angiogenesis,48 where the DSPE–PEG5000-NH2 was used for the construction of liposome-based NPs, and the targeting moiety is anti-CD105 antibody TRC105. In this study, the NPs are PEI-based branched polymers, and the surface of NPs was functionalized with FA for targeting FR. In terms of the difference of nanomaterials and NPs functionalization, the different biological behaviors of the NPs are expected in this study versus those reported previously.
3.2. In Vitro Biocompatibility.
Before in vivo evaluation, it is important to assess the cytocompatibility of the NOTA–FI–PEG–PEI–Ac–Mn3O4 NPs and the NOTA–FA–FI–PEG–PEI–Ac–Mn3O4 NPs. MTT assay was used to investigate the cytotoxicity. As shown in Figure 4, the cell viability of HeLa cells is larger than 70% even when the cells were treated with a high concentration of the NOTA–FI–PEG–PEI–Ac–Mn3O4 NPs or the NOTA–FA–FI–PEG–PEI–Ac–Mn3O4 NPs, where the Mn concentration is up to 100 μg/mL. The data demonstrated the good cytocompatibility of the NOTA–FI–PEG–PEI–Ac–Mn3O4 NPs and the NOTA–FA–FI–PEG–PEI–Ac–Mn3O4 NPs within the given Mn concentration range (5–100 μg/mL). The phase contrast microscope was also used to observe the cell morphology and confirm the biocompatibility of the prepared NPs indirectly (Figure S6, Supporting Information). As compared to the cells treated with PBS, morphology of HeLa cells does not present obvious changes in the group where cells were treated with the NOTA–FA–FI–PEG–PEI–Ac–Mn3O4 NPs or the NOTA–FI–PEG–PEI–Ac–Mn3O4 within the given Mn concentrations. This result is in agreement with the data from the MTT assay, further demonstrating excellent biocompatibility of the NOTA–FI–PEG–PEI–Ac–Mn3O4 NPs and the NOTA–FA–FI–PEG–PEI–Ac–Mn3O4 NPs.
Figure 4.
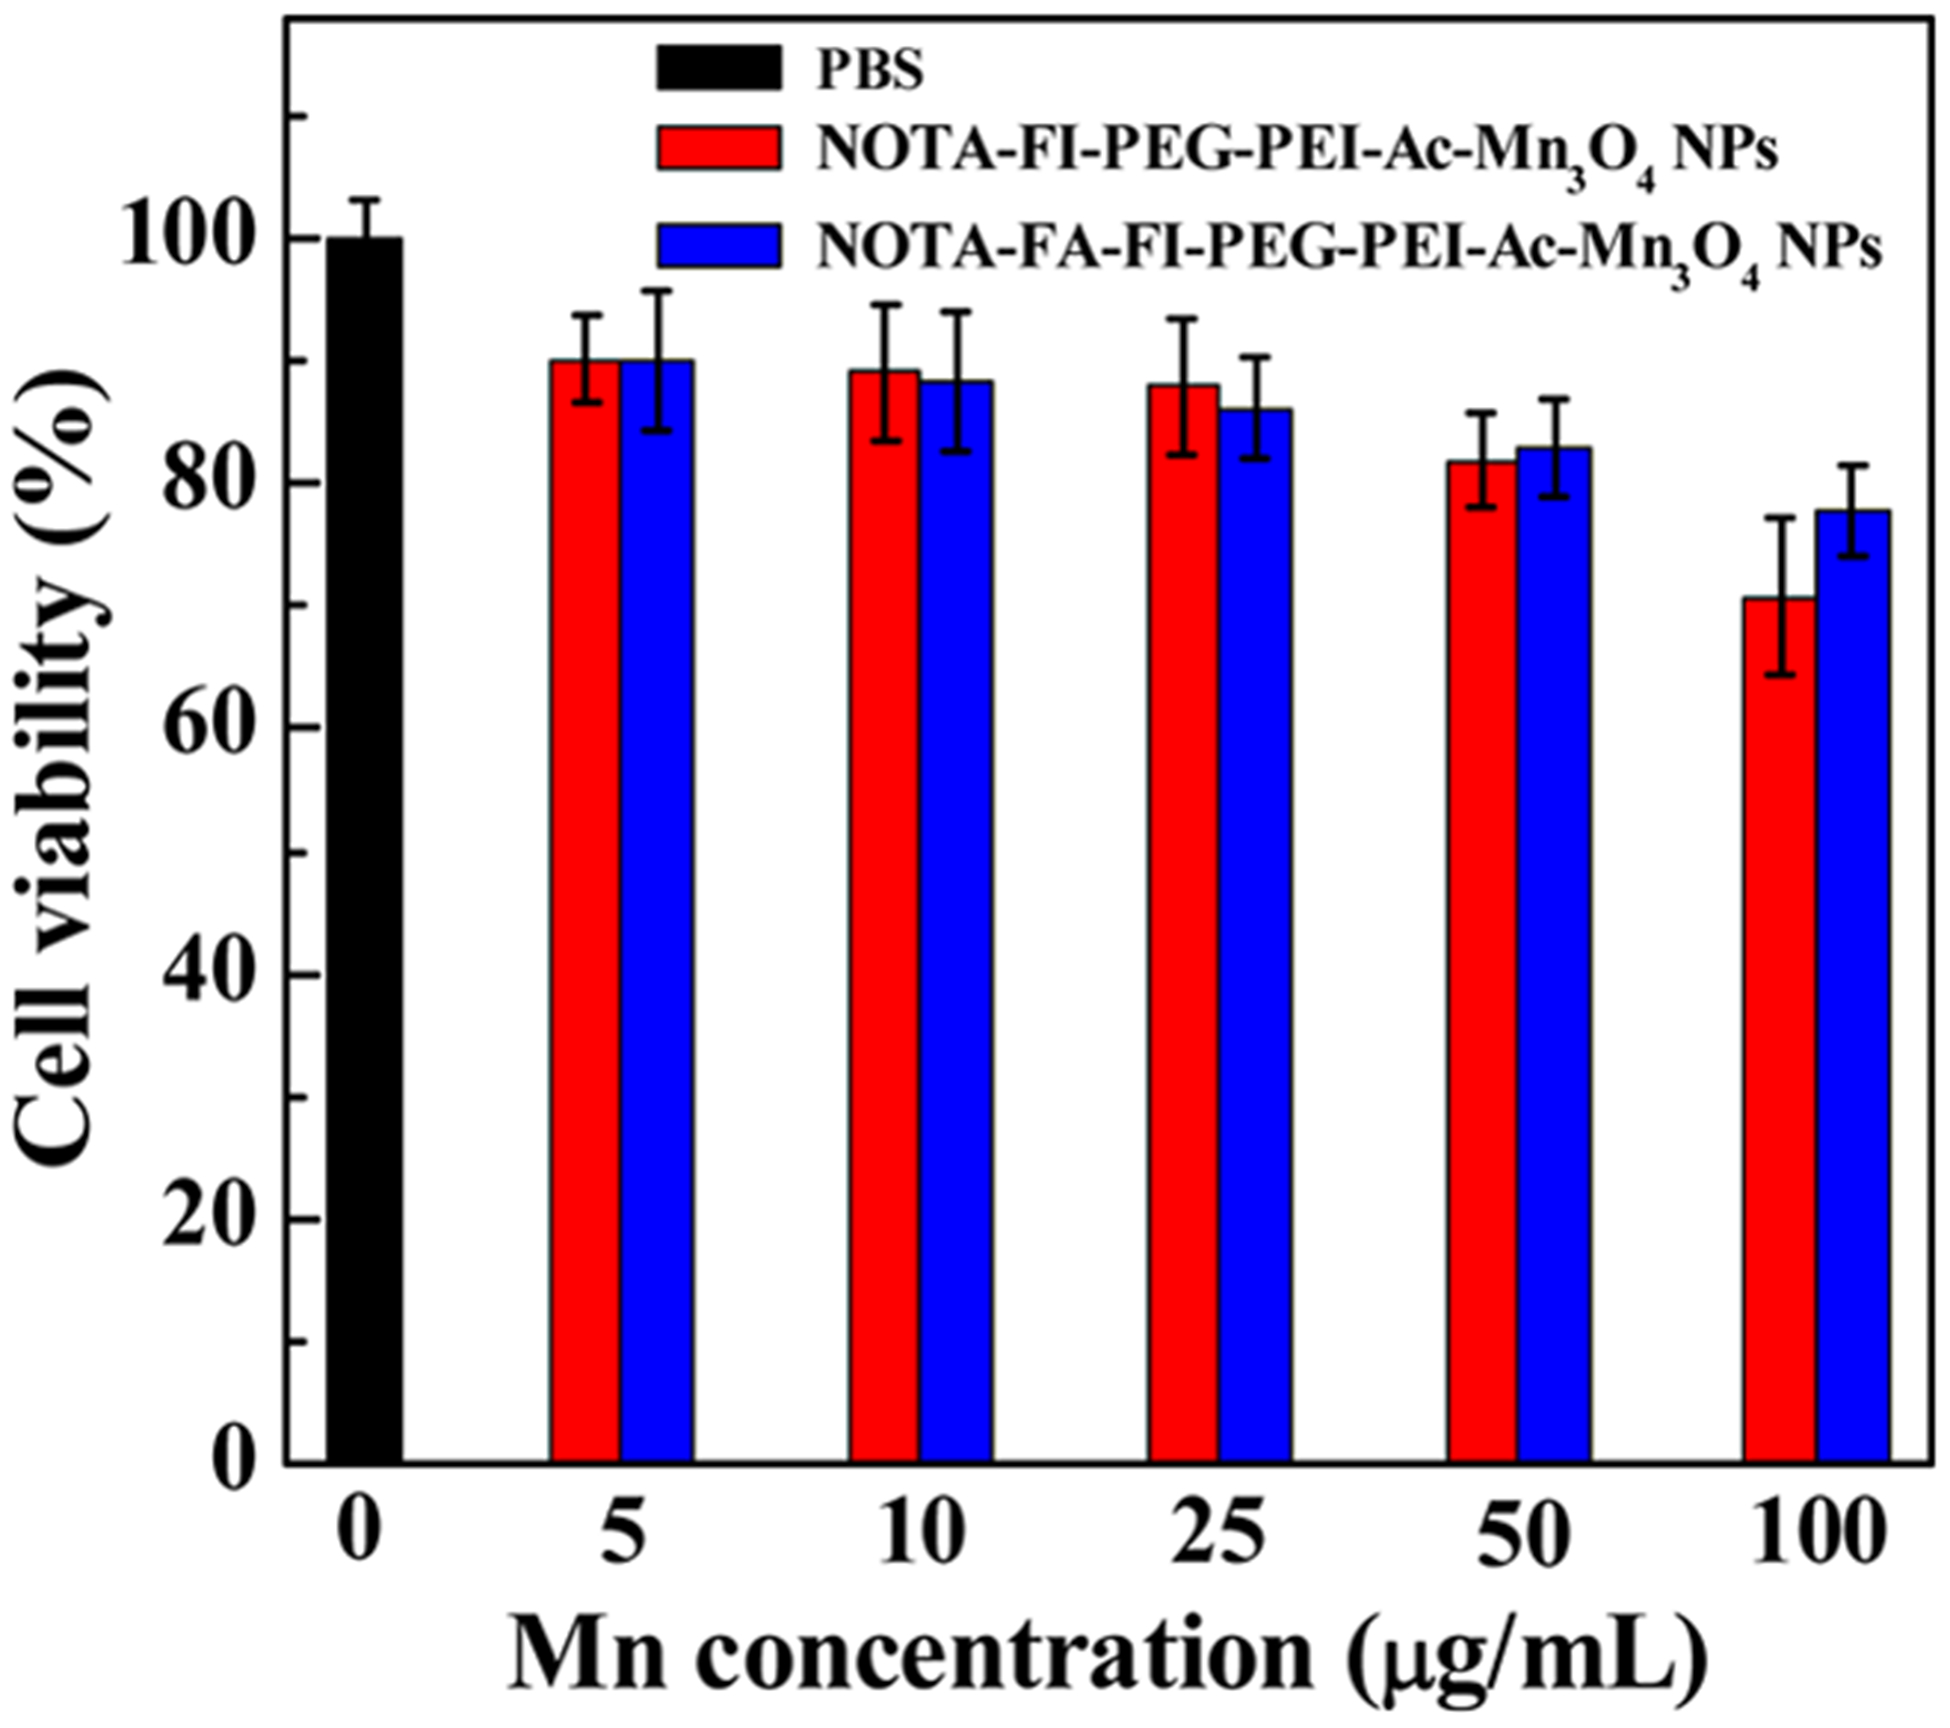
MTT assay of HeLa cell viability after incubation with the NOTA–FI–PEG–PEI–Ac–Mn3O4 NPs or the NOTA–FA–FI–PEG–PEI–Ac–Mn3O4 NPs at the Mn concentration of 5–100 μg/mL for 24 h. HeLa cells incubated with PBS were used as a control.
3.3. Targeting Specificity of NOTA–FA–FI–PEG–PEI–Ac–Mn3O4 NPs.
It has been well studied that many human carcinomas overexpress FR.49,50 In this work, both flow cytometry and confocal microscopy were utilized to assess the target specificity of the NOTA–FA–FI–PEG–PEI–Ac–Mn3O4 NPs to FR-overexpressing HeLa cells. As shown in the flow cytometry result (Figure S7, Supporting Information), HeLa cells incubated with the NOTA–FA–FI–PEG–PEI–Ac–Mn3O4 NPs exhibit remarkable fluorescence enhancement as compared to those incubated with the NOTA–FI–PEG–PEI–Ac–Mn3O4 NPs (p < 0.001) at the same concentrations of Mn. The fluorescence intensity associated with HeLa cells after the incubation with the NOTA–FA–FI–PEG–PEI–Ac–Mn3O4 NPs is apparently enhanced when compared to that after incubation with the nontargeted NPs, suggesting the targeting of the NOTA–FA–FI–PEG–PEI–Ac–Mn3O4 NPs toward HeLa cells is likely through the FR-mediated endocytosis.51,52 The slight fluorescence enhancement of HeLa cells incubated with the NOTA–FI–PEG–PEI–Ac–Mn3O4 NPs could be caused by the nonspecific uptake of NPs by phagocytosis or diffusion through cell walls.53,54
The FI conjugation with NPs enables the observation of cell uptake of the NOTA–FI–PEG–PEI–Ac–Mn3O4 NPs and the NOTA–FA–FI–PEG–PEI–Ac–Mn3O4 NPs via confocal microscopy (Figure 5). After 4 h treatment, the HeLa cells incubated with the NOTA–FA–FI–PEG–PEI–Ac–Mn3O4 NPs present more apparent fluorescence signals than that with the NOTA–FI–PEG–PEI–Ac–Mn3O4 NPs, suggesting the remarkable cell uptake of NPs into the cytoplasma according to the FR-mediated specific binding effect. In addition, the HeLa cells incubated with the NOTA–FI–PEG–PEI–Ac–Mn3O4 NPs or the NOTA–FA–FI–PEG–PEI–Ac–Mn3O4 NPs both display appreciable fluorescence, which is comparable to those cells incubated with PBS. The result from confocal microscopy is consistent with flow cytometric analysis. Overall, the formed NOTA–FA–FI–PEG–PEI–Ac–Mn3O4 NPs are specifically taken up by FR-overexpressing HeLa cells due to FR-mediated binding and endocytosis pathway.
Figure 5.
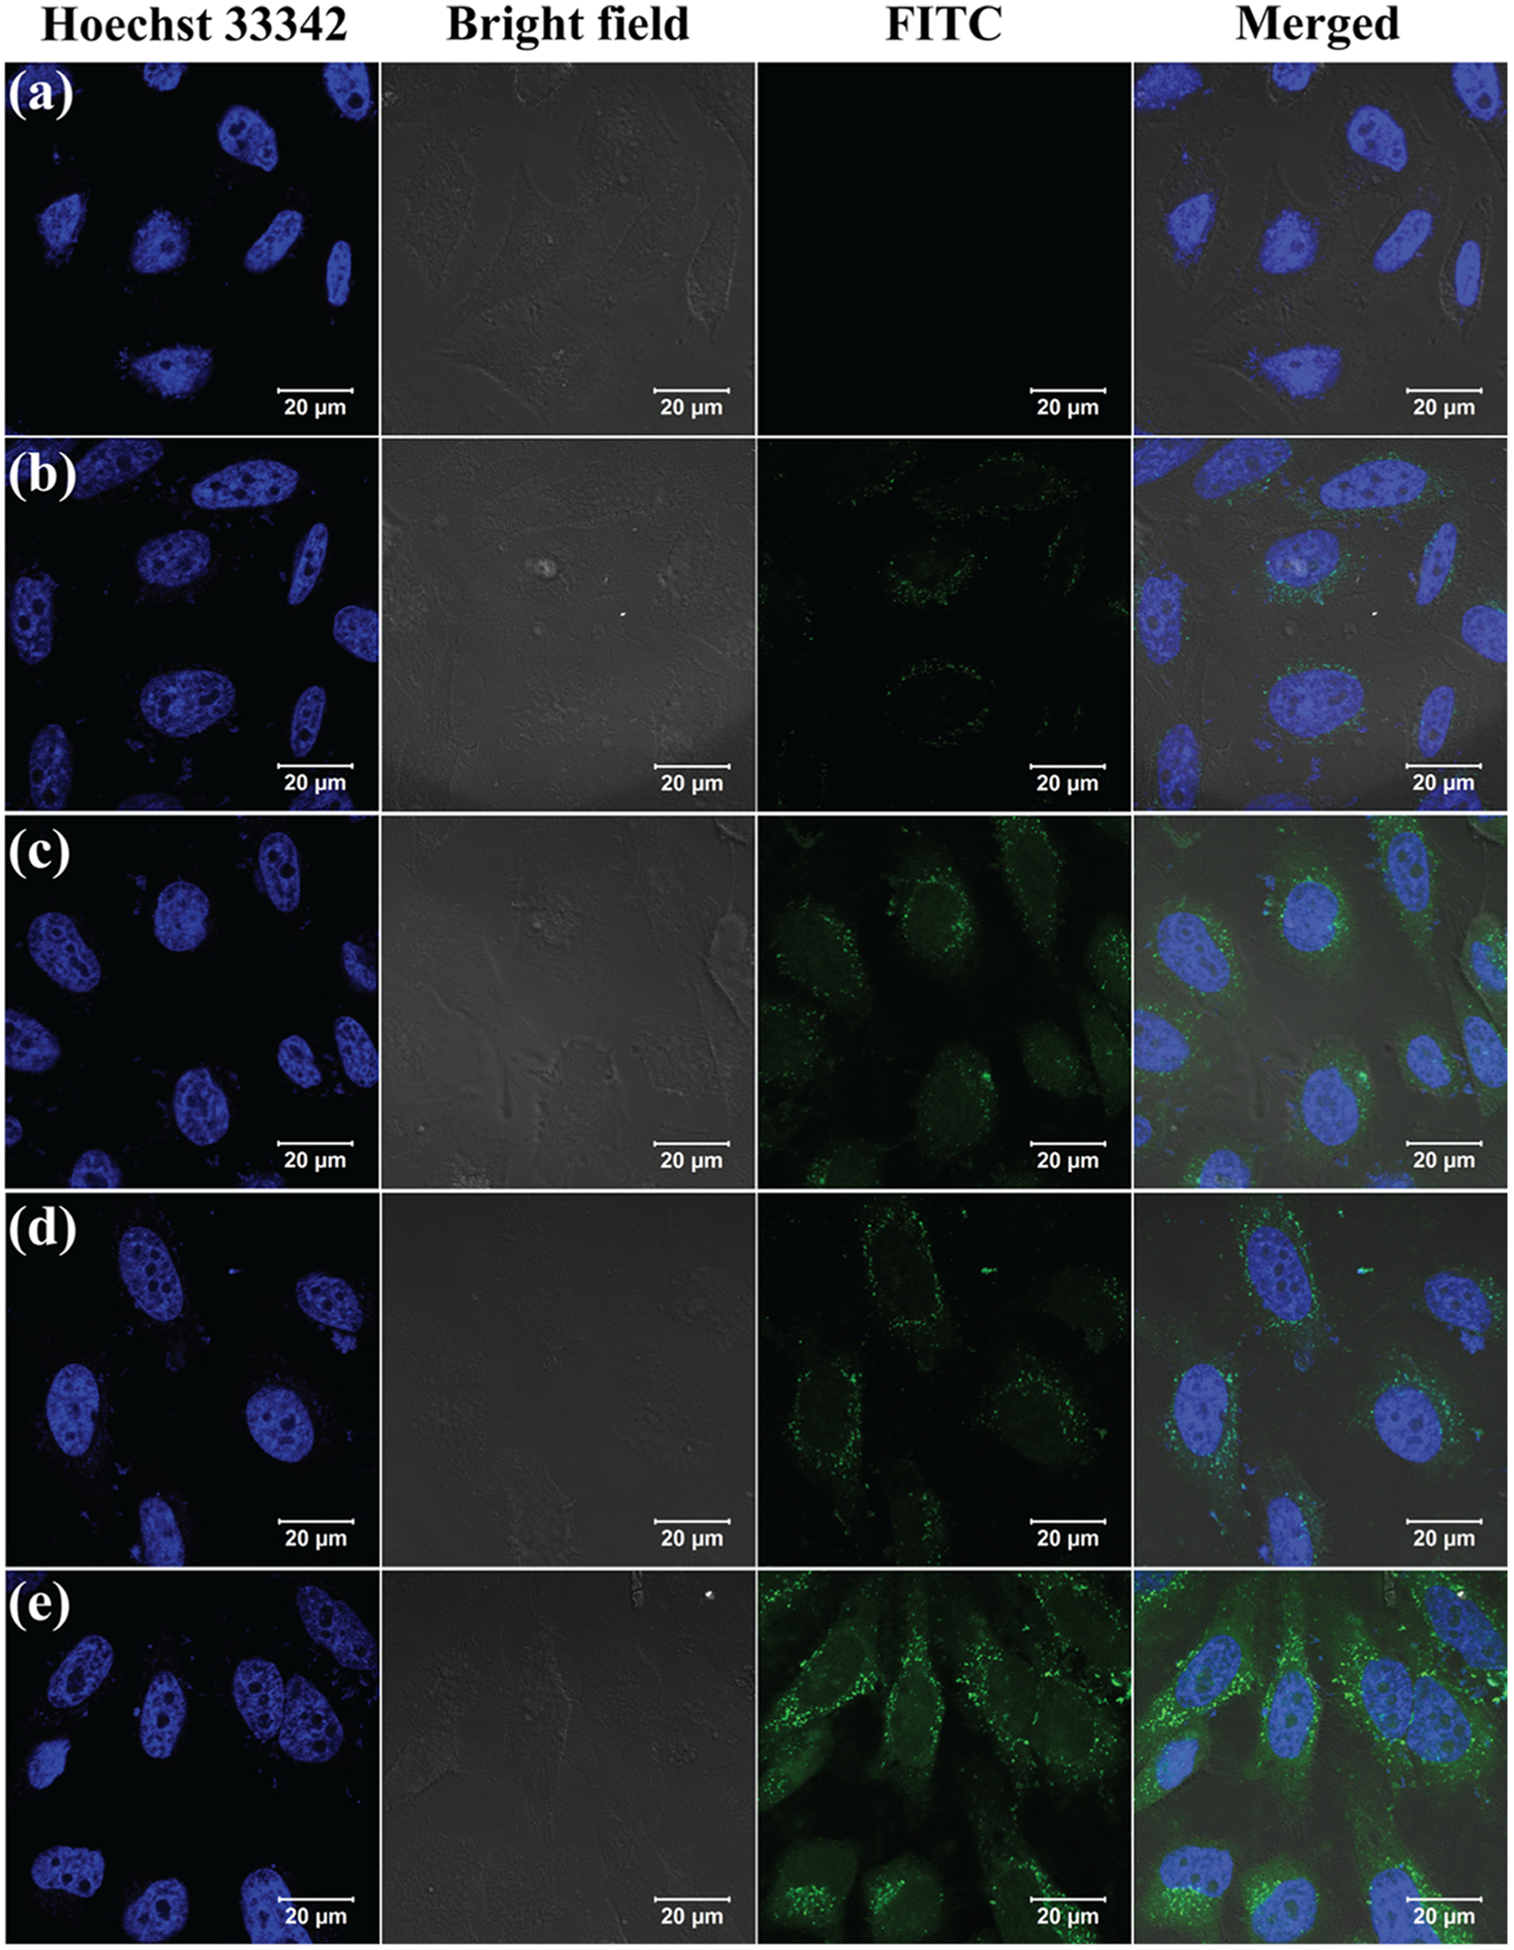
Confocal microscopy images of HeLa cells after 4 h incubation with PBS (a), the NOTA–FI–PEG–PEI–Ac–Mn3O4 NPs at the Mn concentration of 5 μg/mL (b), the NOTA–FA–FI–PEG–PEI–Ac–Mn3O4 NPs at the Mn concentration of 5 μg/mL (c), the NOTA–FI–PEG–PEI–Ac–Mn3O4 NPs at the Mn concentration of 10 μg/mL (d), and the NOTA–FA–FI–PEG–PEI–Ac–Mn3O4 NPs at the Mn concentration of 10 μg/mL (e).
3.4. T1 MR Relaxometry.
The NOTA–FA–FI–PEG–PEI–Ac–Mn3O4 NPs can be used as T1 MRI agents due to the presence of the Mn3O4 NPs. From analysis of the MR images (Figure S8a, Supporting Information), MR signal intensity of the NOTA–FA–FI–PEG–PEI–Ac–Mn3O4 NPs enhances with the increasing Mn concentration of the NPs. The T1 relaxation time in aqueous solutions of the NOTA–FA–FI–PEG–PEI–Ac–Mn3O4 NPs with various Mn concentrations was measured. Through a linear fitting of the inverse relaxation time (1/T1) as a function of Mn concentration, the slope (0.996 mM–1 s−1) of a linear curve was acquired (Figure S8b, Supporting Information). The slope is defined as T1 relaxivity (r1) of the formed NOTA–FA–FI–PEG–PEI–Ac–Mn3O4 NPs. Interestingly, the r1 of the NOTA–FA–FI–PEG–PEI–Ac–Mn3O4 NPs is higher than that of the similar Mn3O4 NPs (0.57 mM−1 s−1) previously reported.38 This may be caused by the high PEG loading percentage in the NOTA–FA–FI–PEG–PEI–Ac–Mn3O4 NPs facilitating the accessibility of water protons towards the core Mn3O4 NPs of the NOTA–FA–FI–PEG–PEI–Ac–Mn3O4 NPs.35 In fact, the high T1 relaxivity is beneficial for sensitive MRI applications.
3.5. In Vitro Stability of 64Cu–NOTA–FA–FI–PEG–PEI–Ac–Mn3O4 NPs.
The in vitro stability of the 64Cu–NOTA–FA–FI–PEG–PEI–Ac–Mn3O4 NPs was determined in mouse serum at 37 °C for 1, 2, 5, and 24 h, respectively. Based on the radio-TLC analysis, the stability was presented as a percentage of parent radiolabeled probe. Greater than 90% of the intact 64Cu–NOTA–FA–FI–PEG–PEI–Ac–Mn3O4 NPs presented after 24 h incubation (Table 1), suggesting that the 64Cu–NOTA–FA–FI–PEG–PEI–Ac–Mn3O4 NPs are quite stable in mouse serum within the study period.
Table 1.
Stability of the64Cu–NOTA–FA–FI–PEG–PEI–Ac–Mn3O4 NPs in Mouse Serum at 37 °C for 1, 2, 5, and 24 h
| time (h) | 1 | 2 | 5 | 24 |
| radiochemical purity (%) | 99.23 ± 0.48 | 99.02 ± 0.59 | 95.03 ± 1.29 | 91.54 ± 1.11 |
3.6. Targeted MRI of HeLa Cells.
HeLa cells incubated with the NOTA–FI–PEG–PEI–Ac–Mn3O4 NPs, or the NOTA–FA–FI–PEG–PEI–Ac–Mn3O4 NPs, and FA-blocked HeLa cells incubated with the NOTA–FA–FI–PEG–PEI–Ac–Mn3O4 NPs demonstrate an enhancement of the MR signal with the increase of Mn concentration in general (Figure 6a). Based on the quantitative analysis of MR signal intensity (Figure 6b), the HeLa cells treated with the NOTA–FA–FI–PEG–PEI–Ac–Mn3O4 NPs display higher MR signal than (i) the HeLa cells incubated with the nontargeted NOTA–FI–PEG–PEI–Ac–Mn3O4 NPs and (ii) FR-blocked HeLa cells with treatment of the NOTA–FA–FI–PEG–PEI–Ac–Mn3O4 NPs at the same Mn concentration, especially at high Mn concentrations (22.0 μg/mL (p < 0.001) and 44.0 μg/mL (p < 0.01)). The result further indicates the target-specific binding of the constructed NOTA–FA–FI–PEG–PEI–Ac–Mn3O4 NPs in FR-overexpressing HeLa cells.
Figure 6.
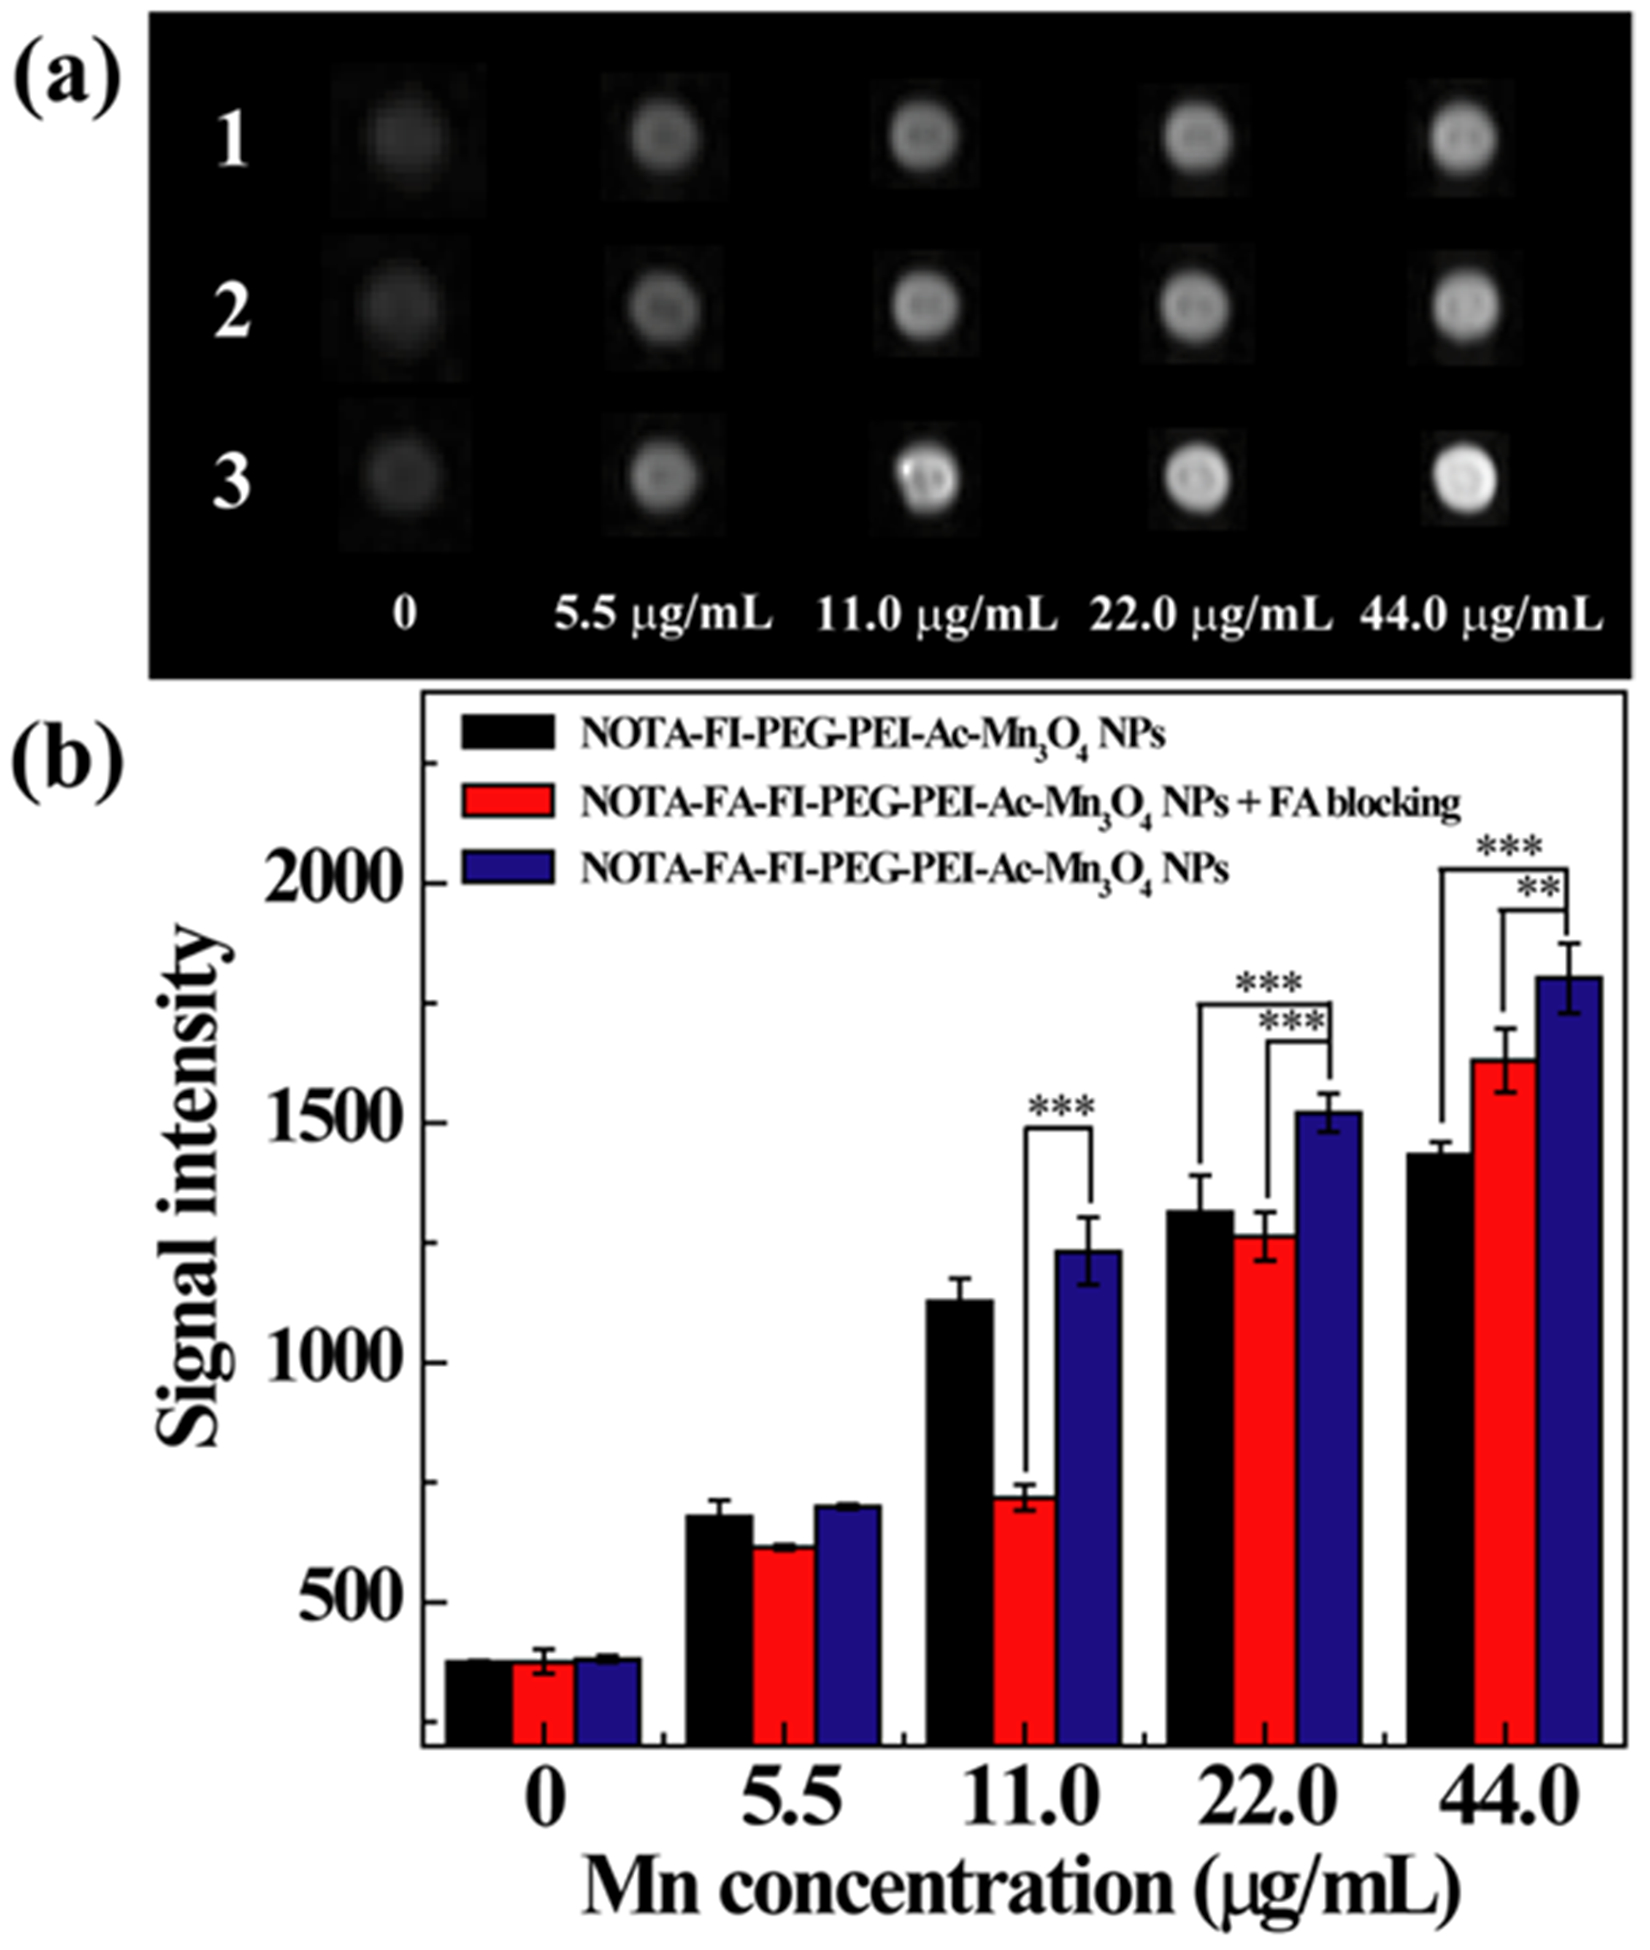
(a) T1-weighted MR images of FR-blocked HeLa cell suspensions (1), HeLa cell suspensions (3) incubated with the NOTA–FA–FI–PEG–PEI–Ac–Mn3O4 NPs, and HeLa cell suspensions incubated with the NOTA–FI–PEG–PEI–Ac–Mn3O4 NPs (2) at various Mn concentrations for 4 h. (b) The quantitative MR signal intensity of the FR-blocked HeLa cell and HeLa cell suspensions as a function of Mn concentration.
3.7. Targeted Tumor PET/MR Imaging.
The in vivo MRI of the NOTA–FA–FI–PEG–PEI–Ac–Mn3O4 NPs was performed after the mouse tumor model was established. As shown in Figure 7a, the tumor site becomes brighter after the injection of the NOTA–FI–PEG–PEI–Ac–Mn3O4 NPs and the NOTA–FA–FI–PEG–PEI–Ac–Mn3O4 NPs than pre-injection. At 1 and 2 h pi, the tumor MR signals cannot be clearly distinguished between the mice treated with the NOTA–FI–PEG–PEI–Ac–Mn3O4 NPs and the NOTA–FA–FI–PEG–PEI–Ac–Mn3O4 NPs. However, the quantitative analysis demonstrates that the MR signal of the tumor with the injection of the NOTA–FA–FI–PEG–PEI–Ac–Mn3O4 NPs is significantly higher than that of the tumor with the treatment of the NOTA–FI–PEG–PEI–Ac–Mn3O4 NPs at 5 h (p < 0.001) and 18 h (p < 0.01) pi (Figure 7b). The result indicates that the NOTA–FA–FI–PEG–PEI–Ac–Mn3O4 NPs render targeted tumor MRI via FA-mediated targeting effect.
Figure 7.
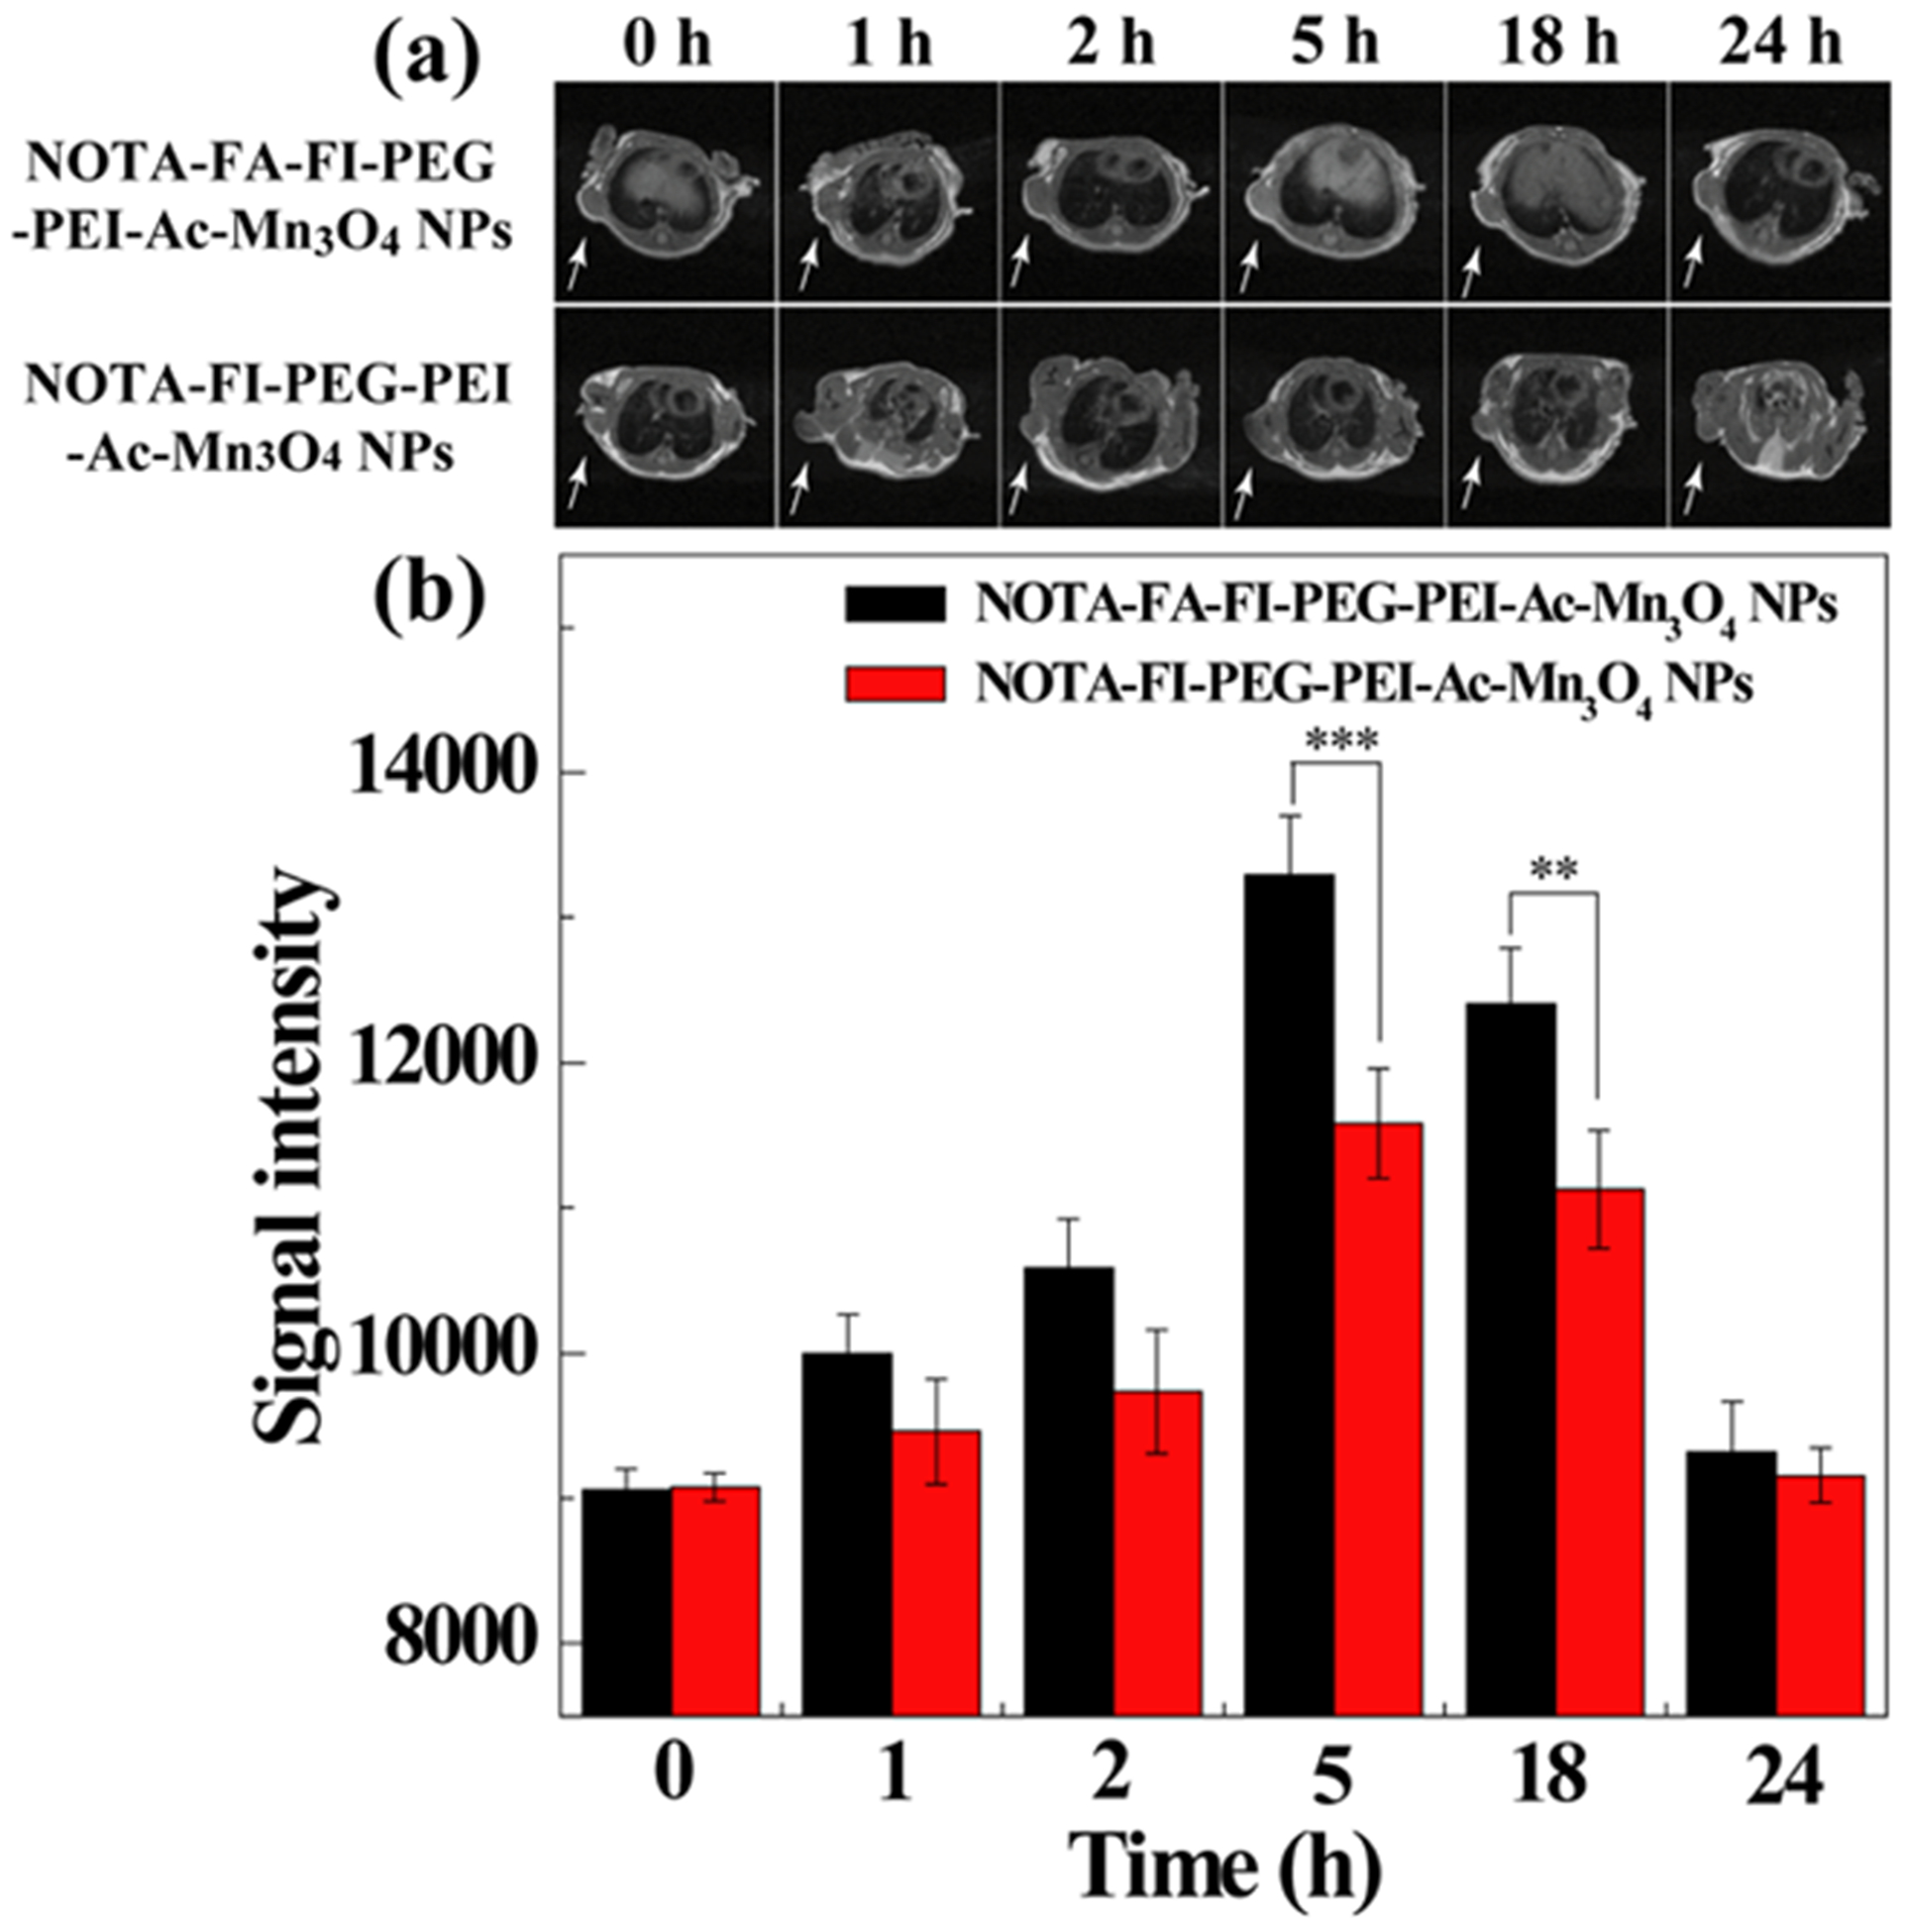
In vivo T1-weighted MR images (a) and signal intensity (b) of HeLa tumors after intravenous injection of the NOTA–FA–FI–PEG–PEI–Ac–Mn3O4 NPs or the NOTA–FI–PEG–PEI–Ac–Mn3O4 NPs (500 mg Mn, in 0.2 mL saline) at different time points. Tumors are indicated by white arrows.
We next investigated the targeted tumor PET imaging application of the 64Cu–NOTA–FA–FI–PEG–PEI–Ac–Mn3O4 NPs in vivo. After the intravenous injection of the 64Cu–NOTA–FA–FI–PEG–PEI–Ac–Mn3O4 NPs, the 64Cu–NOTA–FA–FI–PEG–PEI–Ac–Mn3O4 NPs with FA blocking or the 64Cu–NOTA–FI–PEG–PEI–Ac–Mn3O4 NPs with the same dose, the animals (n = 4/group) were scanned through a microPET imaging system. As shown in Figure 8, similar to the result from the MRI, at 1 and 2 h pi, the PET signal cannot be clearly distinguished at the tumor site among the mice with the 64Cu–NOTA–FI–PEG–PEI–Ac–Mn3O4 NPs, the 64Cu–NOTA–FA–FI–PEG–PEI–Ac–Mn3O4 NPs, and the 64Cu–NOTA–FA–FI–PEG–PEI–Ac–Mn3O4 NPs with FA blocking. However, at 5 and 18 h pi, the 64Cu–NOTA–FA–FI–PEG–PEI–Ac–Mn3O4 NPs displayed predominant HeLa tumor uptake as compared to the 64Cu–NOTA–FI–PEG–PEI–Ac–Mn3O4 NPs and the 64Cu–NOTA–FA–FI–PEG–PEI–Ac–Mn3O4 NPs with FA blocking. From the PET images, the radioactivity in major organs and tumors was measured from the coronal images at different time points pi (Figure 9). Radioactivity was gradually excreted from the liver and kidneys (Figure 9a–c). Based on the quantitative analysis, significantly high tumor uptake of the 64Cu–NOTA–FA–FI–PEG–PEI–Ac–Mn3O4 NPs was observed as compared to the 64Cu–NOTA–FA–FI–PEG–PEI–Ac–Mn3O4 NPs with FA blocking or the 64Cu–NOTA–FI–PEG–PEI–Ac–Mn3O4 NPs at 5 h (p < 0.001) and 18 h (p < 0.001) pi, suggesting the target-specific tumor uptake of the 64Cu–NOTA–FA–FI–PEG–PEI–Ac–Mn3O4 NPs (Figure 9d). The radioactivity of major organs and tumor in different groups at 18 h pi is shown in Table S2 (Supporting Information). The results demonstrate that the 64Cu–NOTA–FA–FI–PEG–PEI–Ac–Mn3O4 NPs exhibit good tumor uptake in HeLa tumor xenografts at 18 h pi (tumor-to-muscle (T/M) ratio: 5.35 ± 0.31) through the FA-mediated targeting pathway, whereas lower tumor uptake was observed for the 64Cu–NOTA–FA–FI–PEG–PEI–Ac–Mn3O4 NPs with FA blocking (T/M ratio: 2.78 ± 0.68) and the 64Cu–NOTA–FI–PEG–PEI–Ac–Mn3O4 NPs (T/M ratio: 3.64 ± 0.16) at 18 h pi. It is worthy to note that we did not find statistically significant difference on the tumor uptake among the FR-targeted group, the FR-blocked group, and the nontargeted group at 24 h pi (Figure 9d). One explanation could be the FR-targeted NPs were off-targeted to some degree from the FR target in relatively small tumors (around 0.5 cm3 in volume) at 24 pi. Thus, the uptake of the NPs in living animals cannot be accurately quantified by drawing the ROI based on the images. To reveal the findings from the in vivo PET, the ex vivo PET scans at 24 h pi (Figure S9, Supporting Information) were carried out. Apparently, the HeLa tumor from the mouse injected with the 64Cu–NOTA–FA–FI–PEG–PEI–Ac–Mn3O4 NPs presents the strongest PET signal, whereas the HeLa tumor in the FA-blocking group or the nontargeted group has minimal PET signal (Figure S9D, Supporting Information).
Figure 8.
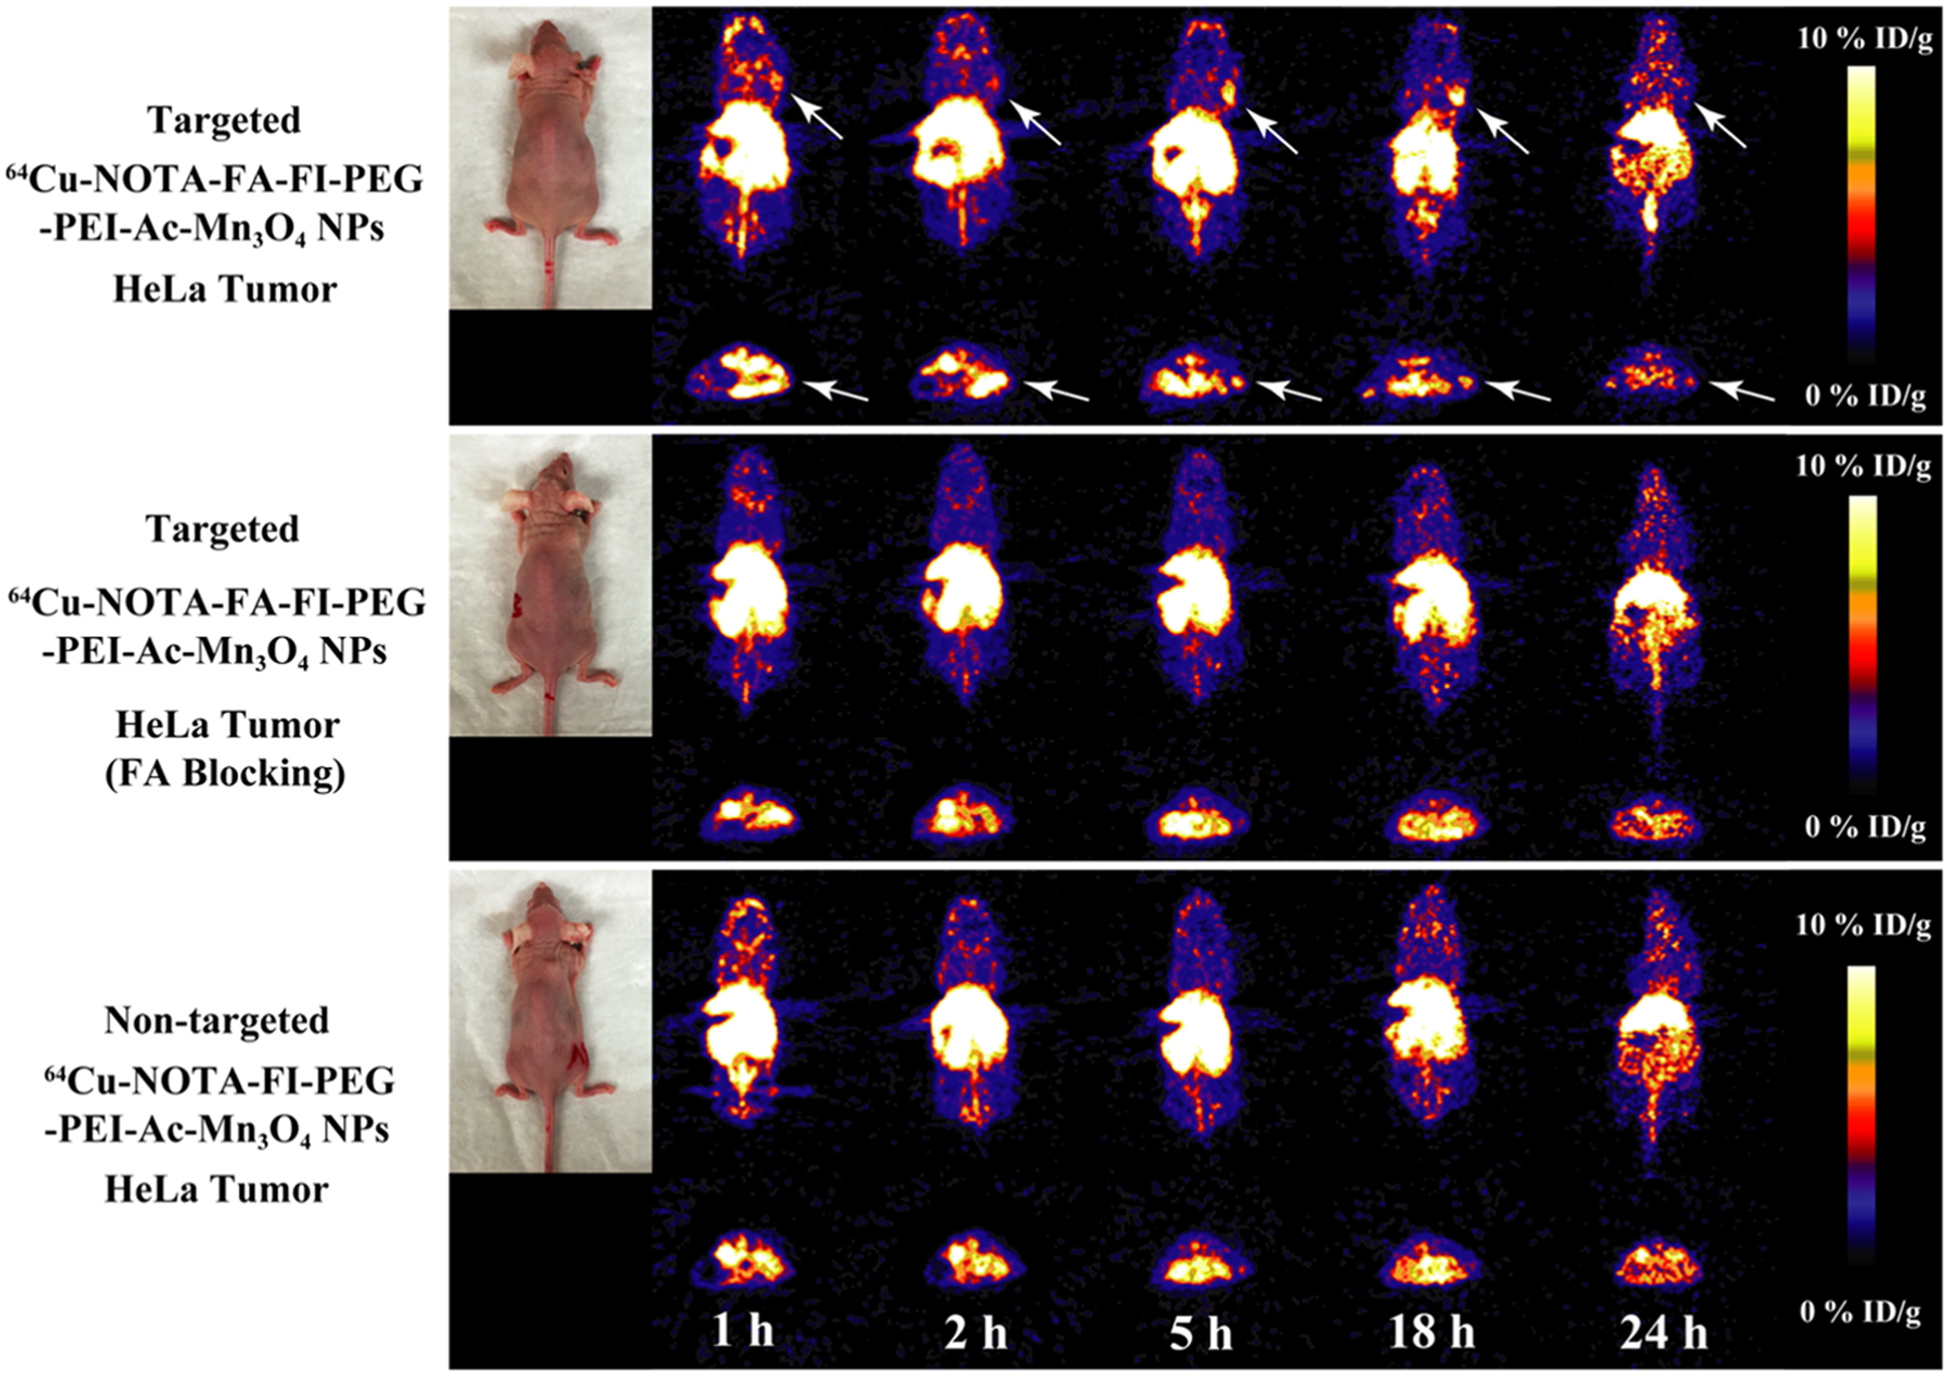
microPET images of the nude mice bearing HeLa xenografted tumors at different time points post intravenous injection of the 64Cu–NOTA–FA–FI–PEG–PEI–Ac–Mn3O4 NPs (targeted NPs), the 64Cu–NOTA–FA–FI–PEG–PEI–Ac–Mn3O4 NPs with FA blocking, and the 64Cu–NOTA–FI–PEG–PEI–Ac–Mn3O4 NPs (nontargeted NPs). The whole-body coronal (top) and transverse (bottom) microPET images of nude mice bearing HeLa xenografted tumors are shown. Tumors are indicated by arrows.
Figure 9.
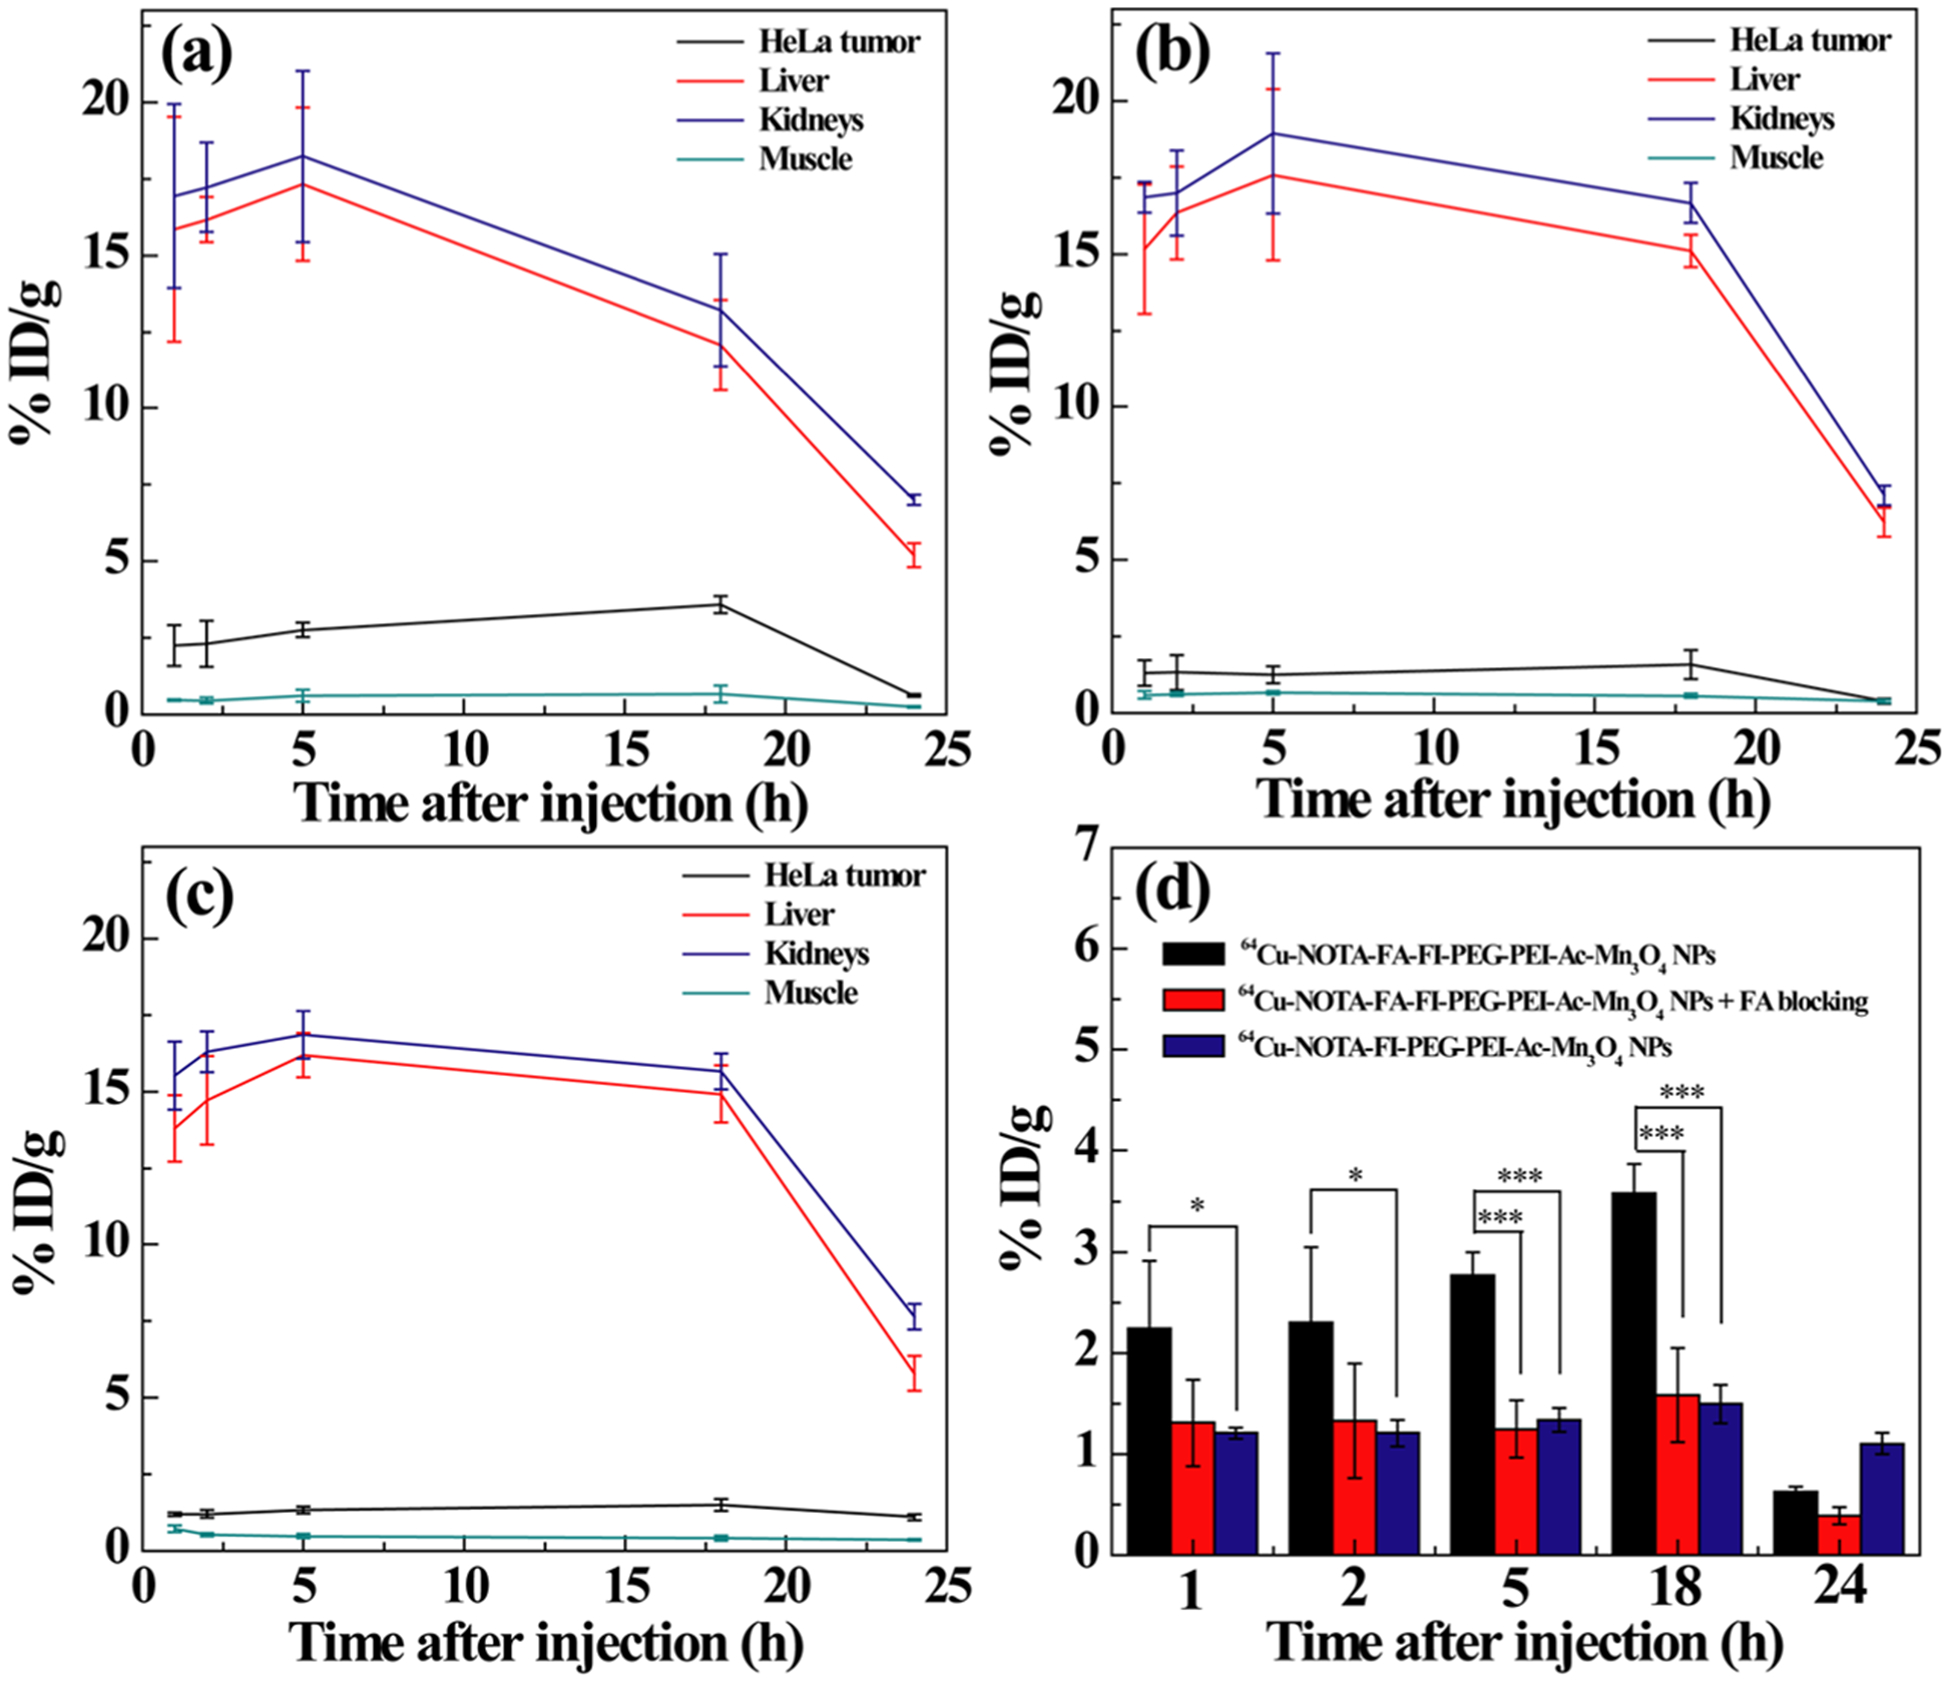
Time–activity curves of tumor, liver, kidneys, and muscle from quantitative microPET imaging analysis of (a) the 64Cu–NOTA–FA–FI–PEG–PEI–Ac–Mn3O4 NPs in the HeLa tumor model, (b) the 64Cu–NOTA–FA–FI–PEG–PEI–Ac–Mn3O4 NPs in the FR-blocked HeLa tumor model, and (c) the 64Cu–NOTA–FI–PEG–PEI–Ac–Mn3O4 NPs in HeLa tumor. (d) Quantitative microPET imaging analysis of tumor uptake of the 64Cu-labeled NPs at different time points postinjection.
3.8. Biodistribution.
The biodistribution of the 64Cu–NOTA–FA–FI–PEG–PEI–Ac–Mn3O4 NPs in HeLa tumor-bearing mice was investigated at 24 h pi. The tumors and major organs were collected, and the corresponding radioactivities were acquired by a gamma counter. The % ID/g is calculated and presented in Figure 10. The biodistribution data were consistent with the findings from in vivo and ex vivo PET imaging. As a result of the FA-mediated targeting effect, the 64Cu–NOTA–FA–FI–PEG–PEI–Ac–Mn3O4 NPs show significantly higher radioactivity uptake (1.40 ± 0.24% ID/g) in HeLa tumor than the 64Cu–NOTA–FA–FI–PEG–PEI–Ac–Mn3O4 NPs with FA blocking (0.73 ± 0.25% ID/g, p < 0.05) or the 64Cu–NOTA–FI–PEG–PEI–Ac–Mn3O4 NPs (0.64 ±0.04% ID/g, p < 0.01).
Figure 10.
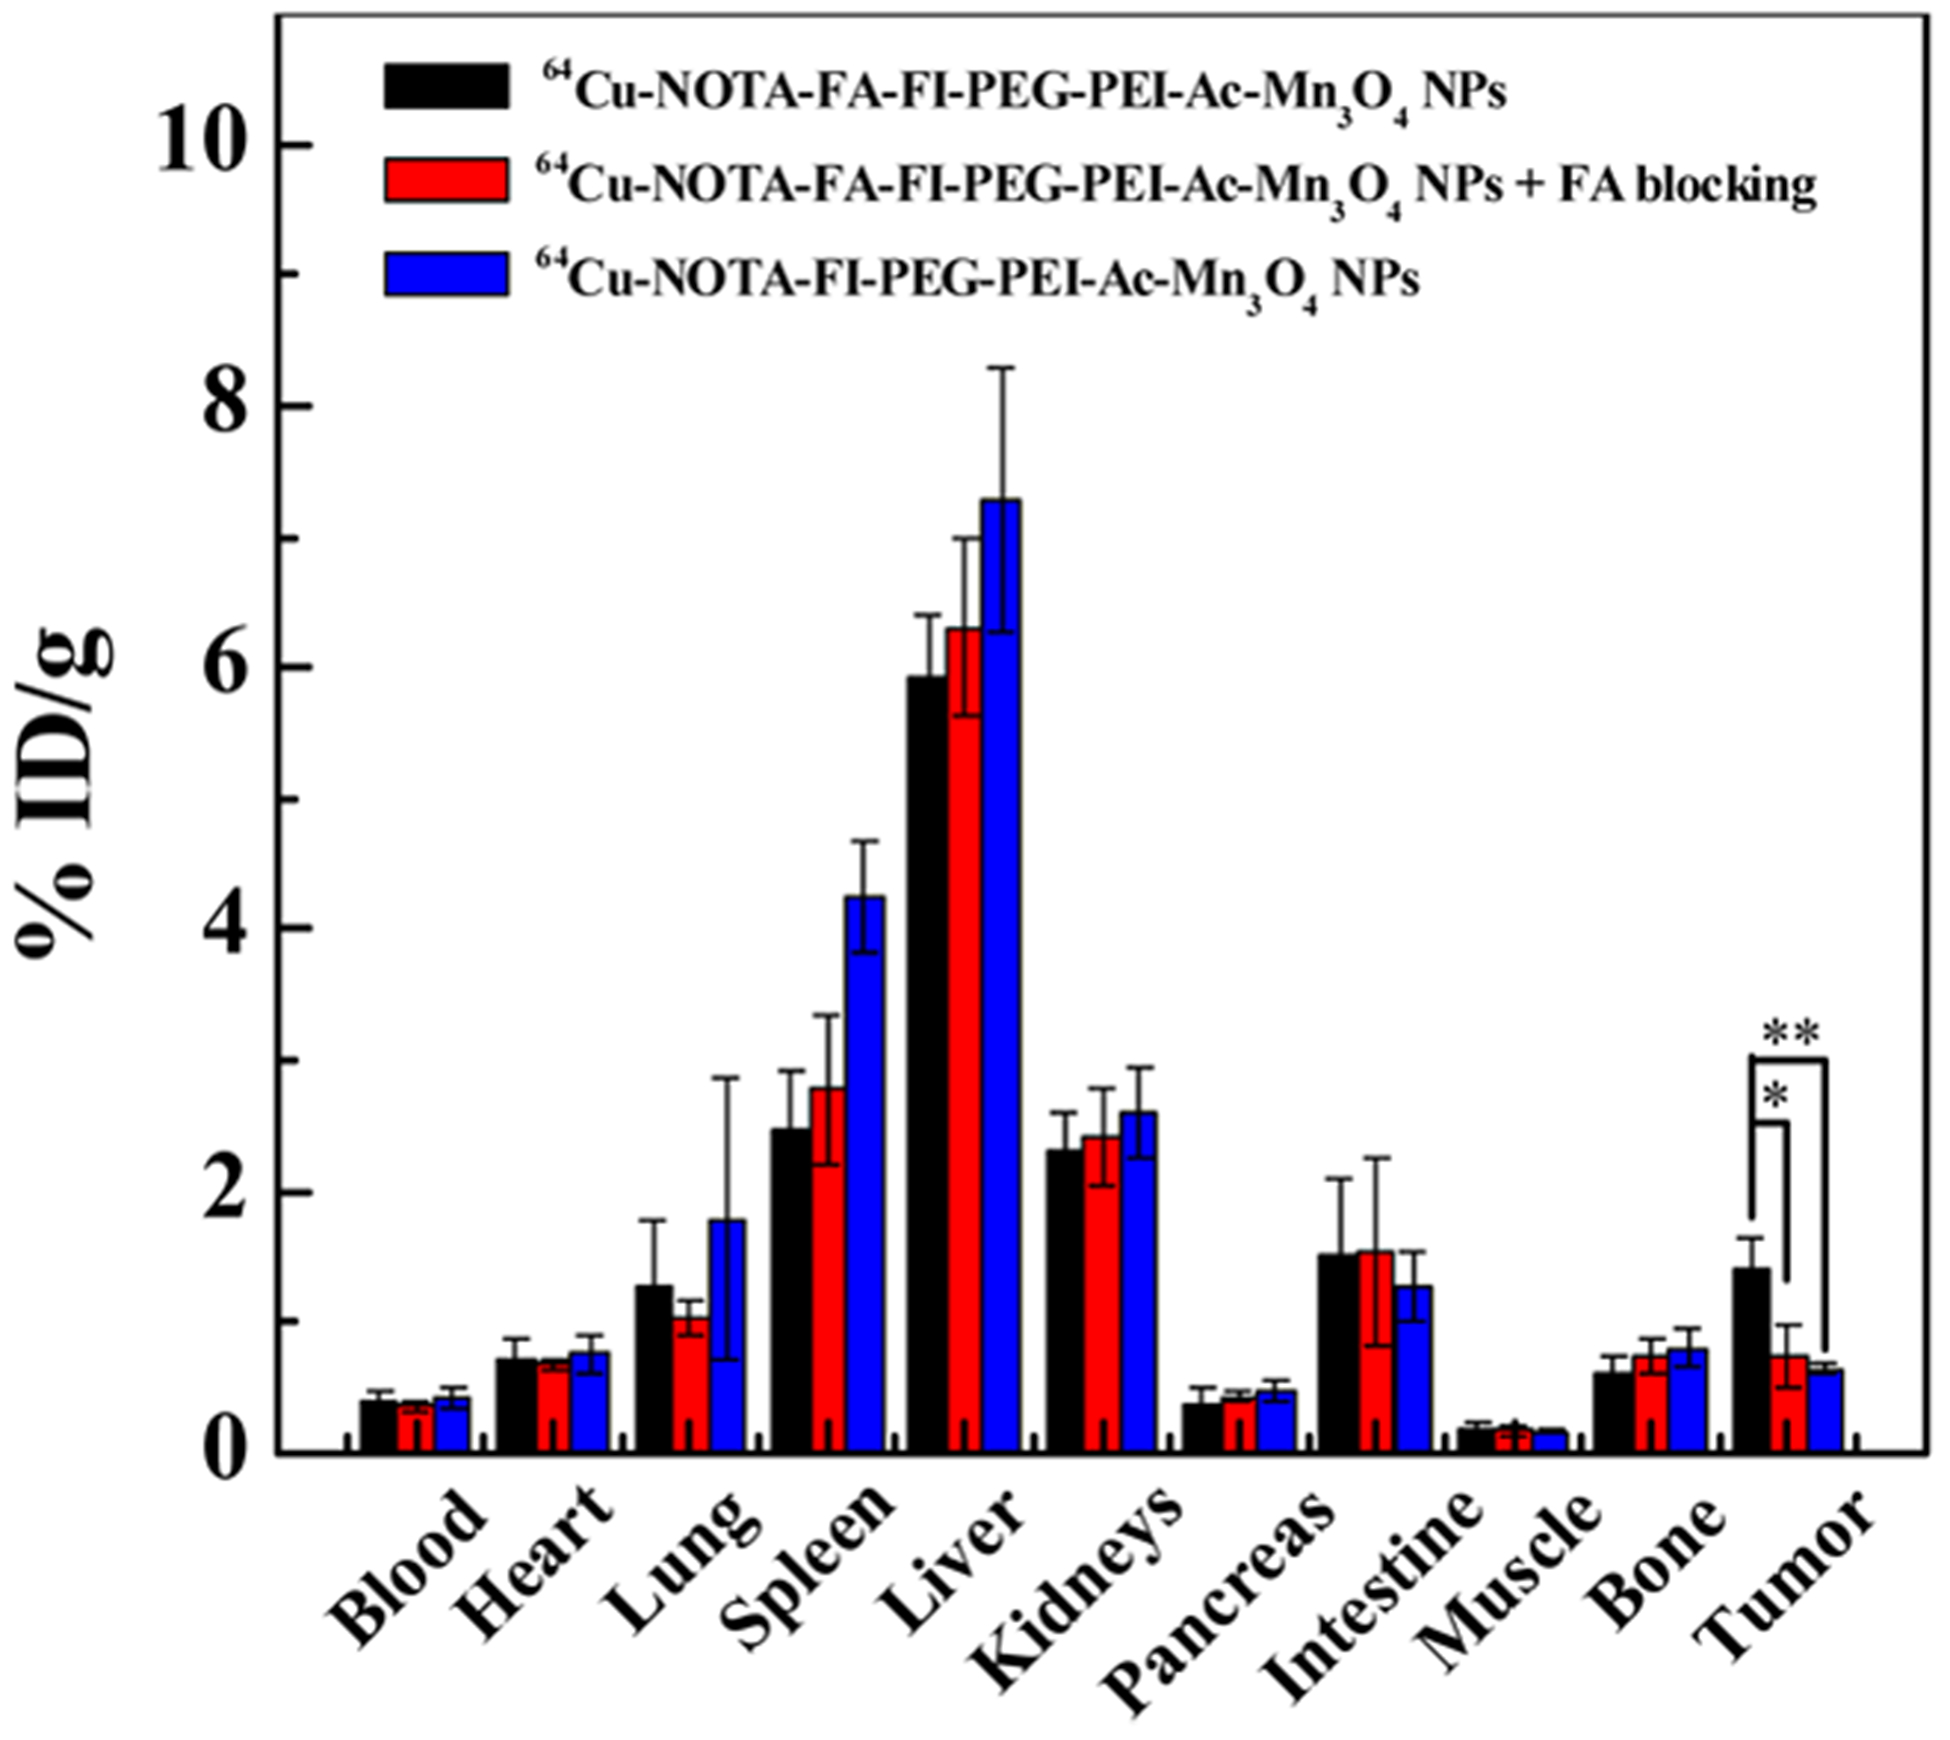
Biodistribution of the 64Cu–NOTA–FA–FI–PEG–PEI–Ac–Mn3O4 NPs or the 64Cu–NOTA–FI–PEG–PEI–Ac–Mn3O4 NPs in HeLa tumor-bearing nude mice and the 64Cu–NOTA–FA–FI–PEG–PEI–Ac–Mn3O4 NPs in FR-blocked HeLa tumor-bearing mice at 24 h postinjection.
4. CONCLUSIONS
In summary, the 64Cu-labeled multifunctional PEI-coated Mn3O4 NPs (64Cu–NOTA–FA–FI–PEG–PEI–Ac–Mn3O4 NPs) were successfully synthesized for targeted tumor dual-modality PET/MR imaging. The nonradiolabeled NOTA–FA–FI–PEG–PEI–Ac–Mn3O4 NPs demonstrate improved T1 relaxivity and effective targeted MRI toward FR-over-expressing tumor. The radiolabeled 64Cu–NOTA–FA–FI–PEG–PEI–Ac–Mn3O4 NPs showed excellent in vivo targeted PET imaging of FR-overexpressing tumor. PET/MR imaging with multifunctional NPs could provide a new quantitative method to precisely measure the FR in tumors. Given the distinctive structural features of PEI which can be readily modified with other target-specific ligands, multifunctional PEI-based nanoprobes hold a great potential on the development of targeted multi-modality contrast agents for the management of cancer.
Supplementary Material
ACKNOWLEDGMENTS
This work was supported by the Department of Radiology at the University of Southern California, the National Natural Science Foundation of China (Grant Nos. 81761148028 and 21773026), the Science and Technology Commission of Shanghai Municipality (17540712000), and the Natural Science Foundation for Colleges and Universities in Jiangsu Province (17KJB350005).
Footnotes
Supporting Information
The Supporting Information is available free of charge on the ACS Publications website at DOI: 10.1021/acsami.8b12355.
Experimental procedures; DLS and ζ-potential data; ex vivo biodistribution of the NPs; XRD pattern; FTIR spectra; 1H NMR; UV–vis spectra; photographs of NPs; micrographs of HeLa cells; flow cytometric analysis; T1 MR images; and ex vivo microPET imaging (PDF)
The authors declare no competing financial interest.
REFERENCES
- (1).Hussain T; Nguyen QT Molecular Imaging for Cancer Diagnosis and Surgery. Adv. Drug Delivery Rev 2014, 66, 90–100. [DOI] [PMC free article] [PubMed] [Google Scholar]
- (2).Yu C; Fan S; Sun Y; Pickwell-Macpherson E The Potential of Terahertz Imaging for Cancer Diagnosis: A Review of Investigations to Date. Quant. Imaging Med. Surg 2012, 2, 33–45. [DOI] [PMC free article] [PubMed] [Google Scholar]
- (3).Lumbreras B; Donat L; Hernandez-Aguado I Incidental Findings in Imaging Diagnostic Tests: A Systematic Review. Br. J. Radiol 2010, 83, 276–289. [DOI] [PMC free article] [PubMed] [Google Scholar]
- (4).Lee DE; Koo H; Sun IC; Ryu JH; Kim K; Kwon IC Multifunctional Nanoparticles for Multimodal Imaging and Theragnosis. Chem. Soc. Rev 2012, 41, 2656–2672. [DOI] [PubMed] [Google Scholar]
- (5).Sun IC; Eun DK; Koo H; Ko CY; Kim HS; Yi DK; Choi K; Kwon IC; Kim K; Ahn CH Tumor-Targeting Gold Particles for Dual Computed Tomography/Optical Cancer Imaging. Angew. Chem., Int. Ed 2011, 50, 9348–9351. [DOI] [PubMed] [Google Scholar]
- (6).Kryza D; Taleb J; Janier M; Marmuse L; Miladi I; Bonazza P; Louis C; Perriat P; Roux S; Tillement O; Billotey C Biodistribution Study of Nanometric Hybrid Gadolinium Oxide Particles as a Multimodal SPECT/MR/Optical Imaging and Theragnostic Agent. Bioconjugate Chem. 2011, 22, 1145–1152. [DOI] [PubMed] [Google Scholar]
- (7).Nam T; Park S; Lee SY; Park K; Choi K; Song IC; Han MH; Leary JJ; Yuk SA; Kwon IC; Kim K; Jeong SY Tumor Targeting Chitosan Nanoparticles for Dual-Modality Optical/MR Cancer Imaging. Bioconjugate Chem. 2010, 21, 578–582. [DOI] [PubMed] [Google Scholar]
- (8).Willmann JK; van Bruggen N; Dinkelborg LM; Gambhir SS Molecular Imaging in Drug Development. Nat. Rev. Drug Discov 2008, 7, 591–607. [DOI] [PubMed] [Google Scholar]
- (9).Yoon SH; Goo JM; Lee SM; Park CM; Cheon GJ PET/ MR Imaging for Chest Diseases: Review of Initial Studies on Pulmonary Nodules and Lung Cancers. Magn. Reson. Imaging Clin. N. Am 2015, 23, 245–259. [DOI] [PubMed] [Google Scholar]
- (10).Souvatzoglou M; Eiber M; Martinez-Moeller A; Furst S; Holzapfel K; Maurer T; Ziegler S; Nekolla S; Schwaiger M; Beer AJ PET/MR in Prostate Cancer: Technical Aspects and Potential Diagnostic Value. Eur. J. Nucl. Med. Mol. Imaging 2013, 40, S79–S88. [DOI] [PubMed] [Google Scholar]
- (11).Gallo J; Long NJ; Aboagye EO Magnetic Nanoparticles as Contrast Agents in the Diagnosis and Treatment of Cancer. Chem. Soc. Rev 2013, 42, 7816–7833. [DOI] [PubMed] [Google Scholar]
- (12).Chen H; Zhen Z; Todd T; Chu PK; Xie J Nanoparticles for Improving Cancer Diagnosis. Mater. Sci. Eng., R 2013, 74, 35–69. [DOI] [PMC free article] [PubMed] [Google Scholar]
- (13).Zhu J; Zhao L; Cheng Y; Xiong Z; Tang Y; Shen M; Zhao J; Shi X Radionuclide 131I-Labeled Multifunctional Dendrimers for Targeted SPECT Imaging and Radiotherapy of Tumors. Nanoscale 2015, 7, 18169–18178. [DOI] [PubMed] [Google Scholar]
- (14).Xing Y; Zhao J; Conti PS; Chen K Radiolabeled Nanoparticles for Multimodality Tumor Imaging. Theranostics 2014, 4, 290–306. [DOI] [PMC free article] [PubMed] [Google Scholar]
- (15).Ray PC Size and Shape Dependent Second Order Nonlinear Optical Properties of Nanomaterials and Their Application in Biological and Chemical Sensing. Chem. Rev 2010, 110, 5332–5365. [DOI] [PMC free article] [PubMed] [Google Scholar]
- (16).Wu C; Bull B; Christensen K; McNeill J Ratiometric Single-Nanoparticle Oxygen Sensors for Biological Imaging. Angew. Chem., Int. Ed 2009, 48, 2741–2745. [DOI] [PMC free article] [PubMed] [Google Scholar]
- (17).Kim JH; Heller DA; Jin H; Barone PW; Song C; Zhang J; Trudel LJ; Wogan GN; Tannenbaum SR; Strano MS The Rational Design of Nitric Oxide Selectivity in Single-walled Carbon Nanotube Near-Infrared Fluorescence Sensors for Biological Detection. Nat. Chem 2009, 1, 473–481. [DOI] [PubMed] [Google Scholar]
- (18).Baptista P; Pereira E; Eaton P; Doria G; Miranda A; Gomes I; Quaresma P; Franco R Gold Nanoparticles for the Development of Clinical Diagnosis Methods. Anal. Bioanal. Chem 2008, 391, 943–950. [DOI] [PubMed] [Google Scholar]
- (19).Liu G; Lin YY; Wang J; Wu H; Wai CM; Lin Y Disposable Electrochemical Immunosensor Diagnosis Device Based on Nanoparticle Probe and Immunochromatographic Strip. Anal. Chem 2007, 79, 7644–7653. [DOI] [PubMed] [Google Scholar]
- (20).Goel S; England CG; Chen F; Cai W Positron Emission Tomography and Nanotechnology: A Dynamic Duo for Cancer Theranostics. Adv. Drug Delivery Rev 2017, 113, 157–176. [DOI] [PMC free article] [PubMed] [Google Scholar]
- (21).Chakravarty R; Goel S; Dash A; Cai W Radiolabeled Inorganic Nanoparticles for Positron Emission Tomography Imaging of Cancer: An Overview. Q. J. Nucl. Med. Mol. Imaging 2017, 61, 181–204. [DOI] [PMC free article] [PubMed] [Google Scholar]
- (22).Abou DS; Pickett JE; Thorek DL Nuclear Molecular Imaging with Nanoparticles: Radiochemistry, Applications and Translation. Br. J. Radiol 2015, 88, No. 20150185. [DOI] [PMC free article] [PubMed] [Google Scholar]
- (23).Ma W; Fu F; Zhu J; Huang R; Zhu Y; Liu Z; Wang J; Conti PS; Shi X; Chen K 64Cu-Labeled Multifunctional Dendrimers for Targeted Tumor PET Imaging. Nanoscale 2018, 10, 6113–6124. [DOI] [PMC free article] [PubMed] [Google Scholar]
- (24).Wang Y; Liu Y; Luehmann H; Xia X; Brown P; Jarreau C; Welch M; Xia Y Evaluating the Pharmacokinetics and In Vivo Cancer Targeting Capability of Au Nanocages by Positron Emission Tomography imaging. ACS Nano 2012, 6, 5880–5888. [DOI] [PMC free article] [PubMed] [Google Scholar]
- (25).Iyer AK; He J; Amiji MM Image-Guided Nanosystems for Targeted Delivery in Cancer Therapy. Curr. Med. Chem 2012, 19, 3230–3240. [DOI] [PMC free article] [PubMed] [Google Scholar]
- (26).Zhu J; Xiong Z; Shen M; Shi X Encapsulation of Doxorubicin within Multifunctional Gadolinium-Loaded Dendrimer Nanocomplexes for Targeted Theranostics of Cancer Cells. RSC Adv. 2015, 5, 30286–30296. [Google Scholar]
- (27).Park YC; Paulsen J; Nap RJ; Whitaker RD; Mathiyazhagan V; Song YQ; Hurlimann M; Szleifer I; Wong JY Adsorption of Superparamagnetic Iron Oxide Nanoparticles on Silica and Calcium Carbonate Sand. Langmuir 2014, 30, 784–792. [DOI] [PubMed] [Google Scholar]
- (28).Pal M; Rakshit R; Mandal K Surface Modification of MnFe2O4 Nanoparticles to Impart Intrinsic Multiple Fluorescence and Novel Photocatalytic Properties. ACS Appl. Mater. Interfaces 2014, 6, 4903–4910. [DOI] [PubMed] [Google Scholar]
- (29).Lim EK; Kang B; Choi Y; Jang E; Han S; Lee K; Suh JS; Haam S; Huh YM Gadolinium-Based Nanoparticles for Highly Efficient T1-Weighted Magnetic Resonance Imaging. Nanotechnology 2014, 25, No. 245103. [DOI] [PubMed] [Google Scholar]
- (30).Kim T; Momin E; Choi J; Yuan K; Zaidi H; Kim J; Park M; Lee N; McMahon MT; Quinones-Hinojosa A; Bulte JW; Hyeon T; Gilad AA Mesoporous Silica-Coated Hollow Manganese Oxide Nanoparticles as Positive T1 Contrast Agents for Labeling and MRI Tracking of Adipose-Derived Mesenchymal Stem Cells. J. Am. Chem. Soc 2011, 133, 2955–2961. [DOI] [PMC free article] [PubMed] [Google Scholar]
- (31).Deng R; Xie X; Vendrell M; Chang YT; Liu X Intracellular Glutathione Detection Using MnO2-Nanosheet-Modified Upconversion Nanoparticles. J. Am. Chem. Soc 2011, 133, 20168–20171. [DOI] [PubMed] [Google Scholar]
- (32).Baek MJ; Park JY; Xu W; Kattel K; Kim HG; Lee EJ; Patel AK; Lee JJ; Chang Y; Kim TJ; Bae JE; Chae KS; Lee GH Water-Soluble MnO Nanocolloid for a Molecular T1 MR Imaging: A Facile One-Pot Synthesis, In Vivo T1 MR Images, and Account for Relaxivities. ACS Appl. Mater. Interfaces 2010, 2, 2949–2955. [DOI] [PubMed] [Google Scholar]
- (33).Zhou B; Zheng L; Peng C; Li D; Li J; Wen S; Shen M; Zhang G; Shi X Synthesis and Characterization of PEGylated Polyethylenimine-Entrapped Gold Nanoparticles for Blood Pool and Tumor CT Imaging. ACS Appl. Mater. Interfaces 2014, 6, 17190– 17199. [DOI] [PubMed] [Google Scholar]
- (34).Appelhans D; Komber H; Quadir MA; Richter S; Schwarz S; van der Vlist J; Aigner A; Muller M; Loos K; Seidel J; Arndt KF; Haag R; Voit B Hyperbranched PEI with Various Oligosaccharide Architectures: Synthesis, Characterization, ATP Complexation, and Cellular Uptake Properties. Biomacromolecules 2009, 10, 1114–1124. [DOI] [PubMed] [Google Scholar]
- (35).Li J; Zheng L; Cai H; Sun W; Shen M; Zhang G; Shi X Polyethyleneimine-Mediated Synthesis of Folic Acid-targeted Iron Oxide Nanoparticles for In Vivo Tumor MR Imaging. Biomaterials 2013, 34, 8382–8392. [DOI] [PubMed] [Google Scholar]
- (36).Zhao J; Lu C; He X; Zhang X; Zhang W; Zhang X Polyethylenimine-Grafted Cellulose Nanofibril Aerogels as Versatile Vehicles for Drug Delivery. ACS Appl. Mater. Interfaces 2015, 7, 2607– 2615. [DOI] [PubMed] [Google Scholar]
- (37).Han HD; Byeon Y; Jeon HN; Shin BC Enhanced Localization of Anticancer Drug in Tumor Tissue Using Polyethylenimine-Conjugated Cationic Liposomes. Nanoscale Res. Lett 2014, 9, No. 209. [DOI] [PMC free article] [PubMed] [Google Scholar]
- (38).Luo Y; Yang J; Li J; Yu Z; Zhang G; Shi X; Shen M Facile Synthesis and Functionalization of Manganese Oxide Nanoparticles for Targeted T1-Weighted Tumor MR Imaging. Colloids Surf., B 2015, 136, 506–513. [DOI] [PubMed] [Google Scholar]
- (39).Li ZB; Chen K; Wu Z; Wang H; Niu G; Chen X 64Cu-Labeled PEGylated Polyethylenimine for Cell Trafficking and Tumor Imaging. Mol. Imaging Biol 2009, 11, 415–423. [DOI] [PubMed] [Google Scholar]
- (40).Li J; Zheng L; Cai H; Sun W; Shen M; Zhang G; Shi X Facile One-pot Synthesis of Fe3O4@Au Composite Nanoparticles for Dual-Mode MR/CT Imaging Applications. ACS Appl. Mater. Interfaces 2013, 5, 10357–10366. [DOI] [PubMed] [Google Scholar]
- (41).Zhu J; Zheng L; Wen S; Tang Y; Shen M; Zhang G; Shi X Targeted Cancer Theranostics Using Alpha-Tocopheryl Succinate-Conjugated Multifunctional Dendrimer-Entrapped Gold Nanoparticles. Biomaterials 2014, 35, 7635–7646. [DOI] [PubMed] [Google Scholar]
- (42).Li G; Wang X; Zong S; Wang J; Conti PS; Chen K MicroPET Imaging of CD13 Expression Using a 64Cu-Labeled Dimeric NGR Peptide Based on Sarcophagine Cage. Mol. Pharmaceutics 2014, 11, 3938–3946. [DOI] [PubMed] [Google Scholar]
- (43).Avcıbaş U; Demiroglu H; Ediz M; Akalin HA; Ozcaliskan E; Senay H; Turkcan C; Ozcan Y; Akgol S; Avcibasi N Radiolabeling of New Generation Magnetic poly(HEMA-MAPA) Nanoparticles with 131I and Preliminary Investigation of its Radio-pharmaceutical Potential Using Albino Wistar Rats. J. Labelled Compd. Radiopharm 2013, 56, 708–716. [DOI] [PubMed] [Google Scholar]
- (44).Zhang P; Zhan Y; Cai B; Hao C; Wang J; Liu C; Meng Z; Yin Z; Chen Q Shape-Controlled Synthesis of Mn3O4 Nanocrystals and Their Catalysis of the Degradation of Methylene Blue. Nano Res. 2010, 3, 235–243. [Google Scholar]
- (45).Han YF; Chen F; Zhong Z; Ramesh K; Chen L; Widjaja E Controlled Synthesis, Characterization, and Catalytic Properties of Mn2O3 and Mn3O4 Nanoparticles Supported on Mesoporous Silica SBA-15. J. Phys. Chem. B 2006, 110, 24450–24456. [DOI] [PubMed] [Google Scholar]
- (46).Wen S; Li K; Cai H; Chen Q; Shen M; Huang Y; Peng C; Hou W; Zhu M; Zhang G; Shi X Multifunctional Dendrimer-Entrapped Gold Nanoparticles for Dual Mode CT/MR Imaging Applications. Biomaterials 2013, 34, 1570–1580. [DOI] [PubMed] [Google Scholar]
- (47).Liu H; Xu Y; Wen S; Chen Q; Zheng L; Shen M; Zhao J; Zhang G; Shi X Targeted Tumor Computed Tomography Imaging Using Low-Generation Dendrimer-Stabilized Gold Nanoparticles. Chem. - Eur. J 2013, 19, 6409–6416. [DOI] [PubMed] [Google Scholar]
- (48).Zhan Y; Shi S; Ehlerding EB; Graves SA; Goel S; Engle JW; Liang J; Tian J; Cai W Radiolabeled, Antibody-Conjugated Manganese Oxide Nanoparticles for Tumor Vasculature Targeted Positron Emission Tomography and Magnetic Resonance Imaging. ACS Appl. Mater. Interfaces 2017, 9, 38304–38312. [DOI] [PMC free article] [PubMed] [Google Scholar]
- (49).Ross JF; Chaudhuri PK; Ratnam M Differential Regulation of Folate Receptor Isoforms in Normal and Malignant Tissues In Vivo and in Established Cell Lines. Physiologic and clinical implications. Cancer 1994, 73, 2432–2443. [DOI] [PubMed] [Google Scholar]
- (50).Campbell IG; Jones TA; Foulkes WD; Trowsdale J Folate-Binding Protein is a Marker for Ovarian Cancer. Cancer Res. 1991, 51, 5329–5338. [PubMed] [Google Scholar]
- (51).Lu YJ; Wei KC; Ma CC; Yang SY; Chen JP Dual Targeted Delivery of Doxorubicin to Cancer Cells Using Folate-Conjugated Magnetic Multi-Walled Carbon Nanotubes. Colloids Surf., B 2012, 89, 1–9. [DOI] [PubMed] [Google Scholar]
- (52).Yao H; Ng SS; Tucker WO; Tsang YK; Man K; Wang XM; Chow BK; Kung HF; Tang GP; Lin MC The Gene Transfection Efficiency of a Folate-PEI600-Cyclodextrin Nanopolymer. Biomaterials 2009, 30, 5793–5803. [DOI] [PubMed] [Google Scholar]
- (53).Peng C; Zheng L; Chen Q; Shen M; Guo R; Wang H; Cao X; Zhang G; Shi X PEGylated Dendrimer-Entrapped Gold Nanoparticles for In Vivo Blood Pool and Tumor Imaging by Computed Tomography. Biomaterials 2012, 33, 1107–1119. [DOI] [PubMed] [Google Scholar]
- (54).Wang H; Zheng L; Peng C; Guo R; Shen M; Shi X; Zhang G Computed Tomography Imaging of Cancer Cells Using Acetylated Dendrimer-Entrapped Gold Nanoparticles. Biomaterials 2011, 32, 2979–2988. [DOI] [PubMed] [Google Scholar]
Associated Data
This section collects any data citations, data availability statements, or supplementary materials included in this article.


