

Abstract
Primary liver cancer, the major histology of which is hepatocellular carcinoma (HCC), is the second leading cause of cancer death worldwide. We comprehensively examined recent international trends of primary liver cancer and HCC incidence using population-based cancer registry data. Incidence for all primary liver cancer and for HCC by calendar time and birth cohort was examined for selected countries between 1978 and 2012. For each successive 5-year period, age-standardized incidence rates were calculated from Volumes V to XI of the Cancer Incidence in Five Continents (CI5) series using the online electronic databases, CI5plus. Large variations persist in liver cancer incidence globally. Rates of liver cancer remain highest in Asian countries, specifically in the East and South-East, and Italy. However, rates in these high-risk countries have been decreasing in recent years. Rates in India and in most countries of Europe, the Americas, and Oceania are rising. As the population seroprevalence of hepatitis B virus (HBV) continues to decline, we anticipate rates of HCC in many high-risk countries will continue to decrease. Treatment of hepatitis C virus (HCV) is likely to bring down rates further in some high-rate, as well as low-rate, countries with access to effective therapies. However, such gains in the control of liver cancer risk are at risk of being reversed by the growing obesity and diabetes epidemics, suggesting diabetes treatment and primary prevention of obesity will be key in reducing liver cancer in the longer-term.
Keywords: liver cancer, incidence rates, cancer registry, epidemiology
Introduction
Primary liver cancer was the seventh most commonly occurring cancer in 2018, and the second most common cause of cancer mortality worldwide [1]. Hepatocellular carcinoma (HCC) is the dominant histologic type of liver cancer in most countries, accounting for approximately 75% of total cases [2]. HCC usually develops on a background of oxidative stress and inflammation, triggered by chronic infection with hepatitis B or C virus (HBV or HCV), aflatoxin exposure, excess alcohol consumption, obesity, diabetes, and smoking.
Approximately 72% of all liver cancer arises in Asia, with China accounting for 47% of the world’s burden. According to 2018 estimates from GLOBOCAN, the highest estimated incidence rate in the world occurs in Mongolia, with an age-standardized rate (ASR) of 93.7 per 100,000 persons of (117.0 in males and 74.1 in females). The lowest estimated incidence rates in the world are estimated to occur in Nepal and Morocco, with an ASR of 1.1 (1.4-1.5 in males and 0.8-0.9 in females) [1].
Recent reports have noted that liver cancer mortality and incidence has been increasing in many areas of the world and declining in some Asian countries [3, 4, 5]. The incidence reports, however, have been based on estimated, rather than observed, rates, and the estimated incidence rates are frequently based on mortality data which are not rigorously verified. Additionally, as the liver is a common site of metastasis from other organs, use of mortality data will result in misclassification of metastatic tumors as primary liver cancer cases [6]. No recent reports have examined observed liver cancer incidence rates and trends [6, 7, 8]. Risk factors for liver cancer are currently in transition, with prevalence of HBV and HCV declining and obesity and diabetes increasing in many regions [9]. Thus, it is imperative to examine the trends in observed liver cancer incidence via examination of high-quality population-based cancer registry data. To report the most recent international trends, we examined the incidence of liver cancer and of HCC for the 35-year period from 1978 through 2012, using cancer registry data from the International Agency for Cancer Research’s Cancer Incidence in Five Continents (CI5) database.
Methods
We examined temporal trends in liver cancer incidence using registry data from CI5 Volumes V-XI [10], CI5plus [11], and the NORDCAN database [12]. As described previously [13], the evaluation of the quality of data from registries that submit to CI5 involves an assessment of comparability (e.g., standardized classifications for new cases and ability to compare to different population groups), completeness (e.g., case finding procedures), validity/accuracy (e.g., precision of source documents, expertise of registrars), and timeliness with regards to rapidity of reporting [14]. We used CI5plus to obtain data from 1978 to 2012. Data from registries not included in the CI5plus database were obtained from previous CI5 volumes, from Volume V (1978-1982) to Volume XI (2008-2012).
Registries were eligible for analysis if included in at least 3 prior CI5 volumes (15 consecutive years), in addition to inclusion in Volume XI or CI5plus years 2008-2012, the most recent time period available, as a measure of each registry’s data quality over time [8]. A total of 42 countries were included. Of these, 19 countries contributed national-level data to the analysis. The NORDCAN database of Nordic country cancer statistics was utilized to obtain incidence rates for Finland and Sweden for 2008-2012, as these countries discontinued data submissions to the CI5 databases after Volume X [12]. For other countries, subnational registry data were aggregated, if available, to obtain an estimate of national incidence (Supplemental Table S1).
Trends in primary liver cancer incidence for each country were tabulated and plotted from 1978-1982 through 2008-2012 at the midpoint of each 5-year time interval on a semi-log scale to facilitate comparisons of current rates and temporal trends across registries and countries [15]. Rates were age-adjusted to the world standard population [16]. To examine the change in age-adjusted incidence rates over time, the annual percent change (APC) and average annual percent change (AAPC) was calculated using a joinpoint regression model of the natural log-transformed rates based on each 5-year period [17]. Countries with data from 1978 through 2012, or all seven 5-year periods, were tested for whether a second joinpoint trend was appropriate.
Incidence rates by sex and subset to HCC histology were calculated from the CI5 databases. To examine the sex differences in incidence rates within each country, the rates among males and females were plotted and the male-to-female (M:F) ratio was calculated. HCC was identified by International Classification of Diseases for Oncology, third edition (ICD-O-3) morphology codes 8170-8175 and 8576, regardless of basis of diagnosis [18]. Age-adjusted incidence rates of all primary liver cancer and HCC were plotted by calendar time and percentage of all primary liver cancers classified as HCC was calculated.
Birth cohort trends were examined in countries with high quality data from Europe, Asia, and the Americas. Birth cohort rates were calculated by subtracting the midpoints of 5-year age groups from the corresponding 1-year calendar periods [8]. The observed incidence rates by birth cohort and age were plotted on a semi-log scale and were used to fit the age-period-cohort models, with the assumption that that incidence rates were constant within age classes and periods of diagnosis [19]. Cohort effects were estimated with incidence rate ratios presented relative to the reference cohort (1940).
As supplementary analyses, we plotted the age-adjusted country-specific rates from Volume XI or CI5plus years 2008-2012 against the AAPC on an arithmetic scale to visually represent the trends and magnitude of incidence rates by country.
Data management and analyses were performed using SAS software (v9.4, SAS Institute Inc., Cary, NC). Figures were plotted using SigmaPlot (v12.5, SY Software Inc., San José, CA). Joinpoint models were examined using the Joinpoint Regression Program (v4.6.0.0, IMS, Inc., Calverton, MD).
Data Availability.
For this study, we utilized liver cancer incidence from publically available cancer registry data: CI5 Volumes V-XI [10], CI5plus [11], and the NORDCAN database [12].
Results
Between 2008 and 2012, liver cancer incidence rates were highest in Eastern and South-Eastern Asian countries and lowest in South-Western Asia and Northern European countries (Table 1). The highest rates of liver cancer occurred in South Korea (ASR=20.4) and Thailand (ASR=20.4). Outside of Asia, the highest rates occurred in Uganda (ASR=8.1), Italy (ASR=9.8), and France (ASR=7.1). The lowest rates were seen in the Netherlands (ASR=1.8) and Israel (ASR=1.9). However, rates were heterogeneous within regions, ranging in Western Europe, for example, from 1.8 in the Netherlands to 7.1 in France.
Table 1.
Age-adjusted liver cancer incidence rates per 100,000 person-years (1978-1982 and 2008-2012).
| Population | Number of Registries Included |
1978-1982 |
2008-2012 |
Trend 1 | Trend 2 | Joinpoint | AAPC | AAPC 95% CI | ||||
|---|---|---|---|---|---|---|---|---|---|---|---|---|
| Cases | Rate | 95% CI | Cases | Rate | 95% CI | APC (%) | APC (%) | (%) | ||||
| Africa | ||||||||||||
| Uganda | 1 | 365 | 8.1 | (7.0, 9.1) | 2.6 | 2.6 | (−3.8, 9.5) | |||||
| Eastern Asia | ||||||||||||
| China | 2 | 17,579 | 13.5 | (13.3, 13.7) | −1.9* | −1.9* | (−2.3, −1.4) | |||||
| Japan | 3 | 9,485 | 16.2 | (15.9, 16.6) | 23,325 | 14.3 | (14.1, 14.5) | 2.5 | −4.0* | 1995 | −0.8 | (−1.8, 0.2) |
| Korea | 1 | 14,243 | 20.4 | (20.0, 20.7) | −2.2* | −2.2* | (−3.2, −1.2) | |||||
| South-Eastern Asia | ||||||||||||
| Phillipines | 1 | 2,331 | 8.8 | (8.4, 9.2) | −1.7* | −1.7* | (−2.7, −0.6) | |||||
| Thailand | 1 | 2,381 | 20.4 | (19.5, 21.3) | 2.3* | 2.3* | (0.2, 4.4) | |||||
| South-Western Asia | ||||||||||||
| India | 2 | 2,745 | 3.0 | (2.9, 3.2) | 1.7* | 1.7* | (1.2, 2.1) | |||||
| Israel | 1 | 495 | 2.0 | (1.8, 2.2) | 1,026 | 1.9 | (1.8, 2.1) | −1.7 | −1.7 | (−4.3, 0.9) | ||
| Kuwait | 1 | 26 | 2.6 | (1.5, 3.6) | 142 | 4.1 | (3.4, 4.8) | −0.5 | −0.5 | (−2.7, 1.8) | ||
| Central and Eastern Europe | ||||||||||||
| Belarus | 1 N | 2,007 | 2.6 | (2.4, 2.7) | −0.8 | −0.8 | (−2.3, 0.7) | |||||
| Czech Republic | 1 N | 4,546 | 4.3 | (4.2, 4.5) | −0.3 | −0.3 | (−0.9, 0.3) | |||||
| Poland | 1 | 280 | 2.2 | (1.9, 2.5) | −2.6 | −2.6 | (−7.3, 2.4) | |||||
| Slovakia | 1 N | 1,202 | 3.8 | (3.5, 4.0) | 1,266 | 4.9 | (4.6, 5.2) | −0.1* | 2.4* | 2000 | 0.7* | (0.7, 0.7) |
| North-Western Europe | ||||||||||||
| Denmark | 1 N | 1,201 | 2.7 | (2.6, 2.9) | 1,797 | 3.4 | (3.2, 3.5) | −0.4* | 3.2* | 2000 | 0.8* | (0.7, 0.8) |
| Iceland | 1 N | 33 | 2.3 | (1.5, 3.1) | 72 | 2.8 | (2.1, 3.5) | 0.7 | 0.7 | (−1.9, 3.4) | ||
| Ireland | 1 N | 1,080 | 3.2 | (3.0, 3.4) | 6.7* | 6.7* | (6.2, 7.2) | |||||
| Norway | 1 N | 418 | 1.3 | (1.1, 1.4) | 939 | 2.1 | (1.9, 2.2) | −0.7 | 3.4 | 1995 | 1.4 | (−0.1, 2.9) |
| Sweden1 | 1 N | 3,063 | 3.6 | (3.4, 3.7) | 2,820 | 3.1 | (2.9, 3.2) | −0.9 | −0.9 | (−2.5, 0.7) | ||
| United Kingdom | 20,844 | 3.4 | (3.4, 3.5) | 4.4* | 4.4* | (3.9, 4.9) | ||||||
| North-Eastern Europe | ||||||||||||
| Estonia | 1 N | 475 | 3.4 | (3.0, 3.7) | 0.8* | 0.8* | (0.1, 1.4) | |||||
| Finland1 | 1 N | 1,043 | 3.0 | (2.8, 3.2) | 2,481 | 3.9 | (3.7, 4.1) | 0.7 | 0.7 | (−0.5, 1.8) | ||
| Latvia | 1 N | 439 | 3.4 | (3.1, 3.8) | 1.7* | 1.7* | (0.6, 2.8) | |||||
| Lithuania | 1 N | 992 | 3.2 | (3.0, 3.4) | 1.9* | 1.9* | (0.3, 3.5) | |||||
| Southern Europe | ||||||||||||
| Croatia | 1 N | 2,518 | 5.4 | (5.1, 5.6) | 2.2 | 2.2 | (−1.0, 5.4) | |||||
| Italy | 2 | 270 | 5.2 | (4.6, 5.9) | 934 | 9.8 | (9.0, 10.5) | 5.2* | −2.6 | 2000 | 2.5* | (0.9, 4.1) |
| Malta | 1 N | 103 | 2.5 | (2.0, 3.1) | 3.8 | 3.8 | (−0.3, 8.1) | |||||
| Slovenia | 1 N | 833 | 3.9 | (3.6, 4.2) | 4.1* | 4.1* | (2.2, 6.0) | |||||
| Spain | 2 | 214 | 3.8 | (3.3, 4.4) | 467 | 5.8 | (5.2, 6.4) | 1.9* | 1.9* | (0.9, 2.9) | ||
| Western Europe | ||||||||||||
| Austria | 1 N | 298 | 4.3 | (3.8, 4.8) | 2.6 | 2.6 | (−0.9, 6.3) | |||||
| France | 4 | 436 | 2.9 | (2.6, 3.2) | 2,227 | 7.1 | (6.8, 7.5) | 5.5* | 0.8 | 1995 | 3.1* | (2.1, 4.1) |
| Germany | 1 | 235 | 2.6 | (2.2, 2.9) | 633 | 5.4 | (4.9, 5.9) | 2.8* | 2.8* | (2.1, 3.6) | ||
| The Netherlands | 1 N | 2,675 | 1.8 | (1.7, 1.9) | 2.4* | 2.4* | (0.2, 4.7) | |||||
| Switzerland | 3 | 369 | 4.0 | (3.6, 4.5) | 769 | 6.2 | (5.7, 6.6) | 1.9* | 1.9* | (1.1, 2.7) | ||
| North America | ||||||||||||
| Canada | 8 | 1,527 | 1.4 | (1.3, 1.5) | 8,189 | 3.8 | (3.7, 3.9) | 3.4* | 3.4* | (2.9, 3.9) | ||
| Costa Rica | 1 N | 54 | 2.9 | (2.0, 3.7) | 777 | 3.6 | (3.3, 3.9) | 1.4* | 1.4* | (0.2, 2.7) | ||
| Puerto Rico | 1 N | 382 | 2.3 | (2.1, 2.6) | 1,705 | 5.0 | (4.7, 5.2) | 3.2* | 3.2* | (1.8, 4.5) | ||
| United States2 | 1 | 2,539 | 1.8 | (1.8, 1.9) | 13,130 | 5.8 | (5.7, 5.9) | 4.0* | 4.0* | (3.9, 4.2) | ||
| South America | ||||||||||||
| Brazil | 1 | 221 | 3.4 | (3.0, 3.9) | 2.1 | 2.1 | (−7.6, 12.8) | |||||
| Colombia | 1 | 470 | 3.9 | (3.5, 4.3) | 2.8* | 2.8* | (2.1, 3.6) | |||||
| Ecuador | 1 | 417 | 4.2 | (3.7, 4.7) | 2.6* | 2.6* | (0.8, 4.3) | |||||
| Oceania | ||||||||||||
| Australia | 5 | 6,291 | 4.3 | (4.2, 4.4) | 4.9* | 4.9* | (4.4, 5.3) | |||||
| New Zealand | 1 N | 1,413 | 4.1 | (3.8, 4.3) | 3.4* | 3.4* | (2.9, 4.0) | |||||
Statistically significant at the 0.05 level
Registry contributed national level data
Data provided by the NORDCAN database for years 2008-2012
Includes SEER 9 registries (Atlanta, Connecticut, Detroit, Hawaii, Iowa, New Mexico, San Fransisco-Oakland, Seattle-Puget Sound, and Utah)
Sex differences were observed in almost all countries with the incidence rates of liver cancer in males being two to three-fold higher than in females (Figure 1). Notable exceptions to this include several countries in Africa and the Americas, including Uganda (M:F ratio=1.1), Costa Rica (M:F ratio=1.6), Ecuador (M:F ratio=1.0), and Colombia (M:F ratio=1.6). The greatest variability in incidence between sexes was observed in European countries, where some countries had male rates five times higher than those among females (e.g., France M:F ratio=5.0 and Malta M:F ratio=4.8). In contrast, the sex ratios in China and Thailand, both high-risk populations, were between 3.0 and 3.5.
Figure 1.

Age-adjusted male and female liver cancer incidence rates by country, 2008-2012. Age-adjusted to the world standard population.
As shown in Figure 2, notable decreases have occurred in some Eastern Asian (e.g., China, Japan, and South Korea), South-Eastern Asian (e.g., the Philippines), and Southern European (e.g., Italy) countries. Since 1978, incidence rates in six of the eight Asian countries examined decreased, with significant decreases in China (AAPC=−1.9%), South Korea (AAPC=−2.2%), and the Philippines (AAPC=−1.7%; Table 1 and Supplemental Figure S4). In Japan, a notable decline was also seen for the recent time period (1995-2012 APC=−4.0%). In Italy, rates have not significantly decreased, but a decline is noted for the most recent time period (2000-2012 APC=−2.6%). However, significant increases in incidence occurred in both Thailand (AAPC=2.3%) and India (AAPC=1.7%).
Figure 2.

Trends in liver cancer incidence rates by country, 1978-1982 through 2008-2012. Rates are per 100,000 person-years and age-adjusted to the world standard population.
In contrast to the declines in rates in Asia, liver cancer incidence rates increased in most countries (Figure 2). Rates across the Americas increased, with AAPCs ranging from 1.4% in Costa Rica to 4.0% in the US (Figure 2, Table 1). In Europe, incidence rates increased in most countries, with notable significant increases in Ireland (AAPC=6.7%), the UK (AAPC=4.4%), Slovenia (AAPC=4.1%), and France (AAPC=3.1%). In Oceania, incidence rates also notably increased (Australia AAPC=4.9%, New Zealand AAPC=3.4%).
Some rates in South-Western Asia (e.g., Israel), Central/Eastern Europe (e.g., Czech Republic and Poland), Southern Europe (e.g., Slovenia), Western Europe (e.g., France and Austria), and North America (e.g., Costa Rica) plateaued (Figure 2). For example, rates in France (1995-2012 APC=0.8%) stabilized (Table 1).
Overall, similar trends were observed between males and females. However, in Western Europe, rates in women plateaued in all countries examined (Austria, France, Germany, The Netherlands, and Switzerland), but rates in males continued to increase in Germany and The Netherlands. Similarly, rates in Colombia began to plateau for women but not men (Supplemental Figures S1 and S2). Additionally, rates of liver cancer significantly increased among males but remained relatively stable among females in Slovakia (male AAPC=1.1%, female AAPC=−0.1%), Denmark (male AAPC=1.2%, female AAPC=−0.6%), Finland (male AAPC=1.0%, female AAPC=−0.2%), and Malta (male AAPC=6.4%, female AAPC=−2.0%; Supplemental Tables S2 and S3).
HCC accounted for 60-80% of all microscopically-verified tumors in almost all countries examined (Figure 3, Table 2, and Supplemental Figure S3). The notable exception was Thailand, where HCC only accounted for 27% of liver cancers with microscopic verification. Additionally, while the incidence of primary liver cancer increased in Thailand, HCC incidence decreased sharply since 2000 (Figure 3).
Figure 3.
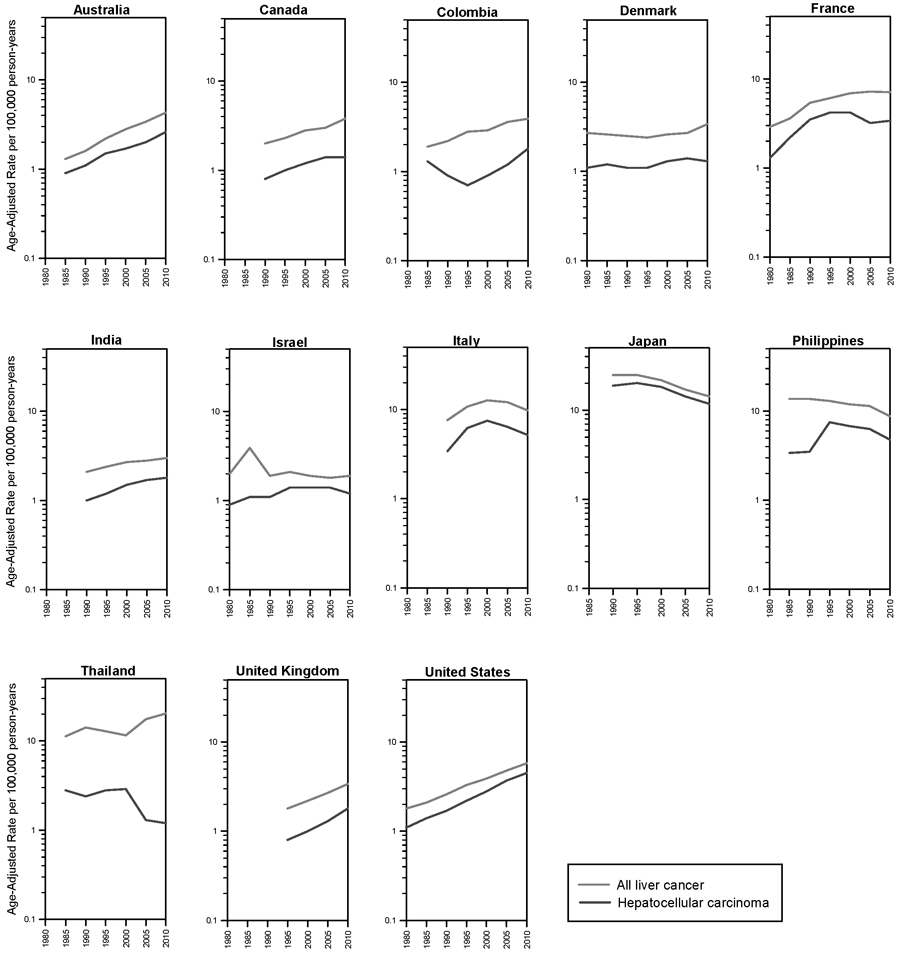
Trends in liver cancer incidence rates by calendar period for primary liver cancer and hepatocellular carcinoma, 1978-2012.
Table 2.
Hepatocellular carcinoma (HCC) cases by histologic or microscopic verification by country, 2008-2012.
| Population | Histologically Confirmed |
Microscopically Verified |
||||||
|---|---|---|---|---|---|---|---|---|
| HCC Cases | HCC Rate | Total HC LCs | % HCC of all HC LCs1 |
HCC Cases | HCC Rate | Total MV LCs | % HCC of all MV LCs1 |
|
| Africa | ||||||||
| Uganda | 180 | 3.8 | 365 | 49.32% | 106 | 2.3 | 138 | 76.81% |
| Eastern Asia | ||||||||
| China2 | 1,371 | 2.3 | 8,562 | 16.01% | 1,266 | 2.2 | 1,673 | 75.67% |
| Japan | 19,155 | 11.8 | 23,325 | 82.12% | 5,287 | 3.6 | 6,709 | 78.80% |
| Korea | 11,195 | 15.9 | 14,243 | 78.60% | 3,052 | 4.3 | 4,860 | 62.80% |
| South-Eastern Asia | ||||||||
| Phillipines | 1,259 | 4.8 | 2,331 | 54.01% | 864 | 3.2 | 1,068 | 80.90% |
| Thailand | 124 | 1.2 | 2,381 | 5.21% | 124 | 1.2 | 460 | 26.96% |
| South-Western Asia | ||||||||
| India3 | 1,613 | 1.8 | 2,745 | 58.76% | 1,555 | 1.7 | 2,549 | 61.00% |
| Israel | 606 | 1.2 | 1,026 | 59.06% | 468 | 1.0 | 621 | 75.36% |
| Kuwait | 122 | 3.6 | 142 | 85.92% | 110 | 3.2 | 127 | 86.61% |
| Central and Eastern Europe | ||||||||
| Czech Republic4 | 1,197 | 1.2 | 2,231 | 53.65% | ||||
| Slovakia | 540 | 2.1 | 1,266 | 42.65% | 496 | 2.0 | 880 | 56.36% |
| North-Western Europe | ||||||||
| Denmark | 725 | 1.3 | 1,797 | 40.35% | 700 | 1.3 | 1,134 | 61.73% |
| Iceland | 39 | 1.5 | 72 | 54.17% | 30 | 1.1 | 52 | 57.69% |
| Ireland | 398 | 1.2 | 1,080 | 36.85% | 322 | 1.0 | 584 | 55.14% |
| Norway | 493 | 1.1 | 939 | 52.50% | 412 | 0.9 | 606 | 67.99% |
| United Kingdom | 9,958 | 1.8 | 20,844 | 47.77% | 3,926 | 0.7 | 8,016 | 48.98% |
| North-Eastern Europe | ||||||||
| Estonia | 173 | 1.3 | 475 | 36.42% | 168 | 1.2 | 316 | 53.16% |
| Latvia4 | 78 | 0.7 | 165 | 47.27% | ||||
| Lithuania | 234 | 0.8 | 992 | 23.59% | 234 | 0.8 | 438 | 53.42% |
| Southern Europe | ||||||||
| Croatia | 1,007 | 2.3 | 2,518 | 39.99% | 1,007 | 2.3 | 1,448 | 69.54% |
| Italy | 492 | 5.2 | 934 | 52.68% | 227 | 2.7 | 322 | 70.50% |
| Malta | 26 | 0.6 | 103 | 25.24% | 24 | 0.6 | 76 | 31.58% |
| Slovenia | 319 | 1.6 | 833 | 38.30% | 318 | 1.6 | 440 | 72.27% |
| Spain | 246 | 3.2 | 467 | 52.68% | 155 | 2.1 | 244 | 63.52% |
| Western Europe | ||||||||
| Austria | 215 | 3.1 | 298 | 72.15% | 90 | 1.4 | 158 | 56.96% |
| France | 1,019 | 3.4 | 2,227 | 45.76% | 641 | 2.1 | 937 | 68.41% |
| Germany | 301 | 2.6 | 633 | 47.55% | 237 | 2.1 | 422 | 56.16% |
| The Netherlands | 1,224 | 0.8 | 2,675 | 45.76% | 1,224 | 0.8 | 1,823 | 67.14% |
| Switzerland | 292 | 2.4 | 769 | 37.97% | 286 | 2.4 | 390 | 73.33% |
| North America | ||||||||
| Canada4 | 3,013 | 1.4 | 4,750 | 63.43% | ||||
| Costa Rica | 202 | 1.1 | 777 | 26.00% | 200 | 1.1 | 322 | 62.11% |
| Puerto Rico4 | 650 | 2.0 | 1,011 | 64.29% | ||||
| United States | 10,174 | 4.5 | 13,130 | 77.49% | 5,895 | 2.6 | 8,017 | 73.53% |
| South America | ||||||||
| Brazil | 70 | 1.1 | 221 | 31.67% | 65 | 1.0 | 106 | 61.32% |
| Colombia | 210 | 1.8 | 470 | 44.68% | 183 | 1.5 | 308 | 59.42% |
| Ecuador | 167 | 1.7 | 417 | 40.05% | 142 | 1.5 | 219 | 64.84% |
| Oceania | ||||||||
| Australia | 3,655 | 2.6 | 6,291 | 58.10% | 2,259 | 1.6 | 3,350 | 67.43% |
| New Zealand | 934 | 2.8 | 1,413 | 66.10% | 383 | 1.2 | 565 | 67.79% |
Abbreviations: HCC, hepatocellular carcinoma; LC, liver cancers; HC, histologically confirmed; MV, microscopically verified
All liver cancers include any tumor reported at site code C22.0 that is HC (left columns) or MV (right columns)
Microscopic verification data unavailable for Hong Kong registry
Microscopic verification data unavailable for Mumbai registry
Histologic confirmation data unavailable
Trends in 5-year age-specific primary liver cancer and HCC rates were plotted by birth year for selected countries in Figure 4, and the incidence rate ratio is presented in Figure 5. Rates of HCC generally decreased in younger birth cohorts but began to plateau in the most recent birth cohorts. In Colombia, HCC rates were highest for individuals born in the 1940-1950s, while peak rates are seen in the US for individuals born between 1950 and 1965. In Japan, rates of HCC peaked in the 1925-1935 birth cohorts.
Figure 4.


Incidence rates per 100,000 person-years by year of birth for A) primary liver cancer and B) hepatocellular carcinoma from selected countries. For each graph, rates in the 5-year age groups 35-39, 40-44, …., 80-84 are plotted.
Figure 5.

Fitted liver cancer incidence: age-specific rates per 100,000 person-years (left) and incidence rate ratios by birth cohort (right) in selected countries. Incidence rate ratios are relative to the reference cohort, midpoint 1940.
As shown in Figure 5, the peak age at diagnosis for HCC did not vary widely by country. In most countries, peak incidence occurred near 75 years of age (Figure 5). Of the countries examined, Thailand had the youngest peak incidence of HCC at age 45 years. As histology information was not available for all years, rates of all primary liver cancer in China are shown in Supplemental Figure S5 and S6.
Discussion
During the 35 years examined, incidence rates of liver cancer remained elevated in many Asian countries, specifically in the Eastern and South-Eastern regions. However, the rates in the majority of these high-risk populations decreased in the most recent time period, while rates in low-risk countries, including India, and several countries in Europe, America, and Oceania increased.
Liver cancer incidence rates in males are two to three-fold higher than female rates in most areas of the world. It has been hypothesized that the higher rates in men could be due to higher prevalence of known liver cancer risk factors, including HBV, HCV, alcohol, and smoking, or differences in sex steroid hormones, immune responses, and/or epigenetic differences between men and women [20]. There are, however, exceptions to these well-documented sex differences in several countries in the Americas and Africa. In the current study, we see that in the cancer registries from Costa Rica, Colombia, Ecuador, and Uganda the M:F ratio ranges from 1.0-1.6. Reasons for the near equivalency in liver cancer rates between males and females in these countries is not clear but may suggest potential unidentified risk factors.
HCC trends were similar to primary liver cancer trends within all countries examined. The notable exception is Thailand, where rates of HCC declined, while rates of primary liver cancer increased since 2000. In Thailand, intrahepatic cholangiocarcinoma is the dominant type of liver cancer, and liver fluke infections are a major risk factor for intrahepatic cholangiocarcinoma [21].
In China, decreasing incidence rates, captured by downward trends in successive birth cohorts from the 1940s, are due to a multitude of factors. However, one of the key drivers of these declining rates was the aflatoxin abatement program [22, 23]. For instance, Qidong, which has some of the highest reported rates of liver cancer in the world, consumed maize as a primary dietary staple until 1985. At that time, a change in governmental policy permitted the dietary replacement of maize with rice, which led to a 40-fold reduction in aflatoxin-albumin adduct levels [22, 23]. Since 1985, rates of liver cancer have decreased substantially in males (1983-1987 ASR=89.9, 2008-2012 ASR=60.9, −32.3%) but more modestly in females (1983-1987 ASR=24.5, 2008-2012 ASR=21.5, −12.2%). Rates of liver cancer in the Philippines have been decreasing, likely due to decreasing aflatoxin levels, as food processing plants voluntarily began regulating aflatoxin as a quality control measure. From the Bureau of Food and Drugs monitoring survey, the prevalence of aflatoxin contaminated peanut products, for example, decreased from 38-72% in 1992 to 2-6% in 1997 [24].
Aflatoxin tends to co-occur in regions with endemic HBV infection, and the two factors together synergistically increase the risk of liver cancer. Thus, while aflatoxin abatement programs have reduced liver cancer rates in some high-risk areas, additional declines of HBV-related liver cancer among future birth cohorts will likely be due to neonatal HBV vaccination programs [22, 23]. HBV vaccination in Qidong was piloted in 1983-1984 and subsequently expanded. In 2002, GAVI, the Government of China, and the China Centre for Disease Control partnered to create the National Expanded Program of Immunization of China, which subsidized the vaccination for all newborns [22, 23]. In 2017, the coverage rate in newborns was >99.5% for all three doses of HBV vaccine [25]. Similar to China, the coverage rate for newborns in South Korea of all three HBV vaccination doses is high – 98% [25]. In contrast, the Philippines has a lower 3-dose coverage rate of 88% [25]. HBV vaccination is well-documented to be effective in preventing HBV infection and decreasing rates of HCC in children [26, 27]. However, it is too early to see effects of HBV vaccination on adult HCC rates, as the first newborns to receive vaccination are only in their thirties.
In South Korea, treatment of chronic HBV infections with nucleos(t)ide analogues has been available since 1999. Beginning in 2010, HBV carriers were eligible for life-long reimbursement [28], which has dramatically increased uptake [29]. While early studies of antivirals demonstrated reduced risk of HCC [30], the long-term efficacy is unclear. In South Korea, a death certificate study reported decreased rate of non-cancer liver disease mortality, but increased rate of liver cancer mortality between 1999 and 2013 [29]. This led the authors to speculate that nucleos(t)ide analogue therapy may increase the opportunity to develop HCC, because individuals with HBV infection are living longer [29].
The decreasing rates of HCC in Japan and Italy are likely due to a decline in HCV prevalence in these populations. Japanese cohorts born between 1925 and 1935 had an elevated risk of contracting HCV due to intravenous injections, including anti-schistosomal therapy and amphetamines, and blood product transfusions during the early decades of the twentieth century [31, 32]. Italy, particularly in the south, experienced a similar period of HCV iatrogenic transmission in the 1940s and 1950s. In contrast, another period of HCV transmission occurred in the 1970s and 1980s though intravenous drug use and was experienced to a greater extent in Northern Italy [33]. With the subsiding generational risk due to prior HCV epidemics, HCC rates in Japan and Italy are beginning to decline.
While the reasons for increasing incidence rates in many areas of the world can only be partially explained, HCV epidemics account for a portion of the increasing incidence. For example, in the US and Colombia, peak HCV transmission occurred in the 1970s and 1980s. It has been suggested that HCV prevalence in the US increased due to injection drug use [34], but more recent studies suggest that spread was more likely due to nosocomial transmission [35], as widespread screening of blood products did not begin until 1992 [36]. Persons born between 1945 and 1965 (known as “baby boomers” in the US) were particularly susceptible and have HCV prevalence of approximately 2.5% [34]. As the 1945-1965 birth cohorts age, the rates of HCC have also increased in the US. However, as observed in Japan where the HCV epidemic pre-dated the US epidemic by 20-30 years [31], overall US HCC rates should begin to decline in coming years as the baby boomers age. Additionally, almost all HCV infections are now potentially curable, and treatment with direct-acting antiviral (DAA) therapy is increasingly accessible in the US [37]. In Colombia in 2017, the Ministry of Health and Social Protection of Colombia began obtaining DAAs at an affordable price through the Pan American Health Organization Strategic Fund [38]. Thus, there may be further reductions in HCV-related HCC rates. However, the prevalence of HCV has recently increased in the US with the opioid epidemic, making HCV a continuing cause of concern [39].
While declines in liver cancer rates have been noted in many historically high-risk areas, the rising rates of obesity, diabetes and metabolic syndrome may offset the gains that have been made to date [40, 41]. For example, the rates of liver cancer have begun to plateau in the most recent birth cohorts in China. Urbanization and “Westernization” in many Asian countries have led to sedentary lifestyles and overnutrition, laying the groundwork for increasing rates of obesity [42]. In Asian populations, obesity-related complications, such as diabetes and non-alcoholic fatty liver disease, occur at lower levels of BMI than among populations of European ancestry [42, 43, 44]. This may be partially explained by Asians having greater central adiposity than person of European ancestry at similar BMIs [42]. In historically low-risk countries, such as the US, metabolic disorders are more prevalent than HBV or HCV. Thus, the proportion of liver cancer cases that are, in part, due to metabolic disorders (32.0%) is higher than HBV (4.3%) or HCV (20.5%) [45]. While the obesity epidemic has been longstanding in the US, obesity rates are increasing in both developed and developing countries. Worldwide in 2016, 39% of adults were classified as overweight and 13% were classified as obese [41]. Thus, obesity will be a problem for liver cancer prevention efforts for the foreseeable future.
Strengths of this study include the use of cancer registry data of actual incidence rates rather than estimated incidence rates, in specific, utilization of CI5plus data, which are drawn from high quality cancer registries throughout the world. Registries within countries were also combined to ensure robust measures of country-specific incidence. However, cancer registry data were still limited in many countries, and the rates were based on regional registries and may not be nationally representative (e.g., Thailand and Philippines). Additionally, for certain groups, including females and low-risk areas, these data were prone to random variation due to small case counts.
Use of cancer registry data also limits our ability to examine trends in Africa, which in 2018 was estimated to have the second highest age-standardized liver cancer rates (ASR=8.4) of any continent. In Egypt, there is a high burden of HCV-related HCC. In early 2018, Egypt announced a national plan to eradicate HCV by 2022 by testing the entire adult population and using DAA therapies to treat HCV(+) patients [46]. Additionally, a large proportion of the global HBV burden is in low and middle-income countries of sub-Saharan Africa. Many of these countries lack economic and healthcare resources to obtain access to screening, care and treatment for HBV infection [47], and fewer than 1% of HBV infections are diagnosed [48, 49]. Further, the HBV vaccination rate in sub-Saharan Africa remains under 10% [49]. Some countries, however, are making progress. Recently, Uganda and Senegal have offered tenofovir, a nucleos(t)ide analogue, at reduced or no cost. However, HBV will likely remain a problem in sub-Saharan Africa for the foreseeable future. Finally, sub-Saharan Africa has a high prevalence of aflatoxin B1, due to the dietary staple of maize [50]. Thus, due to the synergistic interaction of HBV and aflatoxin, there is an urgent need for effective HBV vaccination programs and/or aflatoxin abatement programs [51]. Further efforts and investment into African cancer registries will also be essential to improved cancer control and prevention.
There are several challenges and limitations related to coding and classification of HCC and, consequently, data quality and comparability. First, as the liver is a common site of metastasis from other organs, there is possibility of misclassification when coding a primary liver cancer without morphology information [6]. This is partly due to practices established during the use of the ninth revision of ICD (ICD-9) where the “unspecified” code 155.2 frequently used for coding the cause of death referred to “Liver, not specified as primary or secondary”. The ICD-10 code C22.9, “Liver, unspecified”, did not replace the previous code, but refers to primary liver cancer only. Possible misclassification is a concern for cancer registries with high proportions of death certificates without information on morphology (“death certificate only” cases) of liver cancer. However, the majority of cancer registries included herein had <5% of cases with death certificate only data. Additionally, the concordant trends of HCC and primary liver cancer observed in most countries suggest that there is little misclassification of metastasis. Secondly, as pathology confirmation is not required for HCC diagnosis [52, 53], a proportion of HCC cases will not be microscopically verified. As pathology confirmation is required for intrahepatic cholangiocarcinoma, the proportion of microscopically verified cases that are HCC is likely underestimated. Additionally, one of the ICD-O-3 morphology codes for HCC, 8170, is usually accepted without a microscopic confirmation [54], but some registries might be unaware of this rule and report only microscopically verified cases. For the purpose of completeness, we included all cases with HCC histology code in the HCC trends analysis, regardless of microscopic confirmation.
In summary, rates in many high-risk countries decreased, while rates in low-risk countries increased. The rates in the former populations may continue to decline, with reductions in the population seroprevalence of HBV, HCV, and aflatoxin exposure. However, these gains may be offset by the global looming epidemics of obesity, diabetes, and metabolic syndrome, which will be increasingly important drivers of future liver cancer trends worldwide.
Supplementary Material
Novelty and Impact: Liver cancer is the second leading cause of cancer death worldwide. In an analysis of liver cancer rates by country, the authors report that in many high-risk areas, liver cancer rates continue to decline. However, some of these gains in liver cancer risk reduction could be negatively affected by the growing obesity and diabetes epidemics, possibly preluded by plateauing rates in the most recent birth cohort in China and rising rates in historically low-risk countries, suggesting that treatment of diabetes and primary prevention of obesity will be key in reducing future liver cancer incidence.
Acknowledgements:
Where authors are identified as personnel of the International Agency for Research on Cancer / World Health Organization, the authors alone are responsible for the views expressed in this article and they do not necessarily represent the decisions, policy or views of the International Agency for Research on Cancer / World Health Organization.
Funding: This study was funded by the National Cancer Institute Intramural Research Program. PC Valery was supported by a NHMRC Career Development Fellowship (#1083090).
Abbreviations:
- AAPC
average annual percent change
- APC
annual percent change
- ASR
age-standardized rate
- CI5
Cancer Incidence in Five Continents
- DAA
direct-acting antiviral
- HBV
hepatitis B virus
- HCC
hepatocellular carcinoma
- HCV
hepatitis C virus
- ICD-O
International Classification of Diseases for Oncology
- M:F
male-to-female
Footnotes
Conflicts of Interest: None.
References
- 1.Bray F, Ferlay J, Soerjomataram I, Siegel RL, Torre LA, Jemal A. Global cancer statistics 2018: GLOBOCAN estimates of incidence and mortality worldwide for 36 cancers in 185 countries. CA Cancer J Clin 2018;68:394–424. [DOI] [PubMed] [Google Scholar]
- 2.Altekruse SF, Devesa SS, Dickie LA, McGlynn KA, Kleiner DE. Histological classification of liver and intrahepatic bile duct cancers in SEER registries. J Registry Manag 2011;38:201–5. [PMC free article] [PubMed] [Google Scholar]
- 3.Bertuccio P, Turati F, Carioli G, Rodriguez T, La Vecchia C, Malvezzi M, et al. Global trends and predictions in hepatocellular carcinoma mortality. J Hepatol 2017;67:302–9. [DOI] [PubMed] [Google Scholar]
- 4.Global Burden of Disease Liver Cancer , Akinyemiju T, Abera S, Ahmed M, Alam N, Alemayohu MA, et al. The Burden of Primary Liver Cancer and Underlying Etiologies From 1990 to 2015 at the Global, Regional, and National Level: Results From the Global Burden of Disease Study 2015. JAMA Oncol 2017;3:1683–91. [DOI] [PMC free article] [PubMed] [Google Scholar]
- 5.Liu Z, Jiang Y, Yuan H, Fang Q, Cai N, Suo C, et al. The trends in incidence of primary liver cancer caused by specific etiologies: Results from the Global Burden of Disease Study 2016 and implications for liver cancer prevention. J Hepatol 2019;70:674–83. [DOI] [PubMed] [Google Scholar]
- 6.McGlynn KA, Petrick JL, London WT. Chaper 33. Liver Cancer In: Thun MJ, Linet MS, Cerhan JR, Haiman C, Schottenfeld D, eds. Schottenfeld and Fraumeni cancer epidemiology and prevention. New York, NY: Oxford University Press, 2018:xix, 1308 pages. [Google Scholar]
- 7.Zhang Y, Ren JS, Shi JF, Li N, Wang YT, Qu C, et al. International trends in primary liver cancer incidence from 1973 to 2007. BMC Cancer 2015;15:94. [DOI] [PMC free article] [PubMed] [Google Scholar]
- 8.Petrick JL, Braunlin M, Laversanne M, Valery PC, Bray F, McGlynn KA. International trends in liver cancer incidence, overall and by histologic subtype, 1978–2007. Int J Cancer 2016;139:1534–45. [DOI] [PMC free article] [PubMed] [Google Scholar]
- 9.Petrick JL, McGlynn KA. The changing epidemiology of primary liver cancer. Curr Epidemiol Rep 2019;6:104–11. [DOI] [PMC free article] [PubMed] [Google Scholar]
- 10.Bray F, Colombet M, Mery L, Piñeros M, Znaor A, Zanetti R and Ferlay J, editors (2017). Cancer Incidence in Five Continents, Vol. XI (electronicversion). Lyon: International Agency for Research on Cancer; Available from: http://ci5.iarc.fr, accessed June 10, 2019. [Google Scholar]
- 11.Ferlay J, Colombet Mand Bray F. Cancer Incidence in Five Continents, CI5plus: IARC CancerBase No. 9[Internet]. Lyon, France: International Agency for Research on Cancer; 2018. Available from: http://ci5.iarc.fr, accessed June 10, 2019. [Google Scholar]
- 12.Danckert B, Ferlay J,Engholm G , Hansen HL, Johannesen TB, Khan S, Ktlum JE, Ólafsdóttir E, Schmidt LKH, Virtanen A and Storm HH. NORDCAN: Cancer Incidence, Mortality, Prevalenceand Survival in the Nordic Countries, Version 8.2 (26.03.2019). Association ofthe Nordic Cancer Registries. Danish Cancer Society. Available from http://www.ancr.nu, accessed on June 10, 2019. [Google Scholar]
- 13.Bray F, Parkin DM. Evaluation of data quality in the cancer registry: principles and methods. Part I: comparability, validity and timeliness. Eur J Cancer 2009;45:747–55. [DOI] [PubMed] [Google Scholar]
- 14.Parkin DM, Bray F. Evaluation of data quality in the cancer registry: principles and methods Part II. Completeness. Eur J Cancer 2009;45:756–64. [DOI] [PubMed] [Google Scholar]
- 15.Devesa SS, Donaldson J, Fears T. Graphical presentation of trends in rates. Am J Epidemiol 1995;141:300–4. [DOI] [PubMed] [Google Scholar]
- 16.Segi M, Fujisaku S, Kurihara M. Geographical observation on cancer mortality by selected sites on basis of standardised death rate. Gann 1957;48:219–25. [PubMed] [Google Scholar]
- 17.Kim HJ, Fay MP, Feuer EJ, Midthune DN. Permutation tests for joinpoint regression with applications to cancer rates. Stat Med 2000;19:335–51. [DOI] [PubMed] [Google Scholar]
- 18.Ferlay J, Rous B. Chapter 4: Histological groups In: Bray F, Colombet M, Mery L, Piñeros M, Znaor A, Zanetti R, et al. , eds. Cancer Incidence in Five Continents, Vol XI IARC Scientific Publication No 166. Lyon: International Agency for Research on Cancer, 2019. [Google Scholar]
- 19.Clayton D, Schifflers E. Models for temporal variation in cancer rates. I: Age-period and age-cohort models. Stat Med 1987;6:449–67. [DOI] [PubMed] [Google Scholar]
- 20.Dorak MT, Karpuzoglu E. Gender differences in cancer susceptibility: an inadequately addressed issue. Front Genet 2012;3:268. [DOI] [PMC free article] [PubMed] [Google Scholar]
- 21.Prueksapanich P, Piyachaturawat P, Aumpansub P, Ridtitid W, Chaiteerakij R, Rerknimitr R. Liver Fluke-Associated Biliary Tract Cancer. Gut Liver 2018;12:236–45. [DOI] [PMC free article] [PubMed] [Google Scholar]
- 22.Sun Z, Chen T, Thorgeirsson SS, Zhan Q, Chen J, Park JH, et al. Dramatic reduction of liver cancer incidence in young adults: 28 year follow-up of etiological interventions in an endemic area of China. Carcinogenesis 2013;34:1800–5. [DOI] [PMC free article] [PubMed] [Google Scholar]
- 23.Chen JG, Egner PA, Ng D, Jacobson LP, Munoz A, Zhu YR, et al. Reduced aflatoxin exposure presages decline in liver cancer mortality in an endemic region of China. Cancer Prev Res (Phila) 2013;6:1038–45. [DOI] [PMC free article] [PubMed] [Google Scholar]
- 24.Arim RH. Recent status of mycotoxin research in the Philippines. Mycotoxins 2000;50:23–6. [Google Scholar]
- 25.WHO vaccine-preventable diseases: monitoring system 2018 global summary. Third dose of hepatitis B vaccine. [Google Scholar]
- 26.Nelson NP, Easterbrook PJ, McMahon BJ. Epidemiology of Hepatitis B Virus Infection and Impact of Vaccination on Disease. Clin Liver Dis 2016;20:607–28. [DOI] [PMC free article] [PubMed] [Google Scholar]
- 27.Chang MH, You SL, Chen CJ, Liu CJ, Lai MW, Wu TC, et al. Long-term Effects of Hepatitis B Immunization of Infants in Preventing Liver Cancer. Gastroenterology 2016;151:472–80 e1. [DOI] [PubMed] [Google Scholar]
- 28.Kim BH, Park JW. Epidemiology of liver cancer in South Korea. Clin Mol Hepatol 2018;24:1–9. [DOI] [PMC free article] [PubMed] [Google Scholar]
- 29.Choi J, Han S, Kim N, Lim YS. Increasing burden of liver cancer despite extensive use of antiviral agents in a hepatitis B virus-endemic population. Hepatology 2017;66:1454–63. [DOI] [PubMed] [Google Scholar]
- 30.Sung JJ, Tsoi KK, Wong VW, Li KC, Chan HL. Meta-analysis: Treatment of hepatitis B infection reduces risk of hepatocellular carcinoma. Aliment Pharmacol Ther 2008;28:1067–77. [DOI] [PubMed] [Google Scholar]
- 31.Tanaka H, Imai Y, Hiramatsu N, Ito Y, Imanaka K, Oshita M, et al. Declining incidence of hepatocellular carcinoma in Osaka, Japan, from 1990 to 2003. Annals of internal medicine 2008;148:820–6. [DOI] [PubMed] [Google Scholar]
- 32.Tanaka Y, Hanada K, Mizokami M, Yeo AE, Shih JW, Gojobori T, et al. A comparison of the molecular clock of hepatitis C virus in the United States and Japan predicts that hepatocellular carcinoma incidence in the United States will increase over the next two decades. Proc Natl Acad Sci U S A 2002;99:15584–9. [DOI] [PMC free article] [PubMed] [Google Scholar]
- 33.Ansaldi F, Bruzzone B, Salmaso S, Rota MC, Durando P, Gasparini R, et al. Different seroprevalence and molecular epidemiology patterns of hepatitis C virus infection in Italy. J Med Virol 2005;76:327–32. [DOI] [PubMed] [Google Scholar]
- 34.Centers for Disease Control and Prevention. Recommendations for the Identification of Chronic Hepatitis C Virus Infection Among Persons Born During 1945–1965. MMWR 2012;61:6. [PubMed] [Google Scholar]
- 35.Joy JB, McCloskey RM, Nguyen T, Liang RH, Khudyakov Y, Olmstead A, et al. The spread of hepatitis C virus genotype 1a in North America: a retrospective phylogenetic study. Lancet Infect Dis 2016;16:698–702. [DOI] [PMC free article] [PubMed] [Google Scholar]
- 36.Mora MV, Romano CM, Gomes-Gouvea MS, Gutierrez MF, Carrilho FJ, Pinho JR. Molecular characterization, distribution, and dynamics of hepatitis C virus genotypes in blood donors in Colombia. J Med Virol 2010;82:1889–98. [DOI] [PubMed] [Google Scholar]
- 37.Sulkowski MS, Gardiner DF, Rodriguez-Torres M, Reddy KR, Hassanein T, Jacobson I, et al. Daclatasvir plus sofosbuvir for previously treated or untreated chronic HCV infection. N Engl J Med 2014;370:211–21. [DOI] [PubMed] [Google Scholar]
- 38.Federico Hinestrosa F, Marín JI, Maya OM, Santos O, Restrepo JC. Update of Hepatitis C in Colombia. Current Tropical Medicine Reports 2018;5:133–7. [Google Scholar]
- 39.Trickey A, Fraser H, Lim AG, Peacock A, Colledge S, Walker JG, et al. The contribution of injection drug use to hepatitis C virus transmission globally, regionally, and at country level: a modelling study. Lancet Gastroenterol Hepatol 2019;4:435–44. [DOI] [PMC free article] [PubMed] [Google Scholar]
- 40.Shaw JE, Sicree RA, Zimmet PZ. Global estimates of the prevalence of diabetes for 2010 and 2030. Diabetes research and clinical practice 2010;87:4–14. [DOI] [PubMed] [Google Scholar]
- 41.World Health Organization. Fact Sheet on Overweight and Obesity. 2018. Available at: https://www.who.int/news-room/fact-sheets/detail/obesity-and-overweight.Accessed November 20, 2018. [Google Scholar]
- 42.Fan JG, Kim SU, Wong VW. New trends on obesity and NAFLD in Asia. J Hepatol 2017;67:862–73. Report on the most recent prevalence estimates of non-alcoholic fatty liver disease in Asian populations. [DOI] [PubMed] [Google Scholar]
- 43.Yoon KH, Lee JH, Kim JW, Cho JH, Choi YH, Ko SH, et al. Epidemic obesity and type 2 diabetes in Asia. Lancet 2006;368:1681–8. [DOI] [PubMed] [Google Scholar]
- 44.Ramachandran A, Chamukuttan S, Shetty SA, Arun N, Susairaj P. Obesity in Asia--is it different from rest of the world. Diabetes Metab Res Rev 2012;28 Suppl 2:47–51. [DOI] [PubMed] [Google Scholar]
- 45.Makarova-Rusher OV, Altekruse SF, McNeel TS, Ulahannan S, Duffy AG, Graubard BI, et al. Population attributable fractions of risk factors for hepatocellular carcinoma in the United States. Cancer 2016;122:1757–65. [DOI] [PMC free article] [PubMed] [Google Scholar]
- 46.Mourad M, Masri L. Millions flock to free tests as Egypt seeks to eradicate hepatitis C. Reuters, 2018. [Google Scholar]
- 47.Lemoine M, Eholie S, Lacombe K. Reducing the neglected burden of viral hepatitis in Africa: strategies for a global approach. J Hepatol 2015;62:469–76. [DOI] [PubMed] [Google Scholar]
- 48.WHO. WHO Fact Sheet on Hepatitis B. 2018. [Google Scholar]
- 49.Graber-Stiehl I The silent epidemic killing more people than HIV, malaria or TB. Nature 2018;564:24–6. [DOI] [PubMed] [Google Scholar]
- 50.Liu Y, Chang CC, Marsh GM, Wu F. Population attributable risk of aflatoxin-related liver cancer: systematic review and meta-analysis. European journal of cancer (Oxford, England : 1990) 2012;48:2125–36. [DOI] [PMC free article] [PubMed] [Google Scholar]
- 51.Wild CP, Montesano R. A model of interaction: aflatoxins and hepatitis viruses in liver cancer aetiology and prevention. Cancer Lett 2009;286:22–8. [DOI] [PubMed] [Google Scholar]
- 52.Vogel A, Cervantes A, Chau I, Daniele B, Llovet JM, Meyer T, et al. Hepatocellular carcinoma: ESMO Clinical Practice Guidelines for diagnosis, treatment and follow-up. Ann Oncol 2019. [DOI] [PubMed] [Google Scholar]
- 53.Marrero JA, Kulik LM, Sirlin CB, Zhu AX, Finn RS, Abecassis MM, et al. Diagnosis, Staging, and Management of Hepatocellular Carcinoma: 2018 Practice Guidance by the American Association for the Study of Liver Diseases. Hepatology 2018;68:723–50. [DOI] [PubMed] [Google Scholar]
- 54.Ferlay J, Burkhard C, Whelan S, Parkin DM. Check and Conversion Programs for Cancer Registries (IARC/IACR Tools for Cancer Registries). Lyon: IARC Technical Report; No. 42, 2005. [Google Scholar]
Associated Data
This section collects any data citations, data availability statements, or supplementary materials included in this article.
Supplementary Materials
Data Availability Statement
For this study, we utilized liver cancer incidence from publically available cancer registry data: CI5 Volumes V-XI [10], CI5plus [11], and the NORDCAN database [12].