. 2020 Aug 17;9:e58041. doi: 10.7554/eLife.58041

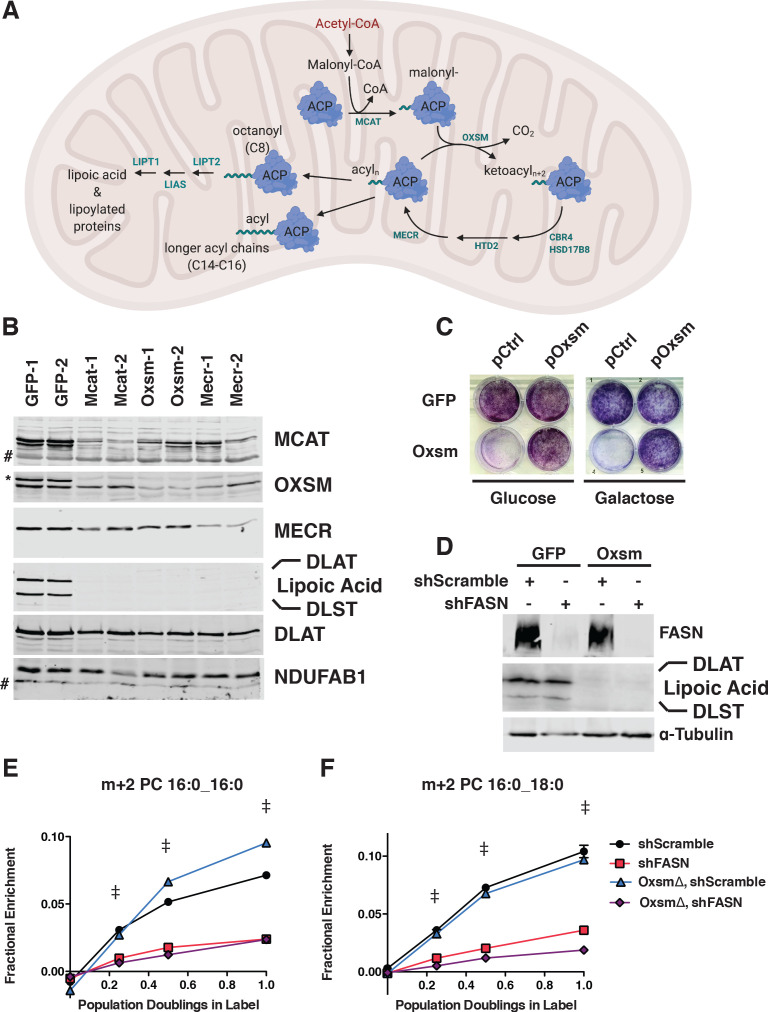
Figure 1. MtFAS is an essential pathway in mammalian skeletal myoblasts but does not contribute to synthesis of major cellular lipids.

(A) Schematic of the mitochondrial fatty acid synthesis pathway and downstream lipoic acid synthesis. (B) Crude isolated mitochondrial fractions from duplicate single cell clones of Mcat, Oxsm, and Mecr mutants, compared with GFP control clonal cell lines, were separated via SDS-PAGE and immunoblotted for the indicated targets. *=Lipoic acid band (reprobe of earlier blot). #=non specific bands C. GFP control and Oxsm mutant cells were infected with retroviral control plasmid (pCtrl) or a plasmid expressing Oxsm off the CMV promoter (pOxsm), plated at equal densities in normal growth medium with either 4.5 g/L glucose or 10 mM galactose and grown for 3 or 4 days, respectively, then stained with crystal violet. (D) Whole cell lysates from stable cell lines generated by infecting Oxsm mutant cells (OxsmΔ) or GFP controls with shRNA constructs targeting FASN (shFASN) or scramble control (shScramble) were separated by SDS-PAGE and immunoblotted for FASN, lipoylated proteins, or tubulin. (E-F) Stable cell lines created in (D) were incubated with U13C-glucose for the indicated number of doublings, harvested, lipids extracted, and analyzed via LC-MS. Shown are quantitation of m+2 isotopologues for two representative phospholipid species, PC 16:0_16:0 and PC 16:0_18:0. †=p < 0.001, ‡=p < 0.0001, error bars are SEM.

Figure 1.

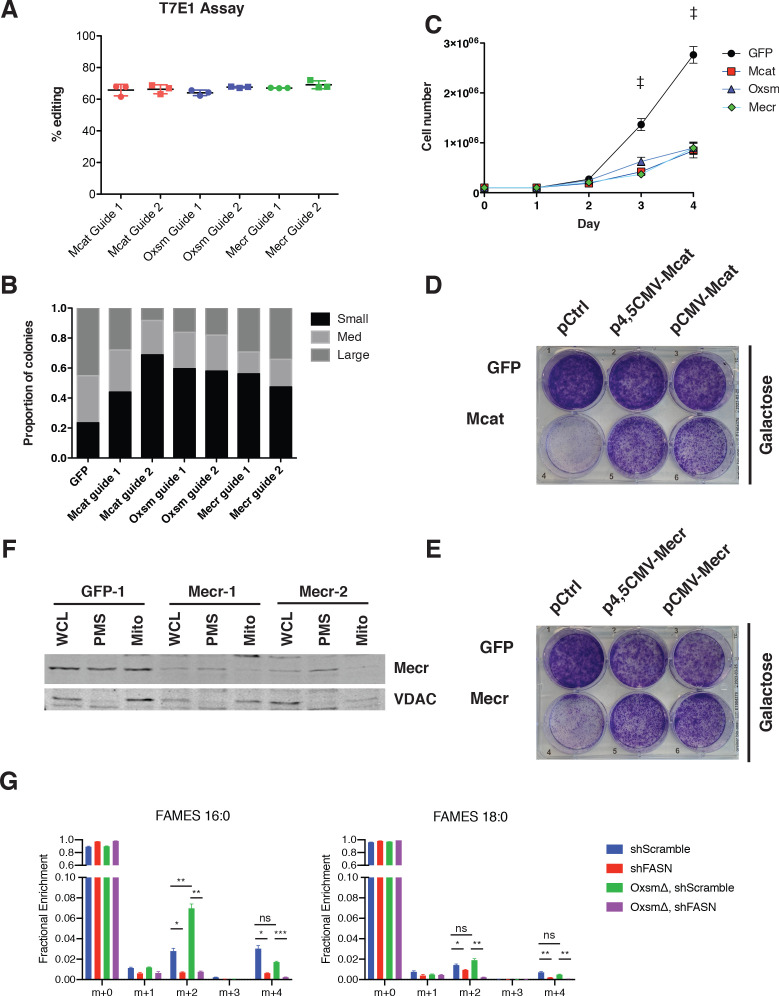
Figure 1—figure supplement 1. mtFAS is required for growth of cultured skeletal myoblasts but does not significantly contribute to cellular fatty acids.

Figure 1—figure supplement 1.

(A) Quantification of T7E1 assay for editing efficiency in bulk transfected C2C12 cells with sgRNAs targeting the indicated mtFAS genes. (B) Quantification of single cell clone colony size 7 days after single cell sort. Small clones = <150 cells, Med = 150–500 cells, Large = >500 cells. (C) Cells were plated at 100,000 cells/plate in 10 cm dishes and counted every 24 hr. #=p < 0.01, all groups compared with control, †=p < 0.001, all groups compared with control, error bars SEM. (D-E) GFP control, Mcat, and Mecr mutant cells were infected with retroviral control plasmid (pCtrl) or plasmids expressing Mcat (D) or Mecr (E) off the truncated (Δ4,5CMV) or full CMV promoters as indicated. Cells were plated at equal densities in normal growth medium without glucose and with 10 mM galactose and grown for 4 days, then stained with crystal violet. (F) Sub-cellular fractionation of Mecr mutant cell lines and control. Whole cell lysate (WCL), post mitochondrial supernatant (PMS), and mitochondrial lysate (Mito) was isolated from each cell line indicated, normalized for total protein via BCA assay, and immunoblotted for Mecr or VDAC as a mitochondrial marker control. (G) Control (GFP) or Oxsm mutant (OxsmΔ) cells were stably infected with shRNA targeting FASN (shFASN) or control (shScramble) then incubated with U13C-glucose for one doubling were harvested, lipids extracted and saponified, and analyzed via FAMES analysis. Shown are quantitation of c16:0 and c18:0 fatty acids. ns = non significant, *=p < 0.05, #=p < 0.01, †=p < 0.001, error bars are SEM.