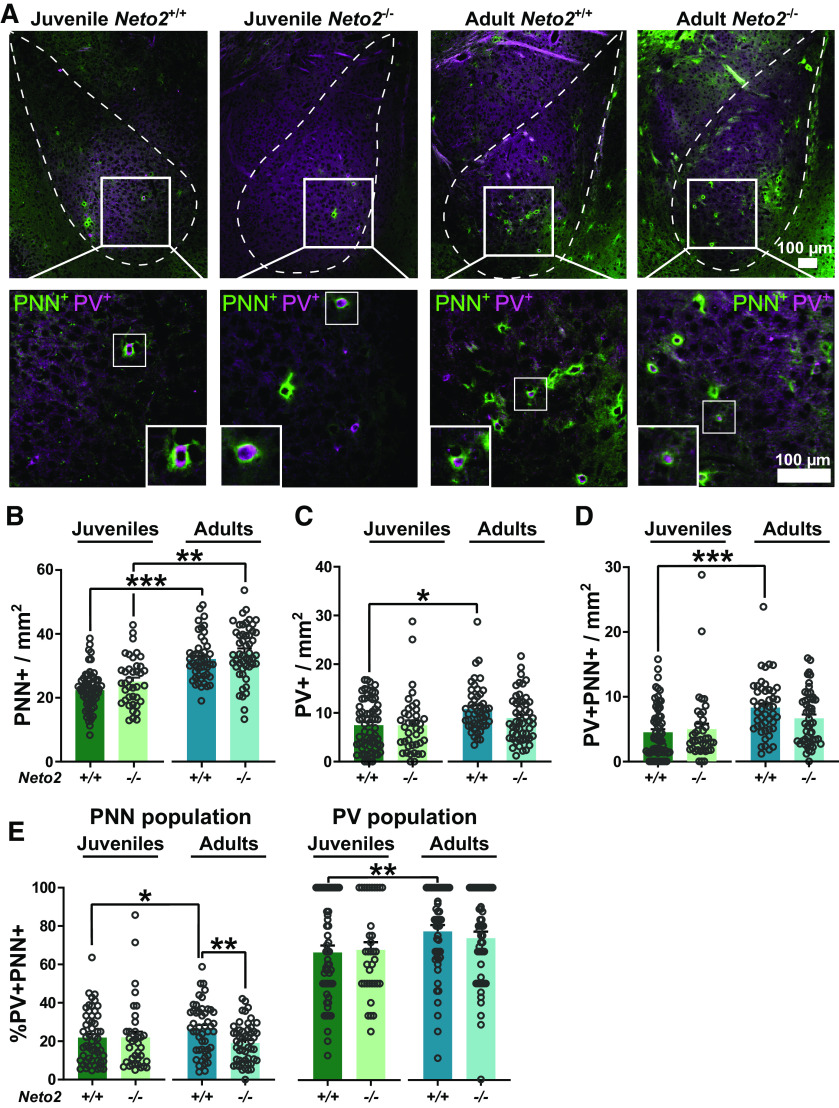
Figure 1.
PV interneuron state of the Neto2−/− amygdala. A, Representative images of WFA (PNN) and PV staining in the amygdala of juvenile and adult mice. Examples of double positive cells are marked with a white square and corresponding close-ups are shown. Abundance of (B) PNN+, (C) PV+, and (D) PV+PNN+ cells in the amygdala of juvenile and adult mice. E, Percentage of PV+PNN+ double positive cells in the total PNN+ cell population and total PV+ cell population. Each dot represents data from one image. Mean ± SEM is shown. Genotype effect calculated using GEE analysis; *p < 0.05, **p < 0.01, ***p < 0.001.

