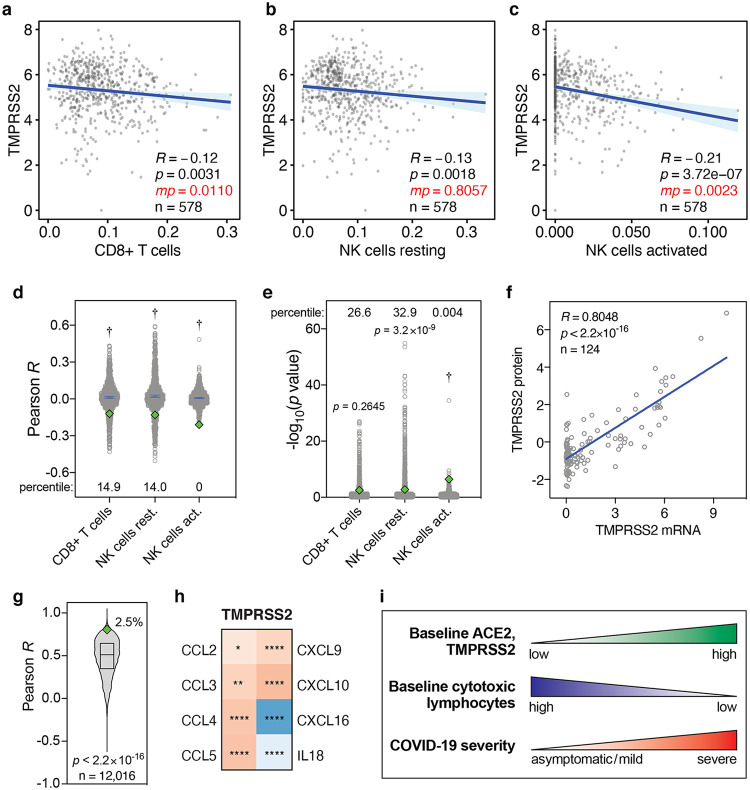
FIG 3.
Levels of TMPRSS2 mRNA, TMPRSS2 protein, and cytokines in lung cells and tissues. (a to c) Pearson correlations between baseline levels of indicated lymphocytes and TMPRSS2 in human lung tissue, as in Fig. 1a to c. Data are from the GTEx data set (n = 578). (d and e) Pearson R and −log10 P values of correlations between 1,000 randomly sampled genes and the levels of indicated lymphocytes in lung tissues, as in Fig. 2a and b. TMPRSS2 Pearson R and P values are shown as green diamonds. (f) Correlations between TMPRSS2 mRNA and protein levels in 124 cell lines. R and P values are from Pearson correlations. (g) Pearson correlation R values between mRNA and protein levels of 12,016 genes are compared to the TMPRSS2 R coefficient (green diamond). The line and box represent the median and interquartile ranges, respectively. The TMPRSS2 R percentile is also shown. The P value is from one-sample t test. (h) Heatmap showing Spearman correlations between the levels of TMPRSS2 and cytokines in human lung tissues from the GTEx data set (n = 578), as in Fig. 2h. (i) Individuals with high baseline levels of ACE2 and TMPRSS2 show low baseline tissue-resident levels of cytotoxic lymphocytes in the lung. I propose that this may jointly predispose these individuals to development of severe COVID-19. P value symbols: *, P < 0.05; **, P < 0.01; ****, P < 0.0001; †, P < 2.2 × 10⁻¹⁶.

