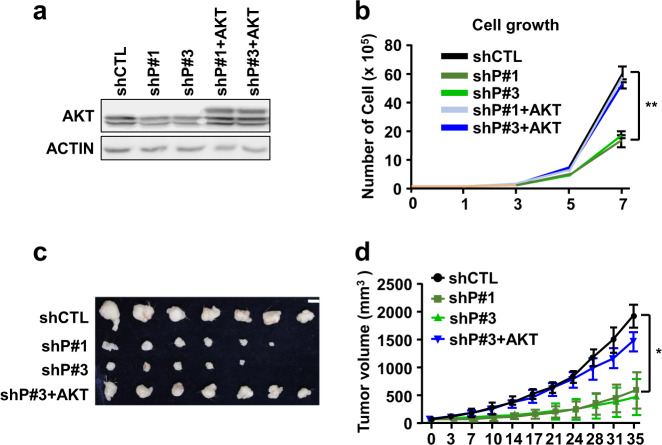
Fig. 4. Active AKT rescues PIERCE1 KD-mediated cell growth retardation.
Western blot analyses for AKT and ACTIN (a) and the growth rates (b) of control (shCTL), PIERCE1 KD (shP#1 and shP#3), and PIERCE1 KD with overexpression of myristoylated AKT (shP#1+AKT and shP#3+AKT) cell lines in A549 cell line. A representative image of xenograft tumors of cell lines 35 days after s.c. injection into nude mice (c) and their growth rates (d). White bar indicates 1 cm. Error bars represent ±SD. Statistical analysis was performed using one-way ANOVA for b and d. *P < 0.05; **P < 0.01.

